


Abstract
Allele-specific expression (ASE) refers to the differential abundance of the allelic copies of a transcript. RNA sequencing (RNA-seq) can provide quantitative estimates of ASE for genes with transcribed polymorphisms. When short-read sequences are aligned to a diploid transcriptome, read-mapping ambiguities confound our ability to directly count reads. Multi-mapping reads aligning equally well to multiple genomic locations, isoforms or alleles can comprise the majority (>85%) of reads. Discarding them can result in biases and substantial loss of information. Methods have been developed that use weighted allocation of read counts but these methods treat the different types of multi-reads equivalently. We propose a hierarchical approach to allocation of read counts that first resolves ambiguities among genes, then among isoforms, and lastly between alleles. We have implemented our model in EMASE software (Expectation-Maximization for Allele Specific Expression) to estimate total gene expression, isoform usage and ASE based on this hierarchical allocation.
Methods that align RNA-seq reads to a diploid transcriptome incorporating known genetic variants improve estimates of ASE and total gene expression compared to methods that use reference genome alignments. Weighted allocation methods outperform methods that discard multi-reads. Hierarchical allocation of reads improves estimation of ASE even when data are simulated from a non-hierarchical model. Analysis of RNA-seq data from F1 hybrid mice using EMASE reveals widespread ASE associated with cis-acting polymorphisms and a small number of parent-of-origin effects.
EMASE software is available at https://github.com/churchill-lab/emase.
Supplementary data are available at Bioinformatics online.
1 Introduction
Allele-specific expression (ASE) refers to the relative abundance of the two alleles of a transcript in a diploid organism. ASE can result from differential rates of transcription, differences in mRNA stability, or other mechanisms that affect transcript abundance. Allelic differences can range in magnitude from subtle quantitative effects to purely monoallelic expression. ASE is driven by factors that are linked to the gene and act in cis to affect transcript abundance. These cis-acting factors may be local genetic variants or epigenetic marks that distinguish maternal and paternal alleles. In the absence of cis-acting variation, trans-acting factors should exert an equal influence on both allelic copies of a gene. Accurate estimation of ASE can provide insight into mechanisms of normal transcriptional regulation and it can reveal allelic dysregulation that may underlie or reflect disease states (Wittkopp et al., 2004).
The advent of RNA sequencing technologies (RNA-seq) has provided a unique opportunity to measure ASE directly (Lister et al., 2008; Nagalakshmi et al., 2008). But the analysis of ASE from RNA-seq data presents new challenges. In particular, while transcribed genetic variation provides the information needed to discriminate the allelic origin of a transcript, allelic differences can also introduce systematic biases in alignment and ASE estimates (Degner et al., 2009).
Quantification of ASE from RNA-seq data begins with alignment of sequence reads to a genome or transcriptome. Single nucleotide polymorphisms (SNP) between the parental genomes enable the allelic origin of some reads to be unambiguously determined and these reads provide the information needed to estimate ASE. Some of the first attempts to estimate ASE from short read RNA-seq data aligned reads to a reference genome, allowing for mismatches in the alignment, and then counted allelic proportions at known SNPs. However, it is now recognized that alignment to a reference genome can bias estimation in favor of the allele that is most similar to the reference (Degner et al., 2009; Munger et al., 2014). Several approaches have been developed to reduce this bias by accounting for known SNPs in the scoring of alignments (Castel et al., 2015; Lalonde et al., 2011; Pickrell et al., 2010; Stevenson et al., 2013). Other methods explicitly represent diploid genomes that incorporate known SNPs (Rozowsky et al., 2011). ASE estimation can also be improved by assigning reads to alleles of a transcript based on all known SNPs (Coolon et al., 2012). These approaches reduce but do not fully remove biases that arise from the initial reference alignment. For example, van de Geijn et al. (2015) showed that reads from non-reference alleles frequently map to multiple genomic locations and would be discarded by these methods. Ideally, all of these challenges—diploid alignment, using information in multiple SNPs and indels, and accounting for ambiguous read alignments—should be addressed in a unified statistical analysis framework.
In this study, we focus on alignment to a diploid transcriptome, which includes sequences from both allelic copies of all transcript isoforms. The diploid transcriptome has a natural hierarchical structure. Genes, the transcribed regions of the genome, are present as two copies, the maternal and paternal alleles, either of which can be transcribed and processed into multiple different isoforms. A transcript originates from one isoform of one allele of one gene but different transcript sequences may be highly similar or even identical to one another. As a result, a short read sequence may align equally well to multiple transcript sequences. Alignment ambiguities can occur at different levels of the hierarchy. Sequence similarity shared across genes can give rise to genomic multi-reads that align to multiple locations in the genome. Exon or exon-junction sharing between transcripts can result in isoform multi-reads that align to more than one isoform of the same gene. Lastly, the absence of distinguishing polymorphisms can give rise to allelic multi-reads that align equally well to both allelic copies of a gene. A single read can display multiple ambiguities at different levels of this hierarchy. Accounting for multi-mapping reads is known to improve estimation of transcript abundance but little attention has been given to the role of these different types of multi-reads in the estimation process.
One approach to resolve multi-reads is to employ an expectation maximization (EM) algorithm to assign probabilistic weights that apportion the read across multiple transcripts. Previously reported EM algorithms for RNA-seq analysis do not differentiate between genomic, isoform and allelic multi-reads (Bray et al., 2016; Li and Dewey, 2011; Patro et al., 2014; Turro et al., 2011). Here, we report an EM algorithm that accounts for the hierarchical structure of the transcriptome. Our method is implemented in open source software, EMASE (https://github.com/churchill-lab/emase). We describe the EMASE algorithm and evaluate its performance using simulated and real data. We use simulated data to evaluate four EMASE models with different hierarchies and compare the performance of EMASE to several widely used methods for estimating ASE. We demonstrate the application of EMASE to real data by analyzing liver RNA-seq data from a reciprocal F1 hybrid cross between two inbred mouse strains.
2 Materials and methods
2.1 Importance of counting multi-reads
RNA-seq data consist of millions of sequence reads obtained from an RNA sample. We represent the transcriptome as a collection of sequence elements, one for each allele of each isoform of each gene, and we assume that each read originated from exactly one element. Some elements of the transcriptome may be highly similar or even identical to one another. There are sequence similarities across gene families; isoforms of a gene may share exons or exon-junctions; and alleles may have a few or no distinguishing polymorphisms. As a result, a read may align to one or more elements in the transcriptome with equal alignment quality. If the best alignment is unique we assume it is correct. Otherwise, we assume the read originated from exactly one of the elements with equally best alignment quality.
Discarding ambiguous or multi-mapping reads is unfortunately a common practice in RNA-seq analysis (Conesa et al., 2016). In addition to loss of information, selectively discarding reads can bias results. The impact of discarding genomic multi-reads on total gene expression has been documented (Li et al., 2010). Relatively less attention has been paid to the impact of discarding isoform and allelic multi-reads but it remains a standard practice to discard these reads on the assumption that they are uninformative (Castel et al., 2015; Kanitz et al., 2015).
To illustrate the potential impact of multi-reads, we counted the different classes in our F1 cross data (Fig. 1). Only ∼14% of all aligned reads are unique (U in Fig. 1) at all levels and the remaining ∼86% of reads are multi-reads for at least one level of the hierarchy. Simple multi-reads are multiply aligned at exactly one level of the hierarchy; they represent 42% of all reads (G + I + A). Complex multi-reads are multiply aligned at two or more levels in the hierarchy; they represent 44% of all reads (GI + GA + IA + GIA). Thus complex multi-reads represent a significant fraction of the total data, and information; these are the reads that are apportioned in different ways depending on what we assume about the hierarchy of genes, alleles and isoforms.
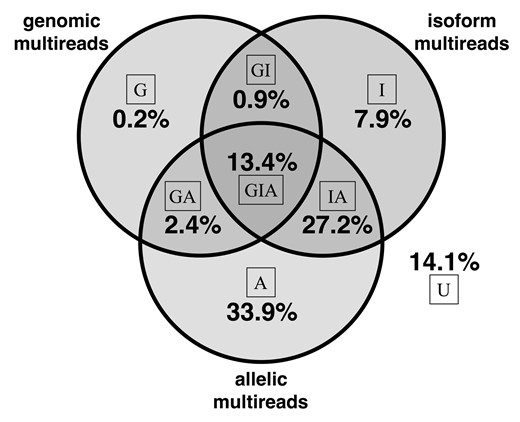
Multi-read proportions in hybrid mouse data. For each read, we determined whether it aligns to multiple genomic locations, multiple isoforms of a gene and multiple alleles. If, for example, a read is a genomic multi-read and is also an isoform multi-read for at least one of its genomic alignments, the read is counted as an isoform multi-read. Complex multi-reads are shown at the intersections of the Venn diagram. The proportion of reads that align uniquely at all levels is 14.1% as shown
Unique reads are simply the complement of multi-reads. They provide critical information needed to assign weights and allocate multi-reads. The majority of reads (83%) are genomic unique (A + I+AI + U). Reads that are both genomic and allelic unique represent 22% (I + U) of the total; these reads are most informative for ASE. In the diploid transcriptome of our F1 animals, 88% of genes have at least one allelic variant site; for genes with no variants there will be no allelic unique reads and we cannot estimate ASE. Reads that are both genomic and isoform unique represent a larger proportion, 48% (A + U) of total reads. However, many of these reads align to single-isoform genes (36% of total reads) and thus only 12% of total reads are informative for distinguishing among isoforms.
2.2 Fitting an EMASE model
We address the problem of resolving multi-reads in RNA-seq data by assigning probabilistic weights to each alignment of a multi-read. Current approaches to resolve multi-reads treat all alignments equally regardless of whether the multiple alignments involve alleles, isoforms or genes (Bray et al., 2016; Li and Dewey, 2011; Nicolae et al., 2011; Patro et al., 2014; Turro et al., 2011). This approach ignores the hierarchical structure of the transcriptome in which a gene may have multiple isoforms and each isoform will have two alleles. As noted above, a single read can be a multi-read at multiple levels in this hierarchy. It is not immediately obvious how to allocate weights for these complex multi-reads.
We implemented four EMASE models (M1, M2, M3 and M4) with distinct hierarchical structures (Fig. 2a). Each model apportions a complex multi-read differently. Under M1, reads are apportioned among genes first, then between alleles, and then among isoforms. Under M2, reads are apportioned among genes first, then among isoforms, and then between alleles. Under M3 reads are apportioned among genes first, then among each isoform-allele combination which are treated equally. Model M4 assumes no hierarchy and multi-reads are apportioned equally among genes, isoforms, and alleles. M4 is implicitly the model used by other EM approaches. Under M4, the gene-level allocation of reads will depend on the number of isoforms that are represented in the transcriptome; genes with more isoforms will receive proportionately higher weights in the allocation of reads that are both genomic and isoform multi-reads. To see why this may be problematic, consider a situation where new isoforms of a gene are discovered and added to the transcriptome. With the new transcriptome definition, this gene will receive a larger share of the read allocation but the evidence that the read originated from this gene has not changed.
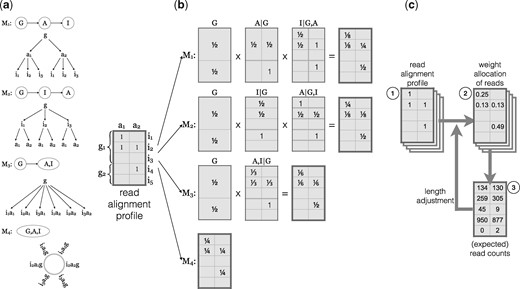
Hierarchical allocation of multi-reads. (a) The EMASE model hierarchies are illustrated for a gene with two alleles and three isoforms . The model hierarchy determines the order in which the alignments of a multi-read are resolved. For example, under EMASE model 1 (M1), we first account for genomic multi-read alignments, then allele alignments and isoform alignments are last to be resolved. Under EMASE model 4 (M4), all alignments of a multi-read are treated equally and are resolved without any order. (b) Probabilistic allocation of a complex multi-read. The alignment profile (left) is an indicator matrix with ‘1’ set at the aligned positions of a multi-read in a diploid transcriptome. Dark gray lines indicate levels of hierarchy within which weights are being allocated. Light gray lines distinguish items in each level of hierarchy. In EMASE, a multi-read is allocated along four different hierarchies. For example, in M1 a read with the given alignment profile is sequentially allocated at the level of gene, then allele and finally isoform. Note that for models M1, M2 and M3, the presence of three alignments to gene g1 is counted as a single event and thus the weight allocated to each gene is . Under M4, each alignment is weighted equally; gene g1 receives of the total weight and gene g2 receives . (c) The EMASE parameter estimation algorithm is carried out iteratively. Each read alignment profile (1) is assigned weights in proportion to the current estimates of transcript proportion (2). Then weights are summed to obtain the expected read counts (3). Counts are normalized by their effective transcript length to obtain new estimates of transcript proportions. This cycle is repeated until the transcript proportion parameters converge
To illustrate how the four EMASE models allocate multi-reads, we constructed a hypothetical example of an alignment profile (Fig. 2b). This is a complex multi-read at all three levels of the hierarchy. M1 first allocates equal weight to each gene; it then allocates weight between the two alleles of gene g1; lastly it allocates weights to isoforms within each gene and allele. Models M2 and M3 make similar allocations but in different orders resulting in different overall allocation of weights. We note that all three model M1, M2 and M3 given equal weight to each gene. In contrast, M4 will apportion weights equally to each alignment such that gene g1 receives weight and gene g2 receives weight. In this example, we applied equally weighted allocations to a single read. Next we describe an iterative algorithm for estimating the allocation parameters that uses data from all of the reads.
An EM algorithm is applied to obtain maximum likelihood parameter estimates for an EMASE model (Fig. 2c). The EM algorithm for EMASE M1 begins with initial estimates of the relative expression of each gene , the allelic proportions for each gene , and the isoform proportions within each allele of each gene . Initial values can be equally weighted as in Figure 2b. The product of these parameters represents the relative abundance of the transcript. In the E-step, current estimates of transcript abundance are used to apportion the unit count of a multi-read among the gene(s), isoform(s) and allele(s) to which it aligns. This process is repeated for each read and the weights are summed across all reads to obtain an expected read count for each transcript. In the M-step, the expected read counts are used to re-estimate the transcript abundance, incorporating an adjustment for the transcript length. The EM algorithm converges to yield maximum likelihood parameter estimates of transcript abundance and expected read counts. We note that expected read counts may not be integers due to the weighted allocation of multi-reads. Transcript abundance is a proportion among all transcripts and it is typically standardized to transcripts per million (TPM). Convergence of the EMASE fitting algorithm is declared when the sum of the absolute TPM changes by <1.0 on consecutive iterations. A detailed description of the EM algorithms is provided in the Supplementary Material.
3 Results
3.1 Performance of EMASE on simulated data
We used simulations to evaluate the performance of EMASE models for estimating total and allele-specific expression and for comparison of EMASE to other approaches. We simulated 12 independent sets of 10 million 68 bp single-end reads using RSEM (Li and Dewey, 2011) version 1.3.0 with input parameters obtained by applying RSEM analysis to eight samples of F1 hybrid cross between mouse strains NOD/ShiLtJ (NOD) and PWK/PhJ (PWK). For the alignment phase of analysis, we generated NOD and PWK transcriptomes by incorporating known strain-specific SNPs and short indels into the reference transcriptome and combined these to form the diploid transcriptome of a NOD × PWK F1 hybrid mouse using g2gtools (https://github.com/churchill-lab/g2gtools) (Supplementary Fig. S1). We built the bowtie (Langmead et al., 2009) index using rsem-prepare-reference and aligned each of the simulated read sets to the diploid NOD × PWK transcriptome using the bowtie aligner to generated BAM files for each of the 12 simulated datasets. Details of the simulations are provided in Section 2.
We fit each of the four EMASE models with these BAM files and carried out head-to-head comparisons between all pairs of models to determine the proportions of genes or isoform for which each method provided estimates of ASE or total expression that are closer to the simulated truth. For ASE, we report comparisons of EMASE model M2 against the other methods (Table 1 and Supplementary Figs S2–S4). For total expression, we report comparisons between EMASE model M2 and the other EM methods (Supplementary Table S1 and Figs S5 and S6).
Head-to-head model comparisons
| (a) Comparing M2 with other EMASE models | ||||
|---|---|---|---|---|
| M1 | M3 | M4 | ||
| % of Genes: | ||||
| M2 is better | 11.5 ± 0.2 | 1.1 ± 0.1 | 2.3 ± 0.2 | |
| The other is better | 3.3 ± 0.1 | 0.6 ± 0.1 | 2.0 ± 0.1 | |
| % of Isoforms: | ||||
| M2 is better | 16.9 ± 0.2 | 18.2 ± 0.2 | 18.7 ± 0.2 | |
| The other is better | 11.0 ± 0.2 | 12.2 ± 0.2 | 13.1 ± 0.2 | |
| (b) Comparing M2 with other existing methods | ||||
| RSEM | kallisto | Unique | WASP | |
| % of Genes: | ||||
| M2 is better | 3.7 ± 0.2 | 7.1 ± 0.3 | 6.2 ± 0.1 | 26.2 ± 0.8 |
| The other is better | 2.9 ± 0.1 | 4.4 ± 0.2 | 2.6 ± 0.1 | 5.1 ± 0.2 |
| % of Isoforms: | ||||
| M2 is better | 19.8 ± 0.3 | 22.2 ± 0.2 | 13.6 ± 0.2 | N/A |
| The other is better | 13.2 ± 0.2 | 14.0 ± 0.2 | 5.6 ± 0.1 | N/A |
Note: For each pair of methods, we consider only those genes for which one or both estimates of ASE deviate by 5% or more from simulated truth. We then tabulated the proportion of genes or isoforms for which one model is closer to the truth. The pairwise comparisons are summarized relative to EMASE model M2. WASP does not provide isoform-level estimation. See Supplementary Figures S2–S6.
For ASE estimation, we considered the estimates obtained from two methods to be equivalent if the difference between the absolute deviations of estimated values from the simulated truth is 5% or less. In comparison to the other EMASE models, the M2 estimates are more often closer to the true values. The difference is most pronounced in comparison to M1 at the gene-level where 11.5% of genes were better estimated by M2 and only 3.3% were better estimated by M1. The differences among the EMASE model comparisons are less pronounced at the isoform level. In comparisons to the other estimation methods, M2 is consistently best and the next best performance is from RSEM followed by kallisto and unique-reads. The performance of WASP is an outlier—M2 provided substantially better estimates of ASE for 26.2% of all genes.
We compared EMASE model M2 estimates of total gene expression to the other EM based methods. Estimates were considered to be equivalent if they are within 5% relative difference. At the gene level, estimates from EMASE models M1, M2 and M3 are essentially identical and the minor differences (0.1%) can be attributed to convergence of the EM fitting algorithm. In comparison to model M4, we see that the M2 estimates are closer to truth for 1.4% of genes and M4 estimates are closer to truth for 5.5% of genes. Model M2 outperforms both RSEM and kallisto at the gene-level. At the isoform level, we see very similar performance among M1, M2 and M3. Model M4 is closer to truth than M2 for 12.7% of isoforms and RSEM also outperforms M2 in this comparison. We conclude that the best estimates of total gene expression are obtained using either EMASE model M4 or RSEM, but we note that all of the EM methods are performing within a few percentage points of one another. For both ASE and total expression, EMASE model M2 was overall best but not best in every comparison.
We examine the distribution of allele proportions in the simulated data (Supplementary Fig. S7a) and estimated allelic proportions by EMASE M2, RSEM, kallisto, WASP and unique-reads methods (Supplementary Fig. S7). In total, ∼22% and ∼14% of reads are allelic unique at the gene and isoform level, respectively. EM-based methods [Supplementary Fig. S7(b–d)] produced a smooth, bell-shaped distribution similar to the true distribution but with increased variation that reflects estimation error. WASP failed to estimate allele proportion in over 2200 genes compared to the other methods. The overall distribution of ASE obtained from WASP was skewed toward NOD alleles, which are more similar to the mouse reference genome (Supplementary Fig. S7e). For these reasons, we conclude that post-processing allele specificity after reference alignment is not fully correcting the reference alignment bias. The unique-reads method (Supplementary Fig. S7f) resulted in a symmetric distribution of allele proportions but with greater estimation error. We observed a 13% increase in variance at the gene-level and 39% increase at the isoform-level compared to EMASE model M2. Our implementation of the unique-reads method is unbiased due to the alignment to a customized transcriptome but estimates of ASE are more variable than EM and there are more monoallelic calls.
It is often of interest to classify the ASE state of genes as monoallelic versus bi-allelic expression. In this simulation, we call a gene monoallelic if its estimated allele proportion is <2% or >98%. It is also of interest to classify genes as expressed or not-expressed. We call a gene with expected read count <1.0 as not-expressed. Based on these classification rules, we compared the precision-recall of each model (Supplementary Table S2 and Figs S8 and S9).
The classification results for ASE are summarized in Supplementary Table S2a. EMASE model M2 reported the smallest number of false monoallelic expression calls: 168 ± 9 versus 196 ± 13 (EMASE M4), 203 ± 14 (RSEM), 228 ± 12 (kallisto), 264 ± 13 (unique-reads method) or 735 ± 37 (WASP) across 12 samples. Precision—the proportion of monoallelic calls that are true—is around 50% for all of the ASE estimation methods with the exception of WASP for which only 16.4% of monoallelic calls were correct. Recall—the proportion of true monoallelic expressions that are called—is more variable across the ASE estimation methods with best performance reported for the unique-reads method followed by EMASE model M4, RSEM and kallisto. At the isoform level, we can see a similar result. EMASE model M1 and M2 achieved the best precision, in excess of 60%, and the unique-reads method had the best recall of 93.7%, closely followed by EMASE model M4, RSEM and kallisto.
Classification results for total expression are summarized in Supplementary Table S2b. Precision and recall are consistently above 97% for each of the EM-based methods. Classification performance at the isoform-level is also consistently high across the EM-based estimation methods.
To evaluate the performance of correctly identifying genes with ASE, we performed significance testing for ASE on the true read counts using Beta-Binomial model (See Supplementary Material Section 2.7). We then performed significance tests using the read counts estimated from each of the methods being evaluated on 10 035 genes that had at least one read with a SNP or indel to distinguish alleles and with a minimum estimated read count of 25. When the estimated read counts did not meet these criteria, the outcome was recorded as ‘no-call’, otherwise we reported the outcome of the test as true positive, true negative, false positive, or false negative (unadjusted P0.01), based on concordance with the outcome of the test on the true counts (Table 2). We observed that the EM methods substantially outperform WASP and Unique-reads. The latter methods display an excessive number of false-positive outcomes and high rates of no-calls.
Performance of EMASE, RSEM, kallisto, unique-reads and WASP on identifying ASE using significance tests with Beta-Binomial model at on simulated data
| Method | True positive | True negative | False positive | False negative | No call |
|---|---|---|---|---|---|
| EMASE M2 | 4595 | 2805 | 115 | 2459 | 61 |
| RSEM | 4519 | 2827 | 86 | 2524 | 79 |
| kallisto | 4406 | 2808 | 102 | 2624 | 95 |
| unique-reads | 3038 | 1518 | 96 | 1351 | 4032 |
| WASP | 1864 | 823 | 251 | 1245 | 5852 |
We compared the overall accuracy of ASE and total expression estimation on the 12 simulated samples (Supplementary Table S3). To determine the accuracy of ASE, we computed the proportion of genes or isoforms for which the absolute differences between estimated and true ASE is <0.1 (Supplementary Table S3a). For gene-level estimates models M2 and M4 were equally best in performance and M2 was best for isoform-level ASE estimation. When we compared EMASE with the other EM methods, RSEM and kallisto, they all fell within a few percentage points of one another with kallisto having only marginally lower accuracy. The unique-reads method and WASP have substantially lower accuracy compared to EM methods. At the gene-level, WASP estimates of ASE fell within 10% of truth for fewer than half of genes. Isoform level estimates are not available with WASP.
To evaluate estimation of total gene expression among the EM based methods we computed the proportions of genes or isoforms for which the relative difference between estimated and true values was <10% (Supplementary Table S3b). At both gene and isoform-level, M4 was most accurate based on number of genes that fell within 10% of the true value (Supplementary Table S3b). All of the EM based methods have similar accuracy for total gene expression (∼85%) and for total isoform expression (∼40%). Kallisto has slightly lower accuracy and, as expected, total expression estimates for EMASE models M1, M2 and M3 are essentially identical.
In summary, the EMASE models M2 and M4 estimates consistently provided the best or close to best estimates of both total expression and allelic proportion in our simulations. The same can be said for the RSEM estimates. Estimates obtained using kallisto were also consistently good but often not as accurate as the other EM methods—this may reflect some loss of information in the fast pseudo-alignment strategy. Among the non-EM methods, the unique-reads method (with alignment to the custom diploid transcriptome) provided consistent but less precise estimation. The WASP algorithm, which relies on a reference alignment strategy, performed poorly in all evaluations using simulated data.
3.2 ASE in F1 hybrid data
We applied EMASE to RNA-seq data from a reciprocal F1 hybrid cross between mouse strains NOD and PWK (Supplementary Fig. S10). There were 48 male mice in total with 24 mice from each direction of the cross (NOD × PWK and PWK × NOD). In order to evaluate the extent of ASE, we applied EMASE model M2 to estimate the PWK allele proportions for 9102 informative autosomal genes (see Section 2). This distribution of estimated ASE is symmetric (Supplementary Fig. S11a) indicating that there are no strain-specific biases. Monoallelic expression was observed for NOD alleles at 173 genes and for PWK alleles at 174 genes in the NOD × PWK samples. Monoallelic expression was observed for NOD alleles at 150 genes and for PWK alleles at 152 genes in the PWK × NOD samples. These are median values over the 24 samples in each cross direction. Numbers of monoallelic expressed genes varied from 115 to 454 in individual samples.
Male F1 mice from the two reciprocal crosses are hemizygous for the X chromosomes. We included both X chromosomes in our transcriptome definition in order to evaluate the misclassification rate of monoallelic expression. The majority of X chromosome genes (85% and 82% in NOD × PWK and PWK × NOD, respectively) demonstrated monoallelic expression for the correct X chromosome (Supplementary Fig. S11a). Among the genes that show bi-allelic expression, 65% of the genes have fewer than five SNPs or indels to distinguish between alleles and others (35%) share sequence similarity and genomic multireads with autosomal genes.
We evaluated the statistical significance of ASE using the beta-binomial test (See Supplementary Material Section 2.7 and Supplementary Table S1). We identified 4216 genes (at FDR 5%) for NOD × PWK mice and 3869 genes (at FDR 5%) for PWK × NOD mice with overlap of 3084 genes (P <2.2). This suggests that ASE is pervasive (affecting >35% of genes) and consistent across different groups of animals. A scatterplot of ASE estimates from each direction of cross reveals a striking level of concordance (r2 = 0.831) (Supplementary Fig. S11b) and suggests that ASE is continuously distributed with variable degrees of allelic imbalance across the genome.
We observed a handful of genes with a reversal in the PWK allele proportion between the two crosses, consistent with a parent-of-origin effect on ASE (Supplementary Table S2). In order to evaluate their significance we employed a logistic regression with a quasi-binomial likelihood (Agresti, 2002) and direction of cross as a predictor. We identified 70 genes with significant parent-of-origin effect, at 5% FDR (Supplementary Fig. S12). The strongest effects were restricted to genes that are already known to be imprinted, including Igf2r, Peg3, Zrsr1, H13 and Impact. We conclude that parent-of-origin effects are limited to a small number of well-characterized genes in adult mouse liver (Supplementary Fig. S11b). We also tested the effect of diet and age on ASE using the overdispersed logistic model and found 12 genes with significant diet effect and 112 genes with a significant age effect on ASE at 5% FDR threshold. These results suggest that allele-specificity is relatively insensitive to the diets and range of ages of mice in this study.
4 Discussion
Until recently access to individual whole genome sequences has been out of reach for most organisms but sequencing of individual genomes of humans and model organisms is now proceeding rapidly. When individual genomes are not directly available, high-density genotyping arrays and variant databases can support imputation and phasing to obtain accurate approximations of individual diploid genomes. Hybrid mouse genomes, such as the NOD × PWK F1 animals used here, are straightforward to construct; they serve as a proof-of-principle for future applications of individually targeted RNA-seq analysis. ASE estimation based on reference genome alignment suffers from bias even when secondary analyses are applied to account for misaligned reads. We recommend, whenever possible, to use an individually tailored diploid transcriptome incorporating known or imputed genetic variants as an alignment target for RNA-seq analysis.
EMASE software works with BAM format files that can be produced by most short-read alignment software. It requires alignment to a collection of discrete sequence elements such as a transcriptome. The transcriptomes of human, mouse and other well-studied organisms are refined and well annotated. There is always room for improvement but for the present we rely on the reference transcriptome and adjust individual sequence elements to incorporate known or imputed SNPs and small indels. The impact of errors or individual variations in the set of the transcribed elements is not clear but will result in failure of some RNA-seq reads to align to their correct origin or failure to align to any element. New alignment strategies that operate on whole genomes but are transcriptome-aware could help to address some of these concerns (Kim et al., 2015).
EMASE achieves up to 1000 fold data reduction from BAM alignment format to the read alignment matrix. This reduction entails loss of information about the details of read alignments but this does not appear to impact the accuracy of estimation. Computing time for EMASE is substantially faster than RSEM but not as fast as k-mer methods such as kallisto. This suggests that detailed information about the aligned sequences is of limited value and that counting aligned reads is sufficient for accurate estimation (See Supplementary Material Section 1.2 for details).
The EMASE algorithm is readily adaptable to other contexts. All that is required is an alignment target composed of discrete sequence elements and a hierarchy. EMASE has been adapted to estimate allele-specific binding using ChIP-seq data (Baker et al., 2015) by defining sequence elements around DNA binding sites and applying a two-level hierarchy for sites and alleles. We have implemented an exon-junction version of EMASE as an alternative to the transcript isoform model presented here (Raghupathy et al., unpublished). EMASE has been adapted to analyze multiparent populations (http://churchill-lab.github.io/gbrs) with alleles assigned to eight (or any number of) haplotype classes (Chick et al., 2016). We anticipate the development of EMASE applications to allele-specific methylation, allele-specific RNA editing and more.
Evaluation of RNA-seq analysis methods requires complex and realistic simulated data. Any simulation software makes assumptions that will affect the properties of the simulated data and the outcome of evaluations. After testing several simulation tools (Frazee et al., 2015; Griebel et al., 2012) including our own EMASE simulator, we decided to base our simulation studies on the RSEM simulator (Li and Dewey, 2011), which we found to be well documented and easy to implement. We obtained input parameters for the simulations using values estimated from our F1 hybrid mouse data by RSEM. Thus both the input parameters and the simulated data were obtained from a non-hierarchical model that is most similar to EMASE model M4. RNA-seq simulations can be sensitive to other choices such as whether and how to simulate poly-A tails and how to introduce sequencing errors. We compared estimated read counts and allelic- or isoform-proportions of read counts as the outcome measure for comparison of different analysis tools. Alternative measures such as transcripts per million (TPM), are widely used but each of the software tool had its own unique method of computing the transcript length adjustment for converting read counts to TPM. Read counts are the starting point for most normalization and downstream analysis methods, for example in voom (Law et al., 2014), edgeR (Robinson et al., 2010) and DESeq2 (Love et al., 2014).
In order to assess the extent to which these simulations might have favored RSEM or EMASE model M4, we simulated read counts using our EMASE simulator according to the model M2 hierarchy and compared analysis results between model M2 (with hierarchy) and model M4 (without). In this setting, model M2 significantly outperforms model M4 (Supplementary Figs S13a and b) but only on the multi-isoform genes (Supplementary Figs S13c and d). This is consistent with our expectations for the hierarchical model (see Fig. 2). When isoforms are treated independently (as in M4 and RSEM), multi-reads will be distributed with more weight given to genes with more isoforms. The RSEM simulations indicate any of the EM-based methods for ASE estimation methods perform more-or-less equally well. Our preference for the hierarchical models, specifically M2, rests on the argument that the weights assigned to multi-reads should not depend on the number of annotated isoforms of a gene. One problem we face in evaluating these methods is that there is currently no way to know which of the many available simulation models best reflects the real biology of transcriptional regulation. Establishing standards for simulation-based evaluation of RNA-seq analysis is an area in need of further attention.
EMASE estimates read counts at the level of transcriptome elements corresponding to individual isoforms and alleles of a gene. It can also aggregate counts at the gene-level and report average ASE across isoforms or isoform usage across alleles. If allelic proportions vary widely between isoforms, the gene-level average ASE may have little meaning. On the other hand when there is a dominant isoform or when ASE is consistent across isoforms, the gene-level summary will be more accurate due to the larger numbers of reads that are available to estimate ASE. Aggregate summaries of ASE are useful but should be viewed with caution. To obtain the best estimates of ASE, we recommend fitting model M2 and aggregating counts across isoforms—after checking that the isoform level estimates are not widely divergent.
EMASE explicitly models the different types of multi-reads and uses a hierarchical strategy to allocate weights. Our first implementation of EMASE was based on the hierarchy of model M1. It seemed logical because transcription acts first on an allele and splicing follows to produce the isoform. Yet model M1 consistently underperforms in comparison to other EMASE models. To understand the difference between models M1 and M2 in particular, we note that 86% of all reads are genomic unique, 50.6% of reads are isoform-unique and 23.1% of reads are allele-unique. Thus we have more information to distinguish among isoforms than we have to distinguish among alleles. In addition, allelic-unique reads are typically defined by one or by a small number of SNPs; whereas isoform-unique reads can be distinguished across most or all of the nucleotides in the read. As a result we have more information to accurately allocate weights across isoforms compared to alleles. And we have the most information available to allocate multi-reads across genes. Our original motivation for constructing the EMASE hierarchy was based on the biology of transcription but a more pertinent consideration for determining the hierarchy is the information content of the data. We obtained the best results when we allocate at the most informative level first and the least informative level last. The differences in performance among the EMASE algorithms reflect this.
In selecting methods for comparison to EMASE, we chose to focus on software tools that exemplify best practices for each of the most widely used approaches to ASE estimation. We implemented each tool as recommended by their developers. Each method involves a series of steps and uses parameter settings that have been optimized by the developers for their analysis pipeline. The most relevant differences among these methods are in the choice of the alignment target, the method of aligning reads and the method of resolving multi-reads (summarized in Supplementary Table S4). While we cannot fully disentangle the effects of each of these choices, we can draw the follow broad conclusions. Methods that use a diploid transcriptome outperform reference-based methods. The EM methods outperform methods that discard multi-reads. Among the EM methods, kallisto is extremely fast but has slightly poorer performance. Both kallisto and RSEM capture fewer reads compared to EMASE for reasons that we donto fully understand. Adding a hierarchy to the EM algorithm results in small performance improvements relative to RSEM even when data are simulated using the RSEM model. The biggest performance gains are due to diploid alignment and retaining multi-reads by using one of the EM methods.
In summary, ambiguity in read alignment presents a significant challenge for RNA-seq analysis. While it is tempting to discard multi-reads, this can lead to bias and reduced precision in estimation. Ambiguity in read alignment can be addressed by proportionately allocating counts using an EM algorithm. There are several EM algorithm implementations available, including EMASE, and they all perform well in head-to-head comparisons. EMASE resolves multi-reads by specifying a hierarchy among genes, isoforms and alleles and we have found that the hierarchy of EMASE model M2 has generally the best performance. However, the differences reported in our evaluations are small and we would recommend the use of any these EM methods in practice.
Funding
This work has been supported by the National Institute of General Medical Sciences (NIGMS) grant P50-GM076468.
Conflict of Interest: none declared.
References
Author notes
The authors wish it to be known that, in their opinion, Narayanan Raghupathy and Kwangbom Choi authors should be regarded as Joint First Authors.

