


Abstract
Indexing reference sequences for search—both individual genomes and collections of genomes—is an important building block for many sequence analysis tasks. Much work has been dedicated to developing full-text indices for genomic sequences, based on data structures such as the suffix array, the BWT and the FM-index. However, the de Bruijn graph, commonly used for sequence assembly, has recently been gaining attention as an indexing data structure, due to its natural ability to represent multiple references using a graphical structure, and to collapse highly-repetitive sequence regions. Yet, much less attention has been given as to how to best index such a structure, such that queries can be performed efficiently and memory usage remains practical as the size and number of reference sequences being indexed grows large.
We present a novel data structure for representing and indexing the compacted colored de Bruijn graph, which allows for efficient pattern matching and retrieval of the reference information associated with each k-mer. As the popularity of the de Bruijn graph as an index has increased over the past few years, so have the number of proposed representations of this structure. Existing structures typically fall into two categories; those that are hashing-based and provide very fast access to the underlying k-mer information, and those that are space-frugal and provide asymptotically efficient but practically slower pattern search. Our representation achieves a compromise between these two extremes. By building upon minimum perfect hashing and making use of succinct representations where applicable, our data structure provides practically fast lookup while greatly reducing the space compared to traditional hashing-based implementations. Further, we describe a sampling scheme for this index, which provides the ability to trade off query speed for a reduction in the index size. We believe this representation strikes a desirable balance between speed and space usage, and allows for fast search on large reference sequences.
Finally, we describe an application of this index to the taxonomic read assignment problem. We show that by adopting, essentially, the approach of Kraken, but replacing k-mer presence with coverage by chains of consistent unique maximal matches, we can improve the space, speed and accuracy of taxonomic read assignment.
pufferfish is written in C++11, is open source, and is available at https://github.com/COMBINE-lab/pufferfish.
Supplementary data are available at Bioinformatics online.
1 Introduction
Motivated by the tremendous growth in the availability and affordability of high-throughput genomic, metagenomic and transcriptomic sequencing data, the past decade has seen a large body of work focused on developing data structures and algorithms for efficiently querying large texts (e.g. genomes or collections of genomes) (Dobin et al., 2013; Hach et al., 2010; Kim et al., 2015; Langmead and Salzberg, 2012; Langmead et al., 2009; Li, 2013; Li and Durbin, 2009; Li et al., 2008; Liao et al., 2013). While numerous approaches have been proposed, many fall into one of two categories—those based on indexing fixed-length pattern occurrences (i.e. k-mers, which are patterns of length k) in the reference sequences (Hach et al., 2010; Li et al., 2008; Liao et al., 2013) (most commonly using hashing), and those based on building full-text indices such as the suffix array or FM-index over the references (Dobin et al., 2013; Kim et al., 2015; Langmead and Salzberg, 2012; Langmead et al., 2009; Li, 2013; Li and Durbin, 2009).
Recently, there have been efforts to extend both categories of approaches from the indexing of linear reference genomes to the indexing of different types of sequence graphs (Paten et al., 2017), with various tradeoffs in the resulting space and time efficiency. On the full-text index side, examples include approaches such as those of Maciuca et al. (2016) and Beller and Ohlebusch (2016) which encode the underlying graph using variants of the BWT, and the approach of Sirén (2017), which indexes paths in the variation graph (again making use of a substantially modified BWT). There have also been recent approaches based on k-mer -indices that adopt graphs as the underlying representation of the text being searched. Examples of such tools include genomeMapper (Schneeberger et al., 2009), BGREAT (Limasset et al., 2016), kallisto (Bray et al., 2016) and deBGA (Liu et al., 2016).
Rather than general variation graphs, we focus in this manuscript on the de Bruijn graph. The de Bruijn graph is a widely-adopted structure for genome and transcriptome assembly (Grabherr et al., 2011; Haas et al., 2013; Pevzner et al., 2001). However, the compacted variant of the de Bruijn graph has recently been gaining increasing attention both as an indexing data structure—for use in read alignment (Liu et al., 2016) and pseudoalignment (Bray et al., 2016)—as well as a structure for the analysis of variation (among multiple genomes) (Minkin et al., 2016) and a reference-free structure for pan-genome storage (Holley et al., 2016). The compacted de Bruijn graph (Chikhi et al., 2014; Minkin et al., 2013; Movahedi et al., 2012) (see Section 2) is particularly attractive for representing and indexing repetitive sequences, since exactly repeated sequences of length at least k are represented only once in the set of unique, non-branching paths. As has been demonstrated by Liu et al. (2016), this considerably speeds up alignment to repeat-heavy genomes (e.g. the human genome) as well as to collections of related genomes. A similar concept of collapsing repetitive regions—though not based on the de Bruijn graph formalism—has been introduced by Yorukoglu et al. (2016) in the compressive read mapper, CORA, to enable impressive speed-ups for existing aligners through a plug-in architecture. Herein, we consider collections of genomes to be represented as color information on the de Bruijn graph [as described by Iqbal et al. (2012); see Section 2 below for details]. Efficient representation of multiple samples, encoded as colors in a de Bruijn graph, has been investigated in tools such as VARI (Muggli et al., 2017) and Rainbowfish (Almodaresi et al., 2017). Both VARI and Rainbowfish have implemented a data structure to efficiently index color encoding on top of a succinct navigational representation of a de Bruijn graph, proposed in BOSS (Bowe et al., 2012). However, none of these tools are equipped with membership queries and sequence search and are, hence, regarded as out of scope in this paper.
The query speed of existing compacted de Bruijn graph indices comes at a considerable cost in index size and memory usage. Specifically, the need to build a hash table over the k-mers appearing in the de Bruijn graph unipaths requires a large amount of memory, even for genomes of moderate size. Typically, these hash functions map each k-mer (requiring at least 8 bytes) to the unipath in which it occurs (typically 4 or 8 bytes) and the offset where the k-mer appears in this unipath (again, typically 4 or 8 bytes). A number of other data structures are also required, but, most of the time, this hash table dominates the overall index size. For example, an index of the human genome constructed in such a manner (i.e. by deBGA or kallisto) may require 40–100GB of RAM (see Table 2). This already exceeds the memory requirements of moderate servers (e.g. those with 32G or 64G of RAM), and these requirements quickly become untenable with larger genomes or collections of genomes.
2 Preliminaries
In this section, we formally define the preliminary terms and notations that are used throughout the manuscript. We consider all strings to be over the alphabet . A k-mer is a string of length k over Σ (i.e. ). Given a k-mer, x, we define the reverse complement of x by ; this is a string obtained by reversing x and then complementing each character according to the rule . We define the canonical representation of a k-mer, x, by , where the minimum is taken according to the lexicographic ordering. In this manuscript, we are fundamentally interested in indexing a collection of reference sequences (be they pre-existing, or assembled de novo); we, therefore, adopt the following definitions with respect to the de Bruijn graph and its variants. The de Bruijn graph is a graph, , built over the k-mers of some reference string, s. We define s(k) as the set of k-mers present in s, and assume that s is of length at least k (i.e. ). The vertex set of G is given by . There exists an edge between two vertices u and v if and only if there exists some -mer, z, in S such that u is a prefix of z and v is a suffix of z. The colored de Bruijn graph associates each with some specific set of colors. When building the de Bruijn graph over a collection of reference strings , we define the color set for a vertex to be the set of references in which it appears (i.e. colors). Finally, we define the compacted colored de Bruijn graph to be the color-coherent compaction of a colored de Bruijn graph. A compacted de Bruijn graph replaces each non-branching path, , in G with a single edge (which no longer represents a single k-mer, but instead represents the entire string that would be spelled out by walking from u to v in an orientation consistent manner). We say that such a compaction is color-coherent if and only if all vertices share the same color set. The compacted colored de Bruijn graph is the graph obtained by performing a maximal color-coherent compaction of the colored de Bruijn graph.
3 Methods
We present pufferfish, a software tool implementing a novel indexing data structure for the compacted de Bruijn graph and the colored compacted de Bruijn graph. We focus on making the compacted de Bruijn graph index practical in terms of disk and memory resources for genomic and metagenomic data while maintaining very fast query speeds over the index. While, we are conscious of memory usage, we do not aim to build the smallest possible index. Furthermore, we introduce two different variants of our index, the dense and sparse pufferfish indices. Similar to the FM-index (Ferragina and Manzini, 2001), in the sparse pufferfish index, there is a sampling factor that can be tuned to trade off search speed for index size. The dense index is, in a sense, just a variant of the sparse index tuned for maximum speed (and, hence, taking maximum space). However, as we believe the dense index will be a popular choice, we implement a few optimizations and describe the structures separately.
3.1 Pre-processing
We assume as input to pufferfish the compacted de Bruijn graph on the reference or set of references to be indexed. The pufferfish software itself accepts as input a graphical fragment assembly (GFA) format (https://github.com/GFA-spec/GFA-spec) file that describes the compacted de Bruijn graph. Specifically, this file encodes the unipaths (i.e. non-branching paths) of the compacted de Bruijn graph as ‘segments’ and the mapping between these unipaths and the original reference sequences as ‘paths’. Each path corresponds to an input reference sequence (e.g. a genome), and is spelled out by an ordered set of unipath IDs and the orientation with which these unipaths map to the reference, so that each unipath has an overlap of k − 1 with its following unipath in the path (either in the forward- or reverse-complement direction).
GFA is an evolving standard that is meant to be a common format used by tools dealing with graphical representations of genomes or collections of genomes. We note that there are a number of software tools for building the compacted de Bruijn graph directly (i.e. without first building the un-compacted de Bruijn graph). We adopt TwoPaCo (Minkin et al., 2016), which employs a time and memory-efficient parallel algorithm for directly constructing the compacted de Bruijn graph, and whose output can be easily converted into GFA format. We note that, due to a technical detail concerning how TwoPaCo constructs the compacted de Bruijn graph and the GFA file, the output cannot be directly used by pufferfish. Therefore, the current workflow of pufferfish includes a GFA-to-GFA converter that prepares the TwoPaCo -generated GFA file for indexing by pufferfish (detailed in Supplement Section S1). We note that TwoPaCo (and therefore pufferfish) consider the edge-explicit de Bruijn graph. That is, two k-mers will be connected if and only if the input reference contains a -mer having one of these k-mers as its left k-mer and the other as its right k-mer. Conversely, other tools, like BCALM2 (Chikhi et al., 2016) and kallisto consider the induced-edge de Bruijn graph, where there will be an edge between any pair of k-mers overlapping by k − 1 nucleotides, regardless of whether or not a -mer containing them exists in the input. This leads to small but persistent differences in the topology of these graphs, as is further detailed in Supplementary Table S1.
3.2 The dense pufferfish index
The index consists of 6 components (and an optional seventh component), and the overall structure is similar to what is explained by Liu et al. (2016). Herein, we provide a detailed description of the components of the dense pufferfish index:
useq: The unipath sequence (useq) array consists of the (2-bit encoded) sequence of all unipaths of the compacted de Bruijn graph packed together into a single array. Typically, the size of this structure is close to (or smaller than) the size of the 2-bit encoded reference sequence, since redundant sequences are represented only once in this structure. We note that the unipath array contains the sequence of every valid k-mer, as well as that of potentially invalid k-mers (those which span unipath boundaries in the packed array, as the sequences in the array follow each other without any delimiters or gaps.). We denote by Ls the total length (in nucleotides) of the unipath array.
bv: The boundary vector (bv) is a bit-vector of length Ls. The bits of this vector are in one-to-one correspondence with the nucleotides of the unipath array, and the bv contains a one at each nucleotide corresponding to the end of a unipath in useq, and a zero everywhere else. We can retrieve the index of each unipath in useq using the rank operation on bv. returns the number of 1s in bv before the current index, i, or, in other words, the index of the current unipath. This can be used to get reference information for the current unipath from unipath table (utab), which is explained below. We note that bv is typically very sparse, and so can likely be compressed [using e.g. RRR (Raman et al., 2002) or Elias-Fano encoding], though we have not explored this yet.
h: The minimum perfect hash function () maps every valid k-mer in the unipath array (i.e. all k-mers not spanning unipath boundaries) to a unique number in , where N is the number of distinct valid k-mers in useq. We make use of the highly-scalable minimum perfect hash function (MPHF) construction algorithm of Limasset et al. (2017). We also note that we build the MPHF on the canonicalized version of each k-mer.
pos: The position (pos) vector stores, for each valid k-mer x, the position where this k-mer occurs in useq. Specifically, for k-mer x, let be the reverse complement of x and let be the canonical form of x (the lexicographically smaller of x and ). Then contains the starting position of x in useq such that .
utab: The utab stores, for each unipath appearing in useq, the reference sequences [including reference ID (ref), offset (p) and orientation (o) in Fig. 1] where this unipath appears in the reference. This is similar to a ‘posting list’ in traditional inverted indices, where all occurrences of the item (in this case, an entire compacted de Bruijn graph unipath) are listed. The order of the unipaths in utab is the same as their order in useq, allowing the information for a unipath to be accessed via a simple rank operation on bv.
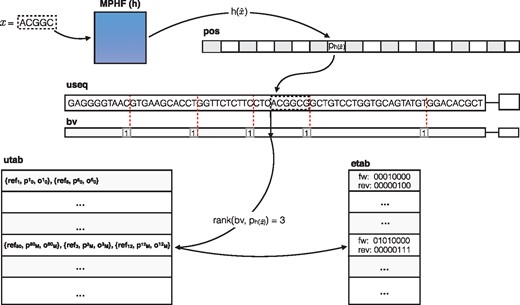
An illustration of searching for a particular k-mer, x, in the dense pufferfish index. The minimum perfect hash yields the index, in the pos vector where the k-mer appears in the unipath array. The k-mer is validated against the sequence recorded at this position in useq (and, in this case, it matches). A rank operation on is performed in the bv, which yields the corresponding unipath-level information in the utab. If desired, the relative position of the k-mer within the unipath can be retrieved with an extra select and rank operation. Likewise, the rank used to determine this unipath’s utab entry can also be used to look up the edges adjacent to this unipath in the etab table if desired
etab: The edge table (etab) stores, for each unipath appearing in useq, the nucleotides that encode the edges to the left and right of this unipath. The etab maintains a byte for each unipath, where each byte encodes which of the left and right extensions of this unipath produce a valid k-mer in the de Bruijn graph. Specifically, the first four bits of the byte are set to 1 if there is a left neighbor that can be reached by taking the leftmost -mer of the current unipath and pre-pending A,C,G and T, respectively, and these bits are 0 otherwise. The last 4 bits of the byte likewise encode the connectivity for the right end of the unipath. This etab is useful for speeding up navigation in the graph, because we find that the compacted de Bruijn graph is often sparse, so that querying for all potential neighbors of a unipath can be wasteful, since many unipaths have few neighbors.
eqtab: Optionally, an equivalence class table that records, for each unipath, the set of reference sequences where this unipath appears. Pre-computation and storage of these equivalence classes can speed up certain algorithms [e.g. pseudoalignment (Bray et al., 2016)].
These structures allow us to index every k-mer in the compacted de Bruijn graph efficiently, and to recall, on demand, all of the reference loci where a given k-mer occurs. We note here that the k-mers of the compacted de Bruijn graph constitute only a subset of the k-mers in useq. We refer to all k-mers in useq that do not span the boundary between two unipaths as valid k-mers; these are in one-to-one correspondence with the k-mers of the compacted de Bruijn graph.
Additionally, we note that navigation among the unipaths in the index could be accomplished without an explicit etab. Specifically, upon reaching the end of a unipath, one could query the index with all possible extensions to see which are supported by the indexed sequence, and potentially spurious overlaps (i.e. unipaths which overlap by k − 1 nucleotides but are not actually adjacent in any reference sequence) can be filtered out by traversing the relevant entries of utab. However, this process is not efficient, and is particularly wasteful if the average degree of each unipath is small since, in this case, most queries for neighbors would fail or return spurious overlaps which would then be filtered out. An empirical analysis of the compacted colored de Bruijn graph of the datasets we analyze suggested that these graphs do, in fact, tend to have a skewed degree distribution and that most unipaths exhibit a small degree (Supplementary Fig. S1). This motivates the utility of etab, especially given that it takes relatively small space.
3.2.1 k-mer query in the dense pufferfish index
By using a MPHF, , to index the valid k-mers, we avoid the typically large memory burden associated with standard hashing approaches. Instead, the identity of the hashed keys is encoded implicitly in useq. Given a k-mer x, we can check for its existence and location in the following way. We first compute , the index assigned to the canonicalized version of k-mer x by h. If , where N is the number of unique valid k-mers, then we immediately know that x is not a valid k-mer. Otherwise, we retrieve the position pi stored in . Finally, we check if the encoded string is identical to x (or ). If so, we have found the unipath location of this k-mer. Otherwise, x is not a valid k-mer. Herein, we use the notion to mean the substring of S from index i (inclusive) to index j (exclusive) with length .
Given pi, we can retrieve the reference positions by computing , which provides an index into utab that is associated with the appropriate unipath. This provides all of the reference sequences, offsets and orientations where this unipath appears. We compute the offset of k-mer x in the unipath as , where returns the start position of the unipath in utab. This allows us to easily project this k-mer ’s position onto each reference sequence where it appears. We note that querying a k-mer in the pufferfish index is an asymptotically constant-time operation, and that the reference loci for a k-mer x can be retrieved in time, where is the number of occurrences of x in the reference.
3.3 The sparse pufferfish index
The pufferfish index, as described above, is relatively memory-efficient. Yet, what is typically the biggest component, the pos vector, can still grow rather large. This is because it requires bits for each of the N valid k-mers in useq. However, at the cost of a slight increase in the practical (though not asymptotic) complexity of lookup, the size of this structure can be reduced considerably. To see how, we first make the following observation:
Observation 1. In the compacted de Bruijn graph (and hence, in useq), each valid k-mer occurs exactly once (k-mers occuring between unipath boundaries are not considered). Hence, any valid k-mer in the compacted de Bruijn graph is a complex k-mer (i.e. it has an in or out degree >1), a terminal k-mer (i.e. it appears at the beginning or end of some input reference sequence) or it has a unique predecessor and/or successor in the orientation defined by the unipath.
We can exploit this observation in pufferfish to allow sampling of the k-mer positions. That is, rather than storing the position of each k-mer in the unipath array, we store the position only for some subset of k-mers, where the rate of sampling is given by a user-defined parameter s. For those k-mers that are not sampled, we store, instead, three pieces of information; the extension that must be applied to move toward the closest k-mer at a sampled position (the QueryExt vector), whether or not the corresponding k-mer in useq is canonical (the isCanon vector), and whether the extension to reach the nearest sampled position should be applied by moving to the right or the left (the Direction vector). The QueryExt vector encodes the extensions in a 3-bit format so that variable-length extensions can be encoded, though every entry in this vector is reserved to take the same amount of space (3 times the maximum extension length, e). The isCanon vector is set to 1 whenever the corresponding k-mer appears in useq in the canonical orientation, and is set to 0 otherwise. The Direction vector is set to 1 whenever the corresponding, non-sampled, k-mer should be extended to the right, and it is set to 0 when the corresponding k-mer should be extended to the left. We additionally store an extra bit vector with the same size as useq (the isSamp vector) that is set to 1 for any k-mer whose position is sampled and 0 for all other k-mers.
This idea of sampling the positions for the k-mers is similar to the idea of sampling the suffix array positions that is employed in the FM-index (Ferragina and Manzini, 2001), and the idea of walking to the closest sampled position to verify a k-mer occurs is closely related to the shallow forest covering idea described by Belazzougui et al. (2016) for verifying membership of a k-mer in their fully-dynamic variant of the de Bruijn graph. This scheme allows us to trade off query time for index space, to allow the pufferfish index to better scale to large genomes or collections of genomes.
3.3.1 k-mer query in the sparse pufferfish index
k-mer query in the sparse pufferfish index is the same as that in the dense index, except for the first step—determining the position of the k-mer x in useq. When we query the MPHF with x to obtain , there are three possible results.
In the first case, if , this implies, just as in the dense case, that x is not a valid k-mer.
In the second case, if i < N and , this implies that we have explicitly stored the position for this k-mer. In this case we can retrieve that position as and proceed as in the dense case to validate x and retrieve its reference positions.
In the third case, if i < N and , this implies we do not know the position where x would occur in useq, and we must find the closest sampled position in order to decode the position of x (if it does, in fact, occur in useq). This is accomplished by Supplementary Algorithm S1.
Intuitively, Supplementary Algorithm S1 appends nucleotides stored in the QueryExt array to x to generate a new k-mer, , which either has a sampled position, or is closer to a sampled position than is x. The extension process is repeated with , etc. until either an invalid position is returned by , or a sampled position is reached. If an invalid position is returned at any point in the traversal, the original k-mer cannot have been a valid query. On the other hand, if a sampled position is reached, one still needs to verify that the k-mer implied by the query procedure is identical to the original k-mer query x (or ). To check this, one simply traverses back to the position in useq for the original k-mer x that is implied by the sampled position and sequence of extension operations. The rest of the search proceeds as for the dense case. The whole process of a (successful) k-mer query in sparse index is illustrated in Supplementary Figure S2 through an example.
By altering the stored extension size e and the maximum sampling rate s, one can limit the maximum number of extension steps (and hence the maximum number of hash lookups) that must be performed in order to retrieve the potential index of x in useq. A denser sampling and longer extensions require fewer possible extension steps, while a sparser sampling and shorter extensions require less space for each non-sampled position. If , one can guarantee that at most a single extension step needs to be performed for any k-mer query, which allows k-mer queries to remain practically very fast while still reducing the index size for large reference sequences.
Even though the sparse index maintains a number of extra bit vectors not required by the dense index, it is usually considerably smaller. Assume a case where the extension length is approximately half of the sampling factor (the minimum length that will guarantee each query requires at most a single extension step). Since we keep the extension required to get to the closest position in the left or right direction, we need to keep e bases for a k-mer, with each base represented using 3 bits (since we need to allow encoding extensions of length , for which the encoding must allow a delimiter). Hence, this requires 3e bits per k-mer for the QueryExt vector. The isCanon and Direction vectors each require a single bit per non-sampled k-mer, and the isSamp vector requires a single bit for all N of the valid k-mers. Assume, for simplicity of analysis, that the sampled k-mers are perfectly evenly-spaced (which is not possible in practice since e.g. we must require to sample at least one k-mer from each unipath), so that the number of sampled k-mers is simply given by . Further, since we are ignoring unipath boundary effects, assume that N = Ls. Since the space required by the rest of the index components (e.g. the MPHF, utab, etc.) is the same for the dense and sparse index, the sparse index will lead to a space savings whenever . Under this analysis, in a typical dataset, such as the human genome with bits, and choosing s = 9 and e = 4, so that we sample every ninth k-mer on average, and require at most one extension per query, we save, on average, bits per k-mer. Of course, the practical savings are less because of the boundary effects we ignored in the above analysis. In Supplementary Figure S3, the sizes of different components for sparse indices are demonstrated both for human transcriptome and human genome.
4 Indexing and lookup results
We explored the size of the index along with the memory and time requirements for index building and k-mer querying (a fundamental building block of many mapping and alignment algorithms) using pufferfish and two other tools, BWA [BWA-maximal exact match (ME)M (Li, 2013), specifically] and kallisto.
Though BWA is not a graph-based index, it was chosen as it implements the highly memory-efficient FMD-index (Li, 2013), which is representative of a memory-frugal approach. It is also worth noting that, although we only test querying for fixed-length k-mers here, BWA is capable of searching for arbitrary length patterns—an operation not supported by the kallisto or pufferfish indices. On the other hand, kallisto (Bray et al., 2016) adopts a graph-based index, and provides very fast k-mer queries. Both BWA and kallisto implement all phases of index construction (i.e. the input to these tools is simply the FASTA files to be sequenced). For pufferfish, however, we first need to build the compacted de Bruijn graph. We build the compacted de Bruijn graph and dump it in GFA format using TwoPaCo (Minkin et al., 2016). Then (as the output does not satisfy our definition of a compacted de Bruijn graph) we need to further prepare the GFA file for indexing. We call this process pufferization. It converts the GFA file to the format accepted by pufferfish (i.e. each k-mer should appear only once in either orientation among all the unipaths, and all unipaths connected in the compacted de Bruijn graph should have an overlap of exactly k − 1 bases). Finally, we build both dense and sparse pufferfish indexes and benchmark the time and memory for all steps of the pipeline individually. All experiments were performed on an Intel(R) Xeon(R) CPU (E5-2699 v4 @2.20 GHz with 44 cores and 56MB L3 cache) with 512GB RAM and a 4TB TOSHIBA MG03ACA4 ATA HDD running ubuntu 16.10, and were carried out using a single thread except for compacted de Bruijn graph building step using TwoPaCo. For all datasets, we consider k = 31, and the sparse pufferfish index was constructed with s = 9 and e = 4.
4.1 References and query datasets
We performed benchmarking on three different reference datasets, selected to demonstrate how the different indices scale as the underlying reference size and complexity increases. Specifically, we have chosen a common human transcriptome (GENCODE version 25, 201 MB, having 79 334 030 distinct k-mers), a recent build of the human genome (GRCh38, 2.9 GB, having 2 652 229 049 distinct k-mers), and an ensemble of >8000 bacterial genomes and contigs (18G, having 5 350 807 438 distinct k-mers) downloaded from RefSeq (ftp://ftp.ncbi.nlm.nih.gov/genomes/refseq/bacteria/). The human transcriptome represents a small reference sequence (which nonetheless exhibits considerable complexity due to e.g. alternative splicing), the human genome represents as a moderate (and very common) size reference, and the collection of bacterial genomes acts as a large reference set. For the k-mer query experiments, we search for all the k-mers from an experimental sequencing dataset associated with each reference. To query the human transcriptome, we use k-mers from SRA accession SRR1215997, with 10 683 470 reads, each of length 100 bases. To query the human genome, we use k-mers from SRA accession SRR5833294 with 34 129 891 reads, each of length 76 bases. Finally, to query the bacterial genomes, we use k-mers from SRA accession SRR5901135 (a sequencing run of E. coli) with 2 314 288 reads of variable length.
4.2 Construction time
The construction time for various methods depends, as expected, on the size and complexity of the references being indexed (Table 1). No tool exhibits faster index construction than all others across all datasets, and the difference in construction time between the fastest and slowest tools for any given dataset is less than a factor of three. All tools perform similarly for the human transcriptome. For indexing the human genome, BWA is the fastest, followed by pufferfish and then kallisto. For constructing the index on all bacterial genomes, kallisto finished most quickly, followed by BWA and then pufferfish. The time (and memory) bottleneck of index construction for pufferfish is generally TwoPaCo’s construction of the compacted de Bruijn graph. This is particularly true for the bacterial genomes dataset where TwoPaCo’s compacted de Bruijn graph construction accounts for of the total index construction time. This motivates considering potential improvements to the TwoPaCo algorithm for large collections of genomes (as well as considering other tools which may be able to efficiently construct the required compacted de Bruijn graph input for pufferfish).
Upper half of the table shows construction time and memory requirements for BWA, kallisto and pufferfish (dense and sparse) on three different datasets
| Tool | Memory (MB) | Time (h:m:s) | ||||
|---|---|---|---|---|---|---|
| Human transcriptome | Human genome | Bacterial genomes | Human transcriptome | Human genome | Bacterial genomes | |
| BWA | 292 | 4443 | 32 213 | 0:02:56 | 0:58:27 | 13:11:45 |
| Kallisto | 3552 | 150 657 | 315 387 | 0:03:05 | 3:27:42 | 9:07:35 |
| Pufferfish dense | 1466 | 27 438 | 75 342 | 0:04:13 | 2:09:25 | 13:10:00 |
| Pufferfish sparse | 1466 | 27 438 | 75 342 | 0:04:41 | 2:28:53 | 13:46:11 |
| TwoPaCo | 1466 | 9380 | 17 407 | 0:02:47 | 0:34:43 | 9:59:05 |
| Pufferize | 584 | 27 438 | 75 342 | 0:0:10 | 0:21:53 | 1:03:17 |
| Pufferfish dense index | 438 | 20 000 | 50 459 | 0:01:16 | 0:51:20 | 2:07:38 |
| Pufferfish sparse index | 331 | 17 745 | 50 457 | 0:01:44 | 1:10:48 | 2:43:49 |
In the lower half of the table, the construction statistics are provided for different phases of pufferfish pipeline. The time requirement for pufferfish is the sum of different subparts of the workflow, where the memory requirement is the max of the same. All of the tools in this table with the exception of TwoPaCo have single-threaded execution. We report here the timing results for running TwoPaCo with 16 threads. Timing results for TwoPaCo using a single thread are provided in Supplementary Table 4.
4.3 Construction memory usage
Unlike construction time, the memory required by the different tools for index construction follows a clear trend; BWA requires the least memory for index construction, followed by pufferfish, and kallisto requires the most memory. There are also larger differences in the construction memory requirements than the construction time requirements. For example, to construct an index on the human genome, kallisto requires times more memory than BWA (and times more memory than pufferfish). With respect to the current pipeline used by pufferfish, we see that TwoPaCo is the memory bottleneck for the human transcriptome and bacterial genomes datasets, while pufferize consumes the most memory for the human genome. For the bacterial genomes dataset in particular, TwoPaCo consumes over three times as much memory as the next most intensive step (pufferize) and times as much memory as actually indexing the input compacted de Bruijn graph. We note that TwoPaCo implements a multi-pass algorithm, which can help control the peak memory requirements in exchange for performing more passes (and therefore taking longer to finish). However, we did not thoroughly explore different parameters for TwoPaCo’s Bloom filter size (which indirectly affects the number of passes).
4.4 Query time and memory
To measure the query time required for k-mer lookup by the different methods, we performed experiments in which k-mer queries were issued from sequencing read sets related to each of the reference sequences (see the description of the query datasets above). Specifically, for each method and each dataset, we measure the time it takes to load the index into memory, stream through each valid k-mer in each read (i.e. k-mers not containing non-ATCG characters), and record the total number of occurrences of all queried k-mers in the corresponding reference index. By querying with experimental data, we mimic a realistic distribution of queries for both present and absent k-mers in the index. Since we only perform k-mer queries here (and not read mapping or alignment), we consider only the first end of paired-end read datasets. Comparing the times recorded in Table 2, we can see that pufferfish (both the dense and sparse variants) and kallisto generally tend to complete the query task faster than BWA, except in the bacterial genomes dataset, where BWA takes less time than kallisto (partly because of the time required by kallisto to load its large index on this dataset). Again, this can be attributed, at least in part, to the fact that both pufferfish and kallisto are k-mer -based indices, while BWA provides a full-text index. However, much of the speed of the hashing-based solutions may also be attributed to the efficiency of hashing as a lookup scheme and to the ability of the compacted de Bruijn graph to efficiently represent highly-repeated patterns. As expected, query in the sparse pufferfish index is slower than in the dense index, though the sparse index still remains practically fast in these benchmarks.
The time and memory required to load the index and query all k-mers in reads of the input FASTQ files for different datasets
| Tool | Memory (MB) | Time (h:m:s) | ||||
|---|---|---|---|---|---|---|
| Human transcriptome | Human genome | Bacterial genome | Human transcriptome | Human genome | Bacterial genome | |
| BWA | 308 | 4439 | 27 535 | 0:17:35 | 0:50:31 | 0:14:05 |
| Kallisto | 3336 | 110 464 | 232 353 | 0:02:01 | 0:19:11 | 0:22:25 |
| Pufferfish dense | 454 | 17 684 | 41 532 | 0:02:46 | 0:10:37 | 0:06:03 |
| Pufferfish sparse | 341 | 12 533 | 30 565 | 0:08:34 | 0:22:11 | 0:08:26 |
Disk space required for the index of each tool on different datasets
| Tool | Human transcriptome | Human genome | Bacterial genomes |
|---|---|---|---|
| BWA | 347M | 5.12G | 31G |
| Kallisto | 1.7G | 58G | 120G |
| Pufferfish dense | 397M | 16.7G | 39G |
| Pufferfish sparse | 278M | 11.4G | 27.2G |
| Tool | Human transcriptome | Human genome | Bacterial genomes |
|---|---|---|---|
| BWA | 347M | 5.12G | 31G |
| Kallisto | 1.7G | 58G | 120G |
| Pufferfish dense | 397M | 16.7G | 39G |
| Pufferfish sparse | 278M | 11.4G | 27.2G |
When examining the memory required for querying, we observe a pattern similar to that which we saw with construction memory. That is, BWA requires the least memory, followed by pufferfish, and kallisto requires the most memory. Herein, however, the gap between BWA and pufferfish is reduced, as the final pufferfish index typically consumes considerably less memory than is required during construction (especially for the bacterial genomes dataset). In fact, we see that the disk space and query memory requirements of pufferfish are very similar, as is the case with BWA. For kallisto, however, the hash table consumes much more memory than does the serialized index on disk. Obtaining these numbers required removing a redundant call to memset from the kallisto index loading code. Otherwise, on large sequences (e.g. the human genome and bacterial genomes), kallisto required a large amount of time to load the index into memory on our test systems. The difference in memory requirements is particularly striking for the large and diverse bacterial genomes dataset.
5 Applying the pufferfish index to taxonomic read assignment
In addition to benchmarking index construction and the primitive lookup operations, we also decided to apply the pufferfish index to a problem where we thought its characteristics might be useful. To this end, we implemented a prototype system for taxonomic read assignment based on pufferfish and a minor modification of the Kraken algorithm, described in the seminal work of Wood and Salzberg (2014).
Specifically, we consider a pufferfish index built over complete bacterial and archaeal genomes (this is Kraken’s bacteria database), and we implement a lightweight mapping algorithm where, for each read, we seek a consistent (i.e. co-linear) chain of unique maximal exact matches [uni-MEMs (Liu et al., 2016)]. To determine to which node in the taxonomy a read should be assigned, we adopt Kraken’s basic algorithm with the following modification. Instead of scoring each root-to-leaf path based on the number of k-mers shared between the read and the taxa along the path, we consider the union of all the intervals of the read that are covered by consistent chains of uni-MEMs (i.e. number of nucleotides covered in the mapping). For example, consider a read r that has uni-MEM matches with respect to the genomes of two species s1 and s2, where the corresponding intervals of the read covered by matches to s1 are and with respect to s2 are such that the covered intervals on each genome are consistent (i.e. co-linear and nearby in the reference). In this case, we define the coverage score of the read with respect to s1 to be , and likewise for . Further, let g be the parent genus of s1 and s2. We define . This process is repeated up to the root of the tree such that the score for any given node n is determined by the union of the covered intervals for the subtree rooted at n. Using this definition for the score, we then simply adopt Kraken’s algorithm of assigning the read to the node with the highest-scoring root-to-leaf path (or assigning the read to the lowest common ancestor (LCA) of all such nodes in the case of ties; see Supplementary Fig. S4).
The main potential benefit of this approach over the k-mer -based approach of Kraken is that this notion enforces positional consistency among the substrings of the read and leaf taxa that are used as evidence of a match. Additionally, this approach favors greater coverage of the read instead of simply a larger shared k-mer count—a notion that we believe is likely to be more indicative of a good alignment when these measures disagree.
We implemented our prototype tool for taxonomic read assignment and benchmarked it against both Kraken (Wood and Salzberg, 2014) and Clark (Ounit et al., 2015). We adopt a subset of the benchmarks, and simulated data (LC1-8, HC1 and HC2) considered by McIntyre et al. (2017). The metrics under which we evaluate the tools are the Spearman correlation, mean absolute relative difference, and the F1 score. However, rather than considering these metrics at any specific taxonomic rank, which leads to the problem of how to evaluate false positives that are assigned at a different rank, we consider these metrics aggregated over the entire taxonomy. In this full-taxonomy evaluation, we consider the maximally specific predictions made by each method. Then, we recursively aggregate the counts up the taxonomy to higher ranks (such that a parent node receives the sum of the assigned reads of its children, plus any reads that were assigned directly to this node). The same aggregation was performed on the true counts (see Supplementary Fig. S5).
This metric provides a single statistical evaluation, over the entire taxonomic tree, that prefers reads mapped (i) along the correct root-to-leaf path and (ii) closer along this path to the true node of origin compared to assignments that are either on the wrong path entirely, or further from the true node of origin. In addition to this comprehensive measure, we provide further collection of different accuracy metrics on this data (broken down by specific taxonomic ranks) in Supplementary Section S8.
We evaluate the output of these tools in both their unfiltered modes (which assign any read with a single k-mer/uni-MEM match between the query and reference) and using their default filtering criteria (where some score or confidence threshold must be attained before a read can be assigned to a taxon; explained further in Supplementary Section S7). The results depicted in Figure 2 show that pufferfish provides the best estimates under all metrics, followed by Clark in unfiltered mode and by Kraken in filtered mode. We also consider the time and memory required by these tools to perform taxonomic read assignment on a real experimental dataset consisting of reads (Supplementary Table S3).
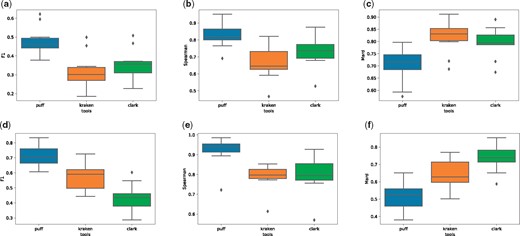
Full taxonomy classification evaluation for three tools of Kraken, Clark and Pufferfish. (a–c) We compare the F-1, spearman correlation and mean absolute relative difference metrics for the results of the three tools over the 10 simulated read datasets of LC1-8 and HC1, 2 without using any filtering options. In the plots in the second row, we evaluate accuracy of reports after running each tool with their default filtering option (which filters out any mapping with <20% k-mer coverage for Kraken, 44 nucleotide coverage for Pufferfish and without a ‘high-confidence’ for Clark.)
6 Conclusion and future work
In this paper, we proposed a new efficient data structure for indexing compacted colored de Bruijn graphs, and implement this data structure in a tool called pufferfish. We showed how pufferfish can achieve a balance between time and space resources. By building upon a MPHF (Limasset et al., 2017), we provide practically fast k-mer lookup, and by carefully organizing our data structure and making use of succinct representations where applicable, we greatly reduce the space compared to traditional hashing-based implementations. The main components of the data structures are a MPHF built on k-mers, the concatenated unipath array from which the k-mers are sampled, a bit vector that marks the boundary of unitigs in the concatenated array, a vector containing the offset position for the k-mers, and a utab enumerating the occurrences of each unipath in the reference sequences.
Moreover, we presented two variants of the pufferfish data structure; namely, a dense and a sparse variant. The first is optimized for fast queries and the second provides the user with the ability to trade off space for speed in a fine-grained manner. In the sparse index, we only keep offset positions for a subset of k-mers. To query a k-mer whose position is not sampled, the sparse representation is aided with a few auxiliary data structures of much smaller size. Since the largest component of the index is the pos vector, adopting this sparse representation significantly reduces the required memory and disk space. Our analyses suggest that pufferfish (dense) achieves similar speed to existing hash-based approaches, while greatly reducing the memory and disk space required for indexing, and that pufferfish (sparse) reduces the required space even further, while still providing fast query capabilities. We consider indexing and querying on both small (human transcriptome) and large (>8000 bacterial genomes) reference datasets. Pufferfish strikes a desirable balance between speed and space usage, and allows for fast search on large reference sequences, using moderate memory resources.
Finally, we demonstrate the application of pufferfish to the problem of taxonomic read assignment. We show that, using essentially the same algorithm as Kraken, pufferfish can enable faster and more accurate taxonomic read assignment while using less memory. The accuracy benefit mostly results from replacing the k-mer -centric scoring of reads to taxa with a score based on the coverage of reads by taxa under consistent chains of uni-MEMs. This scoring scheme enforces positional consistency, and is enabled by the pufferfish index. It more closely approximates a natural intuition of what it means for a read to match a taxon well, but can still be computed very efficiently.
Having built an index for a reference genome, transcriptome, or metagenome using pufferfish, the immediate future work consists of implementing more relevant applications based on this index. Many of these applications fall into the categories of problems that need mapping or alignment as their initial step. In our prototype taxonomic read assignment system, we have already implemented a basic mapping procedure, and this could easily be extended into a selective-alignment-style algorithm (Sarkar et al., 2017) to provide true edit distances or edit scripts. An aligner based around the pufferfish index could be used to quickly align against collections of transcripts and genomes, and this could be useful in downstream tasks, such as contaminant detection, metagenomic abundance estimation (related to but distinct from taxonomic read assignment), etc. Finally, we believe that having a single graph against which we can align reads that is capable of representing many sequences simultaneously will admit an efficient approach for the joint alignment of RNA-seq reads to both the genome and the transcriptome. We can construct a de Bruijn graph that contains both the reference genome as well as the annotated transcript sequences. Reads which are then well-explained by annotated transcripts can be aligned efficiently and accurately, while the genomic sequence can simultaneously be searched for evidence of new splice junctions; potentially improving both the efficiency and accuracy of existing RNA-seq alignment methods. We expect the memory efficiency of pufferfish will be beneficial in working with larger collections of genomic, transcriptomic and metagenomic datasets.
Funding
We gratefully acknowledge support from NSF grant BBSRC-NSF/BIO-1564917.
Conflict of Interest: none declared.
References
Author notes
The authors wish it to be known that, in their opinion, Fatemeh Almodaresi and Hirak Sarkar authors should be regarded as Joint First Authors.

