


Abstract
The rapid drop in sequencing costs has produced many more (predicted) protein sequences than can feasibly be functionally annotated with wet-lab experiments. Thus, many computational methods have been developed for this purpose. Most of these methods employ homology-based inference, approximated via sequence alignments, to transfer functional annotations between proteins. The increase in the number of available sequences, however, has drastically increased the search space, thus significantly slowing down alignment methods.
Here we describe homology-derived functional similarity of proteins (HFSP), a novel computational method that uses results of a high-speed alignment algorithm, MMseqs2, to infer functional similarity of proteins on the basis of their alignment length and sequence identity. We show that our method is accurate (85% precision) and fast (more than 40-fold speed increase over state-of-the-art). HFSP can help correct at least a 16% error in legacy curations, even for a resource of as high quality as Swiss-Prot. These findings suggest HFSP as an ideal resource for large-scale functional annotation efforts.
Supplementary data are available at Bioinformatics online.
1 Introduction
The recent rapid drop in the cost of DNA-sequencing has produced a large number of fully sequenced genomes. For prokaryotes, for example, this represents a more than 6-fold growth (1400–9000 in GenBank (Benson et al., 2013)) in the last 5 years alone. While this increase in data enables many types of research, experimental annotation lags far behind. In particular, the speed (or lack thereof) of experimental evaluation and validation of protein molecular functionality clearly necessitates computational approaches. In fact, many methods (Jiang et al., 2016; Radivojac et al., 2013) have already been developed for this purpose, the vast majority of which rely on transfer of functional annotation by homology (Loewenstein et al., 2009). Mistakes in available annotations (Schnoes et al., 2009), inconsistencies in experiments as well as simply missing or yet unknown functions make these sequence similarity-based methods error-prone (Clark and Radivojac, 2011). Furthermore, organism-focused research interests result in more detailed annotations for a non-random subset of proteins, where homologous proteins of identical functionality in another species are often annotated significantly less thoroughly. Evaluating the performance of computational annotation methods is complicated by the absence of large, well curated and ‘evenly’ functionally annotated protein sets, representing the entire breadth of available biomolecular functionality.
Protein sets that are used as benchmarks of prediction employ annotation ontologies, i.e. standardized terms and their relationships. One such benchmark set is enzymes with Enzyme Commission (Bairoch, 2000) (EC) numbers. EC numbers reflect a four level hierarchy, where each consecutive level is a more precise specification of the annotation on the previous level. For example, enzymes classified as EC: 1.1.1.- are oxidoreductases (first level), acting on the CH-OH group of electron donors (second level), with NAD+ or NADP+ as an electron acceptor (third level). The fourth and most specific level might then annotate an enzyme as alcohol dehydrogenase (EC: 1.1.1.1), i.e. reducing the aldehyde group of the molecule. Note that dashes (‘-’) in EC numbers indicate lack of specificity of functional annotation at that level. While EC numbers facilitate comparison of functions across enzymes, the annotation specificity at the same EC level varies; e.g. the class of serine/threonine protein kinases (EC: 2.7.11.-) contains a category EC: 2.7.11.1 (fourth level annotation = 1) that collects all kinases that are non-specific or whose specificity has not been analyzed to date. On the other hand, serine/threonine protein kinases with the fourth level annotations between 2 and 32 are very specifically annotated, with each category limited to proteins that act on a particular substrate. Using EC annotations as a benchmark, thus, comes at the expense of variability in annotations even at the same level of the hierarchy. This, in turn, complicates establishing functional similarity of two proteins in a precise and balanced manner across the entire enzymatic activity spectrum.
By definition, using EC annotations also means missing out on non-enzymatic functionality. Other ontologies, like the molecular function branch of Gene ontology (Ashburner et al., 2000) (GO) do not have this limitation. GO, however, employs a different, even more detailed, strategy in defining function than EC. The number of GO annotation levels varies by ontology sub-branch. Moreover, one protein can (and likely does) have multiple functional GO terms assigned to it (e.g. both copper ion binding and DNA binding terms describe the function of P53; AmiGo 2.4.6; PMID: 15358771, PMID: 7824276). Thus, comparing GO annotations may lead to much stronger distortions of similarity than skewed or even incomplete EC numbers. Note that moonlighting (Khan et al., 2014) proteins, i.e. proteins that can be assigned multiple specific functions, further confuse functional similarity metrics.
As a consequence of the drastic increase in genomic and protein sequences in need of annotation, the search space for all computational function assignment methods has also increased. A centerpiece of much of sequence analysis efforts is the Basic Local Alignment Search Tool (BLAST) (Altschul et al., 1990; Altschul et al., 1997) family. We note that with the quasi exponential growth in search space, while PSI-BLAST (Altschul et al., 1997) may still remain viable for the analysis of a single protein, large scale evaluations are not time-feasible. Many methods that reduce runtime while retaining or increasing alignment accuracy have been developed over the last years, including caBLASTp (Daniels et al., 2013), HHblits (Remmert et al., 2012) and MMseqs2 (Steinegger and Soding, 2017). However, replacing (PSI-) BLAST in any bioinformatics pipeline with another alignment method requires parameter re-optimization or even a complete method overhaul.
Existing function prediction methods are very sophisticated, using a variety of inputs (e.g. structure and literature mining) and computational techniques (e.g. machine learning). However, here we focused on Homology-derived Secondary Structure of Proteins (HSSP) (Rost, 1999; Rost, 2002; Sander and Schneider, 1991)—a simple distance metric that infers protein function and structure similarity from sequence identity and alignment length. We optimized HSSP parameters to classify protein pairs as functionally identical or different using the results of MMseqs2, a lightning-fast alignment method. We found that our newly developed Homology-derived Functional Similarity of Proteins (HFSP) method is 40-fold faster than HSSP, while retaining HSSP precision in annotating enzymatic functionality of proteins (85% precision; Fig. 1).
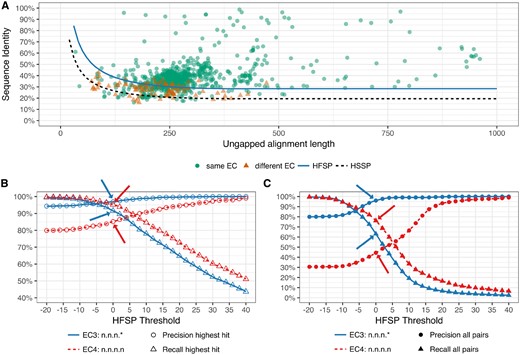
HFSP precisely predicts functional identity. All Swiss-Prot 2002 protein pairwise alignments were mapped into the sequence identity versus ungapped alignment length space. In (A) protein pairs were differentiated according to identity of their EC level 3 (same EC annotation are green circles; different annotations are red triangles). The HFSP curve (HFSP = 0, light blue solid line) is shown relative to the HSSP curve (black dashed line). Protein pairs above the curve are predicted to be of same function, pairs below the curve of different function. In (B, C) precision (circles) and recall (triangles) in predicting functional identity, at third (blue, solid curve) and fourth (red, dashed curve) EC level for Swiss-Prot 2002. Arrows indicate performance at default cutoff of HFSP = 0. In (B) prediction was done using the highest HFSP scoring alignment per protein. In (C) all alignments were used, resulting in significantly worse performance
Analyzing existing protein databases with our method, we showed that currently available computationally determined annotations in even the manually curated Swiss-Prot (The UniProt, 2017) database are incorrect for at least a sixth of the cases. We suggest that these errors are likely due to loosely defined rules of homology-based propagation of functional annotations. With the number of protein sequences in public databases bordering on 100 million and growing, HFSP is well suited to help improve the quality of existing and newly assigned functional annotations.
2 Materials and methods
2.1 Extraction of datasets
We extracted a set of reviewed proteins from Swiss-Prot with only one, EC (Bairoch, 2000) annotation per protein (complete at all four levels; 214 000 proteins; Swiss-Prot set). The 2002 (latest) formula for computing the HSSP (Rost, 1999; Rost, 2002) distances was developed on a combined set of Swiss-Prot (The UniProt, 2017) and Protein Data Bank (Berman et al., 2002) proteins. To validate the performance of HSSP reported in Rost (1999) and Rost (2002), we extracted proteins from the Swiss-Prot set that had experimental evidence of protein existence (e.g. crystal structure, protein detection by antibodies, etc.) and an EC annotation in BRENDA (Placzek et al., 2017). The resulting proteins (Swiss-Prot 2017 set; 7022 proteins) were further filtered to retain entries appearing in the database before January 2002 (Swiss-Prot 2002, 3, 908 proteins). Both Swiss-Prot 2017 and 2002 datasets were extracted in October 2017 (Uniprot release 2017_09) and redundancy reduced to 98% sequence similarity and 98% target sequence coverage with CD-HIT (Fu et al., 2012; Li and Godzik, 2006). Swiss-Prot 2002 contained 3801 proteins with 1481 unique EC annotations and Swiss-Prot 2017 containing 6835 proteins with 2552 unique EC annotations (Supplementary Material).
Swiss-Prot 2017 was further split into sets containing only prokaryotic (Swiss-Protpro 2017, 2572 proteins) or eukaryotic (Swiss-Proteuk 2017, 4263 proteins) proteins. Finally, we extracted two more Swiss-Prot subsets from: (i) proteins that did not have an EC annotation (293 058 proteins) and (ii) proteins with incomplete or multiple EC annotations (48 536 proteins).
2.2 Aligning proteins
To augment the homology profiles used in alignments [by both PSI-BLAST (Altschul et al., 1997) and MMseqs2], we computed alignments of all proteins in our datasets (Swiss-Prot 2002, Swiss-Prot 2017, Swiss-Protpro 2017 and Swiss-Proteuk 2017) against proteins in the full (non-reduced) Swiss-Prot (Uniprot release 2017_09). For each specific dataset, we then extracted only those alignments, where both proteins were present in that set (e.g. both query and target protein in Swiss-Prot 2002).
PSI-BLAST alignments where created with NCBI-BLAST version 2.2.29+. We ran three iterations of PSI-BLAST (-num_iterations 3). In each iteration, the top 500 hits (E-value 10−10, -inclusion_ethresh 1e-10) were included into the profile. After the third round all alignments that satisfied the E-value ≤10−3 threshold (-evalue 1e-3) were considered for evaluation of performance.
MMseqs2 (Steinegger and Soding, 2017) parameters were chosen to mirror the PSI-BLAST runs. The alignment-mode (––alignment-mode 3) was set to calculate sequence identity between query and target over the full alignment length, i.e. analogous to BLAST. We ran three iterations (––num-iterations 3) of alignments including hits with an E-value ≤10−10 into the generated profile (––e-profile 1e-10). Only alignments of protein pairs with and E-value ≤10−3 were reported in the final result (-e 1e-3). The sensitivity (-s) cutoff for MMseqs2 prefiltering step was set to 5.6 (default value).
It had taken MMseqs2 1228 CPU hours to complete the alignment of our Swiss-Prot enzyme set (214 000 proteins) to the full (non-reduced) Swiss-Prot (555 594 proteins). Although MMSeqs2 was exceedingly fast for this set, note that it has been optimized to deal with much larger databases and, thus, it did not reach its full potential in speed. In earlier testing (Zhu et al., 2015; Zhu et al., 2018) with a dataset of ∼4.2 million proteins, the all-to-all protein alignment time for the MMseqs2 was ∼30 000 CPU hours (4.2e6 × 4.2e6 = ∼1.8e13 comparisons in roughly 4 days on 12 compute nodes with 24 CPUs each). In comparison, creating the same PSI-BLAST alignments took ∼1.3 million CPU hours (∼3 months on 78 compute nodes with 8 CPUs each). From these numbers, the HFSP speed-up (using MMseqs2) over HSSP (using PSI-BLAST) was estimated at over 40-fold and expected to grow significantly with database size.
2.3 Defining functional identity
Proteins sharing the same EC annotation at chosen (third or fourth level) were assigned functional identity. For example, L-lactate dehydrogenase and D-lactate dehydrogenase have EC assignments 1.1.1.27 and 1.1.1.28, respectively. Thus, at EC level 4, the proteins are different, but at EC level 3 they are the same, 1.1.1.
2.4 Retraining HSSP curve with MMseqs2
We used the Swiss-Prot 2002 proteins and their third EC level annotations to develop the HFSP measure. Investigating the protein distribution of EC categories at the third EC level, we realized a strong distortion toward a few EC categories with exceptionally many associated proteins (Fig. 2C). This is in addition to other differences between EC categories (Fig. 2A and B). To compensate for this category bias, we limited the size of EC categories to no more than 50 proteins (randomly chosen for the 19 larger categories, Supplementary Table S1). We then extracted all MMseqs2 alignments for all Swiss-Prot 2002 protein pairs in our set.
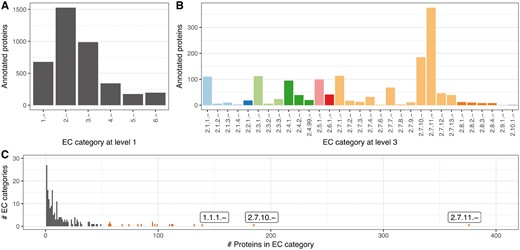
Strong bias in EC distribution. Different EC categories contain different numbers of proteins with both general (A) EC level 1 and (B) more specific EC annotations. (C) This bias is particularly obvious for third level EC categories, with 2.7.11.-, 2.7.10.- and 1.1.1.- being the most prominent (first three bars from right; all ECs with more than 50 proteins are red)
It has been previously shown that using class-balanced training sets is beneficial in the development of data driven classification models (Rost and Sander, 1993; Wei and Dunbrack, 2013). We therefore balanced the results in training to contain equal numbers of protein pairs with the same versus different third level EC annotations.
HFSP values for protein pairs were calculated using MMseqs2 results; Pearson correlation coefficient of HFSP to the HSSP values computed using PSI-BLAST results for same pairs. For each dataset, we calculated precision (i.e. how often a prediction of identical function is correct), recall (i.e. how many identical function pairs were correctly identified) and the F1 score [Equations (2) and (3)] using HSSP and HFSP distance thresholds to determine true/false positives/negatives.
After evaluation was completed, we retrained as described above, but without testing, one HFSP curve on the complete balanced set of Swiss-Prot 2002 protein pairs for all further use.
2.5 Using HFSP to make function predictions
We used the 6835 experimentally annotated proteins with 2552 unique EC annotations of Swiss-Prot 2017 as the reference database for all further function predictions. For every protein, only the highest HFSP-scoring protein match (≥0; excluding self-matches) was used to annotate function. We thus predicted functions of proteins in the complete Swiss-Prot set of enzymes. Curiously, some EC numbers used in Swiss-Prot protein annotation did not have any members in the experimentally annotated Swiss-Prot 2017 reference set. The proteins annotated with these EC numbers (32 201 proteins at fourth and 381 proteins at third EC level, respectively) were considered false positives by default. Note that we are still unclear about the origins and experimental support of these annotations. Additionally, some proteins did not produce any alignments, and for others the highest hits did not reach our HFSP cutoff = 0. For these, no functional assignment could be made.
3 Results
3.1 HFSP scores correlate with HSSP, but are produced more than 40-fold faster
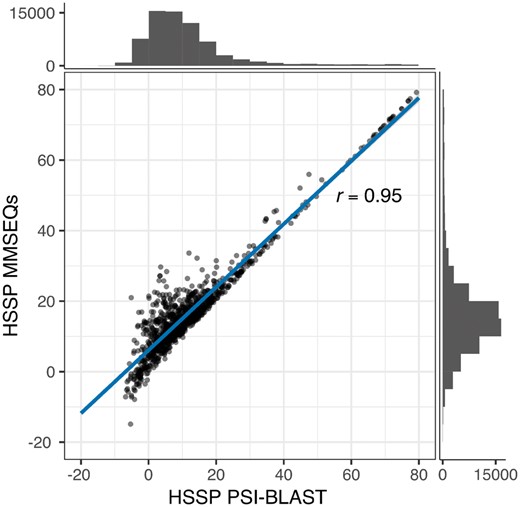
HSSP scores derived from MMSeqs2 and PSI-BLAST alignments strongly correlate. HSSP scores derived from PSI-BLAST alignments (x-axis) and MMSeqs2 (y-axis), respectively. The histograms display the number of protein pairs in the respective ranges of HSSP scores. HSSP scores for both methods highly correlate (Pearson correlation coefficient=0.95)
3.2 HFSP precisely identifies the third, but not fourth, level of EC annotations
In identifying pairs of proteins sharing the same function at the fourth level of EC (Materials and Methods), HFSP attained precision of 44.1% ± 3.6 at HFSP 0 and recall of 71.5% ± 1.6 (in cross-validation). This disappointing performance suggests that the increasing resolution/fine-tuning of experimental molecular function annotation is prohibitive for large-scale computational analyses of proteins; i.e. for any given alignment scoring HFSP ≥ 0, it is more likely that the proteins in the alignment are not functionally identical.
In exploring this problem, we found that many highly sequence similar protein pairs of different EC annotations contained homologous proteins that were assigned slightly different functionality in different organisms. For example, proteins from the squalene cyclase family (Interpro: IPR018333, Pfam: PF13243 and PF13249) were annotated with different ECs; e.g. GERS_RHISY, a germanicol synthase in the red mangrove, is assigned EC: 5.4.99.34 and has 93% sequence identity (alignment length = 758) to BAS_BRUGY, a Beta-amyrin synthase of the Burma mangrove, which is annotated as EC: 5.4.99.39. This combination of sequence identity and alignment length produces an HFSP score of 64.6. At this HFSP level protein pairs are predicted to share the same EC annotation at fourth EC level with a precision of >99%. Note that GERS_RHISY is the only EC 5.4.99.34 protein to date. The publication describing its catalytic activity (Basyuni et al., 2007), suggests that GERS_RHISY activity warrants a brand new EC number (germanicol synthase), because it primarily catalyzes germanicol synthesis. From our perspective, GERS_RHISY should additionally carry the beta-amyrin synthase annotation, since beta-amyrin (and lupeol) are synthesized in addition to germanicol albeit at a lower rate. Note that this example also recalls the problem of moonlighting proteins.
The above example reflects the general problem of unbalanced annotation detail of different EC categories at the same level of annotation. For example, EC: 5.4.99.- is by choice of the EC meant to temporarily ‘house’ a collection of enzyme reactions that have yet to be more thoroughly categorized. Many members of EC: 5.4.99.- fall into the same PFAM families, while catalyzing the conversion of the same reactant into similar chemical compounds; i.e. the fourth level EC annotations of these proteins convey only a small amount of functional difference. However, 5.4.99.- also contains significantly different proteins catalyzing different reactions, where fourth level annotations convey very large differences. Note that in this scheme, automated protein function annotation is significantly limited by lack of awareness of what individual EC numbers represent; i.e. it is incorrect to assume that the fourth, most precise, level EC annotations, across the entire EC system, are similarly defined in terms of depth of functional understanding and/or functional distances between proteins of the same third level EC. Note, however, that increasing the HFSP threshold for calling protein functions identical leads to significantly improved precision (if at significant cost to recall). For example, at HFSP cutoff = 20, 93% of the protein pairs are correctly annotated to share functionality. In other words, protein pairs with higher HFSP score represent more reliable predictions. This improvement is unsurprising as it is due in large part to increasing sequence identity and is very likely reflective of closer evolutionary relationships between proteins.
In identifying pairs of proteins sharing the same function at the third level of EC, we found that performance improved drastically at the default HFSP cutoff = 0. Here, our method attained precision of 96% ± 1.2 at HFSP 0 and recall of 64% ± 1.6 (in cross-validation, Fig. 1). These results suggest that in the absence of additional knowledge about an aligned protein pair, it is prudent to only accept higher scoring HFSP alignments (for fourth digit annotations) or to move up in the required resolution of functional annotation (i.e. to third EC level).
Finally, we tested HFSP precision and recall on proteins in Swiss-Prot 2017 that were NOT in Swiss-Prot 2002 (which was used for training of the HFSP curve), i.e. proteins that were added to Swiss-Prot after January 2002. We found that performance for this subset was similar to the expected performance at both the third and fourth EC levels (Fig. 4), suggesting that our measure remains applicable for newly added proteins AND enzyme classes (EC numbers).
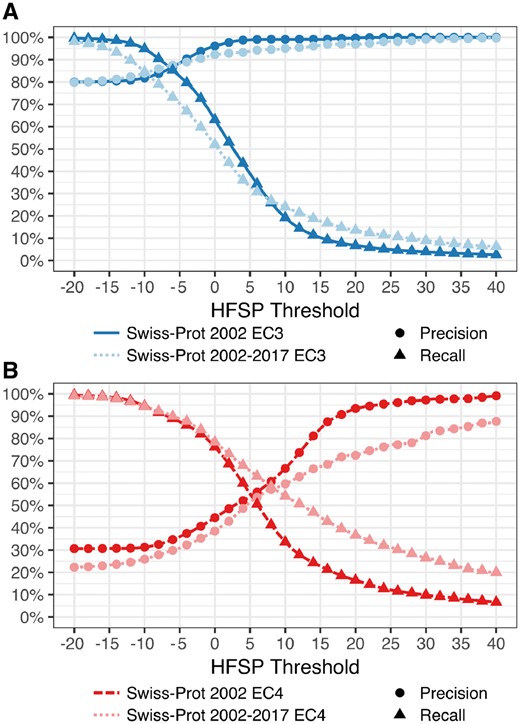
HFSP performs as expected on newly added proteins. Precision and recall of function prediction at (A) third (dark blue) EC level of proteins in Swiss-Prot 2002 and of those added since 2002 (Swiss-Prot 2002–2017; light blue) are similar. However, for the fourth EC level, the (B) performance on newly added proteins (dark red) is worse than for older ones (light red)
3.3 HFSP performance differs in annotating prokaryotic versus eukaryotic proteins
We additionally evaluated the HFSP performance in annotating the eukaryotic versus prokaryotic proteins of the entire Swiss-Prot 2017 set (Methods, Fig. 5A) at the third EC level. At our default cutoff of HFSP = 0, eukaryotic protein pairs were assigned functional similarity correctly more often than prokaryotic ones (precision/recall 96 ± 1.5/62% versus 91 ± 1.5/47%, respectively). Note that there were more eukaryotic proteins in our data than prokaryotic ones, which may have contributed to this disparity during HFSP curve optimization. This larger number of proteins can be explained by the eukaryotes (i) trending toward bigger proteomes and, perhaps more importantly, (ii) making up a bigger fraction of model organisms, which are better studied. Curiously, at the fourth EC level this trend was reversed, i.e. precision was better for prokaryotes than for eukaryotes (precision/recall 62/55% versus 42/79%, respectively, Fig. 5B). This observation may potentially be due to a smaller number of homology-confusing multi-domain proteins in prokaryotes. It may also reflect a lower enzymatic diversity of prokaryotic proteins in our set: 1522 distinct EC annotations in eukaryotes versus 1403 in prokaryotes. Whether this difference is due to actual diversity or a result of experimental bias remains unclear.
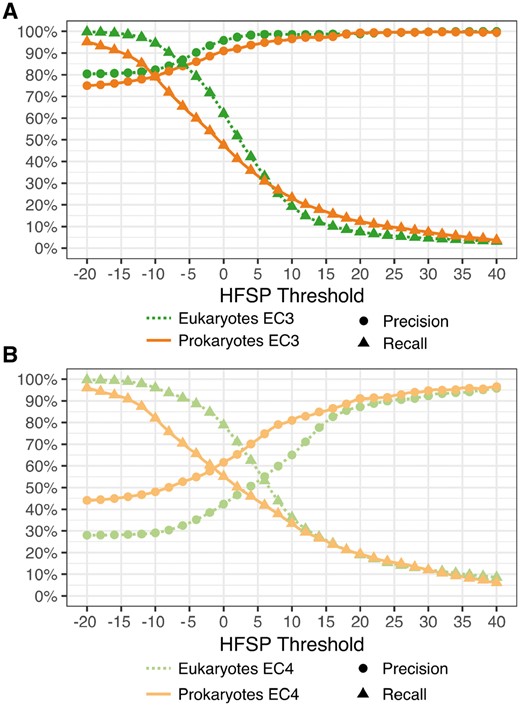
Differing annotation performance for prokaryotic and eukaryotic proteins at third and fourth EC level. (A) For the third EC level at default cutoff of HFSP=0, eukaryotic protein pairs are assigned functional similarity correctly more often than prokaryotic ones. However, for high thresholds, i.e. higher precision at the expense of recovered protein pairs, performance is similar. (B) Performance is better for prokaryotes than eukaryotes at the fourth EC level
3.4 HFSP accurately predicts unknown protein function at all EC levels
There is a conceptual difference between annotating functionality of an unknown protein and measuring functional similarity of two proteins. That is, in assigning ONE specific protein function to a newly obtained amino acid sequence is not the same as relying on homology to identify proteins sharing the similar functionality in a particular database. To use HFSP as a method of function prediction we proposed simply relying on the ‘highest hit’; we have previously shown that this approach is best for transferring functional annotations with HSSP (Zhu et al., 2018) and suggest that similar logic should apply here.
By mapping the highest HFSP match (at cutoff = 0 and excluding self-hits) for the experimentally annotated proteins of the Swiss-Prot 2017 set, we were able to correctly identify the fourth level EC function of 4668 (∼83% of 5647) proteins. As expected, the numbers were higher for the third level EC (5425 of 5647 proteins, 96%). Note that this performance is the upper limit of actual HFSP performance, as Swiss-Prot 2002, on which our method was developed, is a subset of Swiss-Prot 2017. Also note that (i) 625 proteins in our Swiss-Prot 2017 set did not reach our HFSP cutoff =0 and (ii) 563 proteins did not align to any others in our set. Of these, 645 proteins (291 and 354, respectively) proteins were unique in our set; i.e. there was no other protein with the same EC number at fourth EC level. Thus, 1188 proteins in our set (∼17% of 6835 in the set) could not be assigned function at all—∼8% due to HFSP limitations and ∼9% due to the absence of homologs.
3.5 Functional annotations even in manually curated databases are often incorrect
We applied the highest HFSP hit measure to evaluate EC annotations in the entire Swiss-Prot set (Materials and Methods) on the basis of their alignment to our experimentally annotated Swiss-prot 2017 set. We estimate that 142 831 of the 214 000 Swiss-Prot enzymes (67%) are correctly annotated at the fourth level of EC (Fig. 6). Curiously, 32 201 (15%) of the enzymes in Swiss-Prot had no corresponding fourth level ECs (381 third level ECs) in Swiss-Prot 2017, raising questions as to the accuracy of these annotations. Another 4937 are deemed wrongly annotated (highest hit at HFSP ≥ 0 has a different EC number). While these proteins may indeed be assigned wrong functionality, this may also be due to error in HFSP assignments at this level (17% false positives at this cutoff, as described above for the Swiss-Prot 2017 experimentally-annotated set). A more interesting finding, however, is that 34 031 (19%) of the proteins in this set could not be annotated at all by HFSP, whether due to lack of alignments (17 519 proteins) or HFSP highest hits unable to reach the cutoff (16 512 proteins). These 19% of proteins that could not be annotated represent a more than 2-fold higher number than expected (∼8% as described above for the Swiss-Prot 2017 set). We, thus, suggest that the Swiss-Prot EC annotations of many of these 34 031 proteins, a sixth of the total number of annotations, are incorrect.
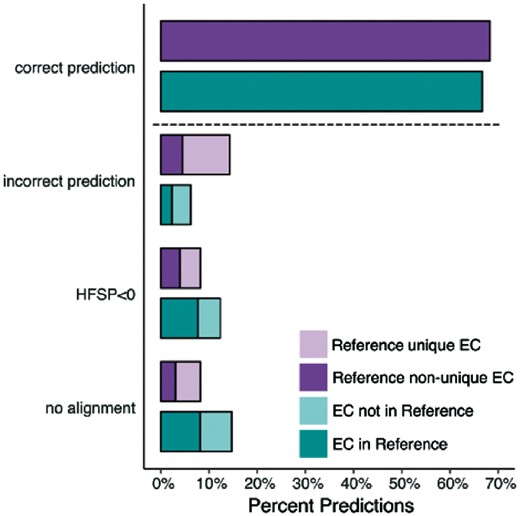
More proteins in Swiss-Prot enzyme could not be assigned to function than expected. Function predictions for proteins in Swiss-Prot 2017 with unique (light purple) and non-unique (dark purple) fourth level EC annotation and all proteins in Swiss-Prot with EC annotation complete on all four levels that either share an EC with proteins in Reference (light teal) or not (dark teal)
3.6 Identifying proteins of new functionality is simplified with HFSP
One problem of function transfer by homology methods is their inability to identify proteins of completely novel, i.e. not found in the reference database, functionality. Note that sequence similar proteins are also likely functionally similar, but are clearly not necessarily functionally identical. To evaluate how HFSP deals with proteins of novel functionality, we extracted a set of proteins from Swiss-Prot 2017, where no other protein in our set had the same fourth EC level annotation (‘unknown’ functionality). These ‘unknown’ proteins, i.e. assigned to a fourth EC level category, which appear just once in our set, are a minority (19%; 1317 of 6835 proteins), albeit a significant one. We asked if we could in advance identify these ‘unknown’ proteins, for which prediction of function could not be made, rather than making incorrect predictions.
We separated function predictions for the 6835 proteins in Swiss-Prot 2017 into three subsets (i) ‘unknown’, as described above, and (ii) correctly and (iii) incorrectly predicted ‘known’, i.e. proteins with fourth EC level annotations containing more than one protein. We then compared the highest hit HFSP score distributions for all three sets (Fig. 7). HFSP scores for correctly annotated proteins with known functionality appear to come from a mixture of two distributions. These are likely to be evolutionarily distant (peak of the distribution at HFSP = ∼20) versus close (peak at HFSP = ∼65) homologs. The peak of the distribution of ‘unknown’ protein scores is obviously different from either (HFSP = ∼2). However, the distribution of incorrect predictions for ‘known’ proteins closely follows the ‘unknowns’ (Fig. 7A and Supplementary Fig. S2A and B). Combined, ‘known incorrect’ and ‘unknown’, make up less than 10% of all predictions at HFSP ≥ 14 (false discover rate, FDR = 9.6%), whereas between the default cutoff and HFSP = 14 (0 ≤ HFSP < 14) this fraction is nearly 40%. Despite the fact, that at this threshold only ∼6% of all predictions are of ‘unknown’ origin, these are still 30% of all ‘unknown’ proteins; similarly ∼3% of all predictions, but 29% of all ‘known incorrect’ proteins are at HFSP ≥ 14. These observations suggest that while we cannot differentiate incorrect predictions from missing-reference ones, HFSP handles new protein function, as well as that which it has already seen, with higher scores indicating more reliable/correct annotations.
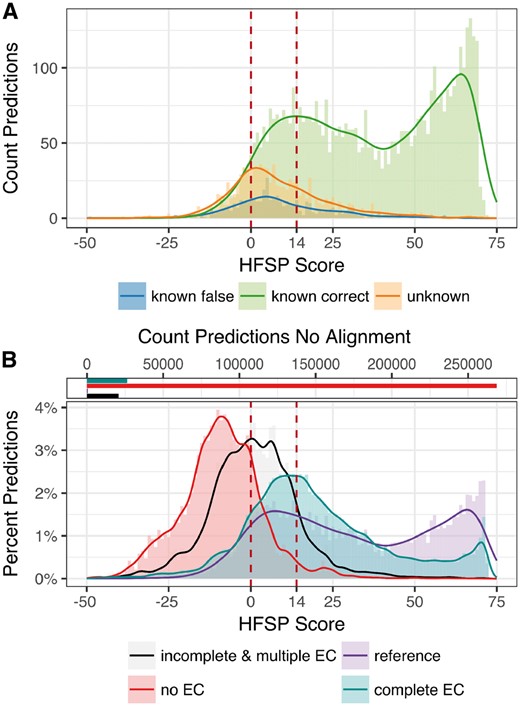
HFSP is robust to previously unseen enzymatic functionality. (A) Proteins with no known homologs—approximated by investigating experimentally annotated proteins which fall into a EC category unique to the protein (orange)—show on average smaller highest scoring HFSP hits than proteins with existing homologs (green—correct predictions, blue—incorrect predictions). Of all predictions at HFSP score ≥14, <10% of proteins with ‘unknown’ and ‘known’ but falsely predicted function where observed (B, bottom panel): highest HFSP score predictions for different protein subsets of the non-reduced Swiss-Prot: (i) experimentally verified enzymes (reference—purple), (ii) enzymes with EC annotation complete on all four levels that are not experimentally verified (complete EC—teal), (iii) enzymes with incomplete EC annotation or multiple EC annotations (incomplete & multiple EC—black) and (iv) proteins that are not annotated as enzymes (no EC—red); note that for most proteins with no EC annotation there were no matched to the reference database (268 857 proteins, 91%; B, top panel)
Given the vast number of proteins that yet have to be functionally annotated (e.g. TrEMBL is currently approaching 109 million proteins), the number of potential EC functionalities missing from our reference set, as well as the understanding that the total number of enzymes among the unannotated proteins may not mirror the Swiss-Prot distribution (where ∼47% of all proteins are annotated enzymes including those with incomplete and multiple EC annotations), we suspect that accurately estimating the HFSP cutoff at which the FDR would fall below some threshold, e.g. 5% (currently at HFSP ≥ 28), is not possible. For example, given the current distribution of scores, 29% of 1384 ‘unknowns’ and incorrect ‘knowns’ present at HFSP ≥ 14 make up only 407 proteins. If we were annotating tens of millions of proteins, however, this error rate can be expected to produce hundreds of thousands of annotations. On the other hand, given the limited size of our reference database, we cannot necessarily expect that the true positive findings would grow accordingly.
We further predicted EC annotation for all Swiss-Prot (555 594 proteins in October 2017, Fig. 7B). Importantly, the majority (91%) of the non-enzymes (no EC annotations; 293 058 proteins) did not generate any matches to our reference database. Of the remaining non-enzymes, 21% (4987 proteins) scored at HFSP ≥ 0, making up 3% of all predictions (false positives, 1% for all predictions at HFSP ≥ 14). Predictions could be made for 57% of the enzymes with multiple or incomplete EC annotations (27 717 of 48 536 proteins); 53% (14 668 proteins) of these scored at HFSP ≥ 0 and 13% above HFSP ≥ 14 (3653 proteins). If these proteins were like our ‘unknowns’, we would expect at least twice as many with a match at HFSP ≥ 14. Thus, we suspect, that the enzymes in this set are not especially novel and can likely be annotated using HFSP and our reference dataset. This further suggests that at least 73% (43% no hits and 30% below HFSP = 0) of proteins with incomplete or multiple EC annotations could be proteins with no homologous sequence in our reference database.
In light of our findings, we note that without further experimental work to elaborate on the functions of the yet-unannotated proteins, even the best function prediction methods will soon reach their limits. We suggest that using HFSP cutoffs can help in both more accurately annotating protein function and, arguably even more importantly, in identifying new frontiers of molecular function exploration.
4 Conclusion
While experimental function annotation of proteins is more accurate, computational methods are more readily available for the vast amount of sequences currently in our databases. Here we demonstrated that our newly developed HFSP is a fast an accurate method applicable to this task. Applying HFSP to evaluate existing annotations we also highlighted inconsistencies in existing annotations of enzymatic activity reported in Swiss-Prot. We thus suggest that HFSP provides both a way to (i) enrich functional annotation analysis on a large scale, as well as to (ii) narrow down the space of proteins of interest for further experimental analysis.
Acknowledgements
We thank Drs Chengsheng Zhu and Max Miller (both Rutgers), for all help with interpreting our data and providing feedback on the manuscript. We also want to extend our deepest gratitude to Dr Peter Kahn (Rutgers) for his valuable feedback and help in finalizing the manuscript. Big thanks to Dr Predrag Redivojac, Jiang Yuxiang (both Indiana U) and Yanran Wang (Rutgers) for valuable discussions. Last but not least, we thank all those who deposit their experimental data in public databases and those who maintain these databases.
Funding
Y.B. was supported by the NSF CAREER Award 1553289, NIH U01 GM115486, and USDA-NIFA 1015: 0228906; Y.B. and Y.M. by the TU Munich (TUM)—Institute for Advanced Study Hans Fischer Fellowship (TUM-IAS), funded by the German Excellence Initiative and the EU Seventh Framework Programme, grant agreement 291763.
Conflict of Interest: none declared.
References

