


Abstract
The biological relevance of chimeric RNA alignments is now well established. Chimera arising as chromosomal fusions are often drivers of cancer and recently discovered circular RNA (circRNA) are only now being characterized. While software already exists for fusion discovery and quantitation, high false positive rates and high run-times hamper scalable fusion discovery on large datasets. Furthermore, software available for circRNA detection and quantification is limited.
Here, we present STAR Chimeric Post (STARChip), a novel software package that processes chimeric alignments from the STAR aligner and produces annotated circRNA and high precision fusions in a rapid, efficient and scalable manner that is appropriate for high dimensional medical omics datasets.
STARChip is available at https://github.com/LosicLab/STARChip.
Supplementary data are available at Bioinformatics online.
1 Introduction
The key agnostic hallmark of the RNA-seq assay compared to microarray is the potential to observe previously unknown RNA fragments. This revolutionary power, in principle, allows for a complete de novo sampling of the transcriptome. At present, however, this ideal is rarely attained in practice. Difficulties of computation, interpretation and validation typically impede one from attempting to leverage RNA-seq beyond straightforward linear gene expression analysis. Nevertheless, confronting the reality of the complicated, dynamically spliced eukaryotic transcriptome in large high dimensional omics datasets naturally raises important and increasingly tractable questions about non-mRNA fragments, including circular RNA (circRNA) and RNA from chromosomal rearrangements.
In fact, there is a rapidly growing field of research indicating that circular isoforms of RNA are common, tissue specific (Salzman et al., 2013), expressed across eukaryotes (Wang et al., 2014) and may be associated with disease (Bachmayr-Heyda et al., 2015). The molecular function of circRNA is unknown, with evidence indicating circRNA can regulate microRNA (Hansen et al., 2013), though this is not likely the function of most circRNA (Guo et al., 2014). CircRNA lack polyA tails and can be detected in RNA that has been prepared using a RiboZero protocol (Fig. 1). Perhaps surprisingly, for at least a fraction of genes accurate quantification of protein coding transcripts can be confounded by circRNA abundance (Salzman et al., 2013).
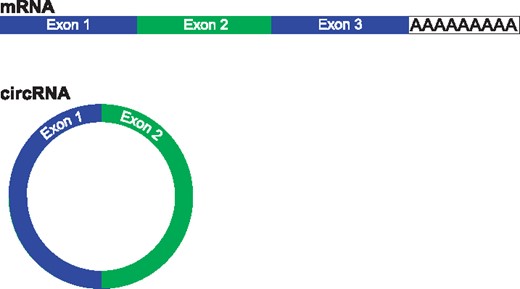
Description of typical circRNA compared to mRNA. mRNA (top) are typically composed of several exons and a poly-adenine tail. CircRNA (bottom) are commonly composed of exons, however they lack poly-adenine tails
Non-linear RNA alignments can also be used to detect chromosomal rearrangements, a common causal factor in cancer. Chromosomal fusions are the aberrant connection of part of one chromosome with another. Initially described in chronic myelogeneous leukemia, recurrent chromosomal fusions have been described in 20 types of cancer (Mertens et al., 2015). Uncovering these fusions contributes to knowledge of the pathogenesis of disease as well as serving as clinical biomarkers. Because chromosomal fusions may occur in non-transcribed regions of the genome, RNA-seq is limited in its ability to observe all such events. On the other hand, whole genome sequencing is relatively expensive and does not generally provide any information about gene expression.
The landscape of software tools for circRNA and RNA fusion detection is actively evolving. For the rapidly developing field of circRNA, the existing options generate results that are inconsistent with one another (Hansen et al., 2016), and only one software package (CircRNA Identifier (CIRI); Gao et al., 2015) leverages the power of multiple samples to improve circRNA prediction. Fusion detection is a more developed field with several mature software options (Haas et al., 2017; Jia et al., 2013; Kim and Salzberg, 2011; Nicorici et al., 2014), however we will show that these tools suffer from a high false-positive rate that prohibits validation using limited patient DNA. Additionally, the majority of existing fusion detection software packages perform alignments as a part of their sequence alignment pipeline, which prevents the use of the same alignments for both chimera detection and linear gene expression quantification. This can represent a significant increase in the computational burden of any bioinformatics pipeline.
Reasoning that a simplified filtration of high quality chimeric alignments will improve circRNA and fusion detection, we created a single software package based on the STAR aligner (Dobin et al., 2013), STAR Chimeric Post (STARChip). This open-source software is accessible to anyone with the technical expertise required to perform RNA-seq alignments.
2 Materials and methods
STARChip is written in Perl, Bash and R. It is implemented in two distinct modes; detection of circRNA or fusion transcripts (Fig. 2). STARChip is able to process raw sequence (FASTQ format) or to directly use the output of the STAR aligner. Chimeric alignment is a feature of STAR—using the flag, ‘–chimSegmentMin’ with a positive value will generate chimeric output. This value indicates the minimal length in base pairs required on each segment of a chimeric alignment. In practice, we use 15 bpb, however, larger values should make results more accurate, while smaller values should make results more sensitive. It is recommended to use a STAR index containing all reference chromosomes and unplaced contigs—reads transcribed from unplaced contigs may map chimerically without a proper reference. For annotation, STARChip relies on reference gene annotation (GTF) and sequence (FASTA) files, which must be modified for use with STARChip using a built in script. Software dependencies are R (R Core Team, 2015), BEDTools (Quinlan, 2014), SAMtools (Li et al., 2009) and MAFFT (Katoh and Standley, 2013).
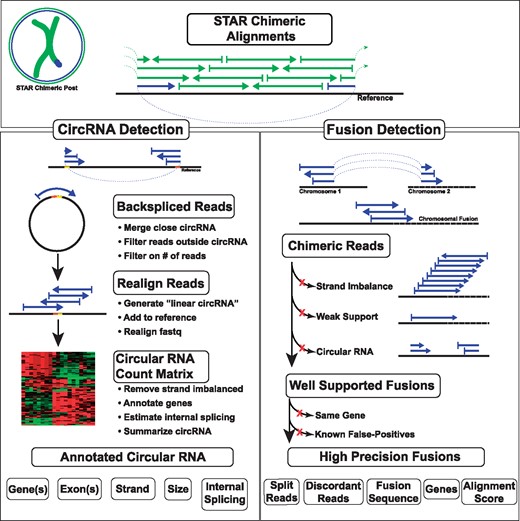
STARChip flow diagram. CircRNA (left side) are processed by filtering STAR Chimeric output files to discover backspliced reads. These reads are proximity-merged with other circRNA, filtered if part of the read aligns outside the circRNA, and summarized for each sample. Filtering on the number of reads and sample frequency provides a list of circRNA for follow-up. Optionally, raw sequences are re-aligned to a reference with circRNA sequence inserted. An integer count matrix of circRNA in each sample is generated, and summary visualizations are generated. Optionally, genes are annotated for each end of the circRNA, and linear splicing internal and external to the circRNA is summarized. Fusion transcripts (right side) are identified by first collapsing all chimeric reads on location. Those putative fusion sites with strand imbalanced support (i.e. aligned reads are selectively aligned to a single strand), very weak support, or that appear to be circRNA are excluded. Fusions are then annotated for genes, known CNVs and repeat regions. Fusions within the same gene or CNV are excluded, as are fusions that fall into known false-positive gene pairs. Finally, well-annotated, high precision fusions are written in tab-delimited format
2.1 CircRNA detection
STARChip detects high quality circRNA by drawing power from all available samples, using multithreading to achieve rapid run times. In order to accommodate different use cases, STARChip circRNA detection can be run distributed or locally. Users provide the location of FASTQ or STAR output directories and use a parameter file to specify the minimum required reads of support and the minimum samples needed to call a circRNA. STARChip will run on paired- or single-end data of any length that STAR can align. Greater power and precision can be expected from paired-end and longer reads due to improved alignments.
2.1.1 Detection and filtration of circRNA
The initial step of in circRNA detection is searching all chimeric alignments for ‘back-spliced’ reads. These are reads for which two chimeric segments align on the same chromosome and strand, with the 5′ segment aligning downstream of the 3′ segment (Fig. 1). By default, STARChip limits circRNA to chimeric alignments < 100 000 bp apart, chimeric junctions with less than 6 bp of identical sequence on each side of the junction and does not call circRNA on mitochondrial chromosomes. CircRNA reads passing these filters are then merged if junction ends are very close (default 5 bp). Each read is checked to ensure the entire alignment is within the proposed circRNA. CircRNA with less than 95% of reads aligning completely within the circRNA are eliminated as likely non-circular. Paired-end data with large inserts between reads are particularly well powered to satisfy this requirement. Finally, circRNA that are present with sufficient read support and sample frequency are carried forward for annotation and analysis.
Indeed, multiple samples can be used to improve the reliability and confidence of circRNA detection and splicing prediction. There is greater confidence in circRNA found in multiple samples than those found in a very few samples. A user-set filter requiring circRNA to be present in a minimum number of patients leverages power from all samples. Additionally, internal circRNA splicing predictions output the splicing pattern most common across all samples.
A recommended optional step is re-alignment of FASTQ files, including in the reference genome an artificial chromosome composed of circRNA sequence. This circRNA FASTA sequence is centered on the back-splice site, allowing circRNA reads to align linearly to the circRNA reference and facilitates an additional strand imbalance filter. CircRNA with 10× more reads on one strand in at least 50% of samples are removed as likely false-positives.
2.1.2 Quantification of circRNA
STARChip quantifies circRNA by counting reads aligned to the backsplice. If realignment is performed, this relies on the default STAR ‘quant mode’. Without realignment, reads in chimeric output mapping to the same backsplice are counted.
2.1.3 Annotation of circRNA
CircRNA are annotated for known genes, including if the junction is within an exon, intron or outside of any known gene. STARChip automatically constructs a heat map, outputs principle component plots and provides total circular read adjusted counts-per-million values for each circRNA detection.
STARChip can optionally characterize the internal structure of the cRNA by analyzing linear splice junctions within and around the backsplice site. Internal splice junctions are counted in all samples and summarized across the entire cohort, providing an annotation of exons in BED format for straightforward assessment of the spliced size and sequence of the circRNA. Extra-circRNA linear splices are also quantified, e.g. forward-splices into the circRNA splice acceptor, out of the circRNA splice donor or forward splices that envelop the circRNA by splicing from 5′ of the circRNA to 3′ of the circRNA. These measures can be useful for questions into the nature of circRNA and the genomic environments associated with circRNA formation. All linear splices with an acceptor or donor within the genomic region of each circRNA are summarized for each sample by recording the maximum linear splice value, which is often useful as a proxy for estimating the fraction of reads derived from circRNA at a given loci.
The output of STARChip circRNA detection is designed to be easily understandable, amenable for export to additional pipelines or software and have a scalable level of technical detail to accommodate a broad range of research goals. Default settings should work in most studies, however many parameters allow the software to be completely customizable.
2.2 Fusion detection
STARChip detects fusion transcripts in a distributed fashion, with each sample run separately. This allows rapid completion of large cohorts with a computing cluster. Read depth filters can be manually set by the user or selected automatically for each sample. We briefly outline our fusion detection strategy here, with more details given in the Supplementary Methods.
2.2.1 Fusion read support thresholds
Automatic read support thresholds were developed for users to quickly and easily analyze their data. To select thresholds, we calculated sensitivity and the total false-positives (fusions detected in healthy tissues) as read requirements were increased. The results of this process, similar to a receiver operating characteristic curve, are presented in Supplementary Figure S1. We selected as default a threshold that provides 32% sensitivity with only 15 fusions called across all healthy tissues (0.28 fusion reads per million mapped reads). The high-sensitivity threshold requires only 0.05 fusion reads per million mapped reads, which results in 42% sensitivity and 111 fusions detected in healthy tissues.
2.2.2 Fusion filtration
Putative fusions reported by STAR are reduced using a rational succession of filters designed to maximize accuracy of results. These steps (detailed in Supplementary Methods) leverage the sequences, read support details and, if available, genomic annotations of the chimeric breakpoints.
2.2.3 Fusion output
STARChip exports fusions passing these filters into two files: a highly detailed table and a streamlined format summary table designed for quick examination and characterization. For each fusion, all reads contributing read support across the fusion junction are aligned and the consensus sequence is generated. This sequence can be helpful for hand-checking the validity of output fusions or experimentally quantifying the fusion. Finally, the code for generating a circos-style plot (Krzywinski et al., 2009; Ying and Chunhua, 2015; Supplementary Fig. S2) is output for users wishing to create circular visualizations of interchromosomal connections and potentially annotate them by phenotype.
2.3 Performance assessment of STARChip
2.3.1 Assessment STARChip circRNA
STARChip’s ability to detect and measure circRNA was benchmarked using two publicly available datasets. The first is a high read depth RNA-seq study of human fibroblasts both with and without RNA exonuclease digestion (Jeck et al., 2013). Since exonuclease treatment selectively removes linear, but not circRNA, these data can in principle indicate which called circRNA are truly circular as opposed to miscalled linear RNA. Five circRNA detection tools have previously been evaluated with respect to this exonuclease dataset (Hansen et al., 2016), crucially using the convention that circRNA found in the normal samples are considered bona fide if they are present at 5× higher abundance in exonuclease treated samples. We apply the same convention here to assess STARChip circRNA quantification against these same tools: find_circ v1.2 (Memczak et al., 2013), CIRCexplorer v2.2.7 (Zhang et al., 2016), circRNA_finder (Westholm et al., 2014) and CIRI v2.0.6 (Gao et al., 2015). MapSplice v2.21 (Wang et al., 2010) was run but no samples finished after 144 h. Each software package was run with default parameters, given 12 AMD Interlagos (2.3 GHz) cores on a single host with a maximum wall-time of 144 h. Multithreading was enabled when available. CIRCexplorer is able to use multiple aligners, we used only the default Tophat2/Tophat-Fusion protocol.
Additionally, we used the data from a study of mouse neural tissues (Rybak-Wolf et al., 2015) prepared with ribosomal-depleted RNA to demonstrate common usage and the annotation features of STARChip. Further details are found in the Supplementary Methods.
2.3.2 Assessment of STARChip fusion detection
Fusion detection with STARChip was evaluated by comparing the performance of STARChip with three other leading fusion detection software packages when applied to five different studies. SOAPFuse (Jia et al., 2013) and FusionCatcher (Nicorici et al., 2014) were selected given their performance in recent comparison papers (Kumar et al., 2016; Liu et al., 2016), while STAR-Fusion (Haas et al., 2017) was selected because it was recently developed and is also based on the STAR aligner. To compare these methods with STARChip, we used RNA-seq from breast cancer cell lines (‘Edgren’)(Edgren et al., 2011; Kangaspeska et al., 2012), breast cancer cell lines validated with long-read sequencing (‘Weirather’) (Weirather et al., 2015), a mixture of melanoma samples and cell lines (‘Berger’) (Berger et al., 2010), prostate cancer samples with paired normal (‘Ren’) (Ren et al., 2012) healthy tissues (‘Bodymap’) (BodyMap 2.0, 2014). Only paired-end samples were examined given this is a requirement for SOAPFuse. Details of these samples can be found in Table 1.
Studies used to compare fusion/CircRNA software
| Study | Samples | Validated fusions | Source |
|---|---|---|---|
| Jeck | 4 | NA | RNAse treated/control |
| Berger | 6 | 9 | Melanoma samples/cell lines |
| Bodymap | 16 | 0 | Healthy tissues |
| Edgren normal | 1 | 0 | Normal breast |
| Edgren tumor | 4 | 40 | Breast cancer cell lines |
| Ren normal | 14 | 0 | Adjacent normal samples |
| Ren tumor | 14 | 9 | Prostate cancer samples |
| Weirather | 1 | 35 | Breast cancer cell line |
For each of Edgren, Weirather, Berger and Ren, there are known, experimentally validated, published fusions associated with cancer tissues. Called fusions were categorized as true positives if the partner genes were identical to those of the known fusions. We calculated sensitivity as the fraction of validated fusions that could be detected. Precision was calculated as the fraction of called fusions that could be mapped to a validated fusion. It should be noted that the difficult nature of exhaustively finding and validating all fusion transcripts in cancer tissues implies a strong probability of false-negative calls in these studies.
3 Results
We implemented STARChip to detect and quantify circRNA and fusions in several datasets. We report here the sensitivity and precision of STARChip and compare it with other leading tools in this field.
3.1 STARChip circRNA
3.1.1 STARChip circRNA sensitivity and precision
Using previously published methods (Hansen et al., 2016), we assessed the effectiveness of STARChip and four other published circRNA tools. STARChip reported the highest percent bona fide circRNA (74.8%) and the second most bona fide circRNA (2042) (Fig. 3A). Although CIRI reported the most bona fide circRNA (2122), only 67% of all reported circRNA were bona fide. Enumerated results can found in Supplementary Tables S2 and S3.
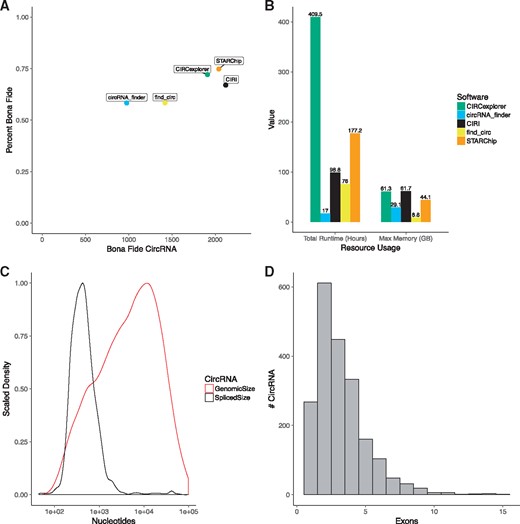
STARChip CircRNA performance. All results shown are for the Jeck et al. dataset. (A) Percent bona fide versus number of bona fide circRNA observed. (B) Total runtime required and maximum memory required. (C) Scaled density plot of circRNA genomic size (red) and estimated spliced size (black). (D) Histogram of exons per circRNA
3.1.2 STARChip circRNA runtimes
Runtimes for STARChip circRNA can vary based on the number of samples, number of computational threads used, number of circRNA discovered and which features of STARChip are employed. For this paper, we show data making use of all STARChip features, including realignment with STAR. Comparison with other software packages is demonstrated in Figure 3B. STARChip requires less memory than CIRI and less time than CIRCexplorer.
3.1.3 STARChip circRNA splice inference
STARChip estimates the internal structure of circRNA from observed splice junctions, outputting the data in BED format. This feature was used to examine the size distribution of bona fide circRNA before and after splicing (Fig. 3C). Similarly, an estimate of the number of internal exons in bona fide circRNA is shown in Figure 3D. These outputs provide an easy reference for both validation and computational comparisons of different datasets.
3.2 STARChip fusions
A guiding design principle for STARChip was improved precision, in contrast to most currently available software. This is driven by our experience with high dimensional medical omics data and the intractability of validating hundreds or even thousands of fusion calls with limited patient DNA.
3.2.1 STARChip fusions sensitivity and precision
Sensitivity and precision of all RNA-seq fusion studies merged are shown in Figure 4A. STARChip is an outlier for having relatively strong precision at the expense of decreased sensitivity. Figure 4B and Supplementary Table S4 show the strong variation of these values from study to study. The high precision of STARChip is again demonstrated in Figure 4C. Within two non-cancerous datasets, STARChip with default settings returned only 15 fusions, presumably false-positives. In contrast, FusionCatcher, STAR-Fusion and SOAPFuse reported 135, 824 and 6962 fusions found in these same healthy samples.
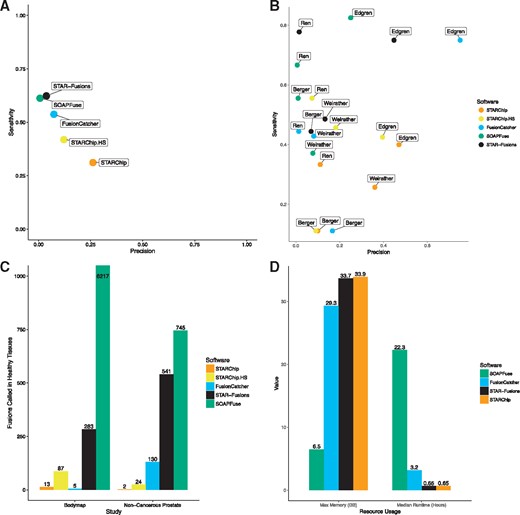
Comparison of STARChip with other fusion detection software. (A) Sensitivity versus precision for all fusion-finders and all studies summarized. (B) Sensitivity versus precision separated by study. This plot demonstrates the variable efficacy of each tool by study. (C) False positives are shown for two groups of healthy samples. On the left is the Illumina bodymap (BodyMap 2.0, 2014) cohort of healthy tissues, on the right are paired normal prostate samples from (Ren et al., 2012). The FusionCatcher value for Bodymap is likely deflated because that software determined known false-positives using this same dataset. (D) Maximum memory in gigabytes (GB) and median runtimes in hours. There was no meaningful difference in these measures for STARChip and STARChip in high sensitivity mode
3.2.2 STARChip fusions computational burden
An additional benefit to STARChip is its small computational footprint. Figure 4D shows that STAR-Fusion and STARChip are extremely rapid to run, while requiring ∼34 GB of memory for human or mouse genomes. The median runtimes for SOAPFuse and FusionCatcher were 22.3 and 3.2 h, compared to 0.65 h for both STAR-based aligners.
4 Discussion
Our results indicate that in the young field of software for circRNA and fusion RNA analysis, STARChip provides key advances in circRNA detection, circRNA quantification, circRNA annotation, high-precision fusion prediction and overall computational burden.
4.1 STARChip circRNA
With circRNA research in its infancy, there are few ‘gold standard’ datasets with which to assess the effectiveness of new tools. Individual predicted circRNA are easily validated in the laboratory, however this strategy is clearly not scalable. Assessing confidence in RNA-seq detected circRNA is often dependent on exonuclease treatment, with the expectation that circRNA will be enriched in exonuclease treated RNA, compared to non-treated samples. Although this strategy has several untested assumptions, we will proceed with it for lack of alternatives.
STARChip detects circRNA effectively by assessing chimeric output from STAR alignments, incorporating these into a reference genome, realigning with STAR and filtering the output. With this strategy STARChip achieves the best precision of all tools tested and nearly the best sensitivity (Fig. 3A). This does not appear to come at an increased resource cost. Both CIRI and CIRCexplorer had competitive precision and sensitivity values; STARChip required 43 and 179% of the runtimes of these packages, respectively, and ∼72% of the memory requirements.
STARChip attempts to streamline downstream analysis by providing high quality circRNA annotations. Gene annotations, internal splicing structure predictions, circRNA genomic size, spliced size and alignment scores facilitate feature-mining circRNA in considerable detail, enabling rapid biological insight. Supplementary Figure S3 provides several examples of circRNA analyses made simple with the outputs of STARChip.
4.2 STARChip fusions
Ideally, RNA-seq fusion detection would be rapid, sensitive and precise. SOAPFuse, FusionCatcher and STAR-Fusion unsurprisingly all have strong sensitivity and precision values when benchmarked on the Edgren study. These values however, do not appear to be predictive of performance in other studies (Fig. 4B). Indeed, the landmark Edgren study represents the earliest available comprehensive RNA-seq fusion dataset, and most, if not all, fusion detection software is written based on the features of the fusions identified in this study. Additionally, some of the validated fusions in Edgren are present at very low read depths in the RNA-seq data. Software tuned to detect these fusions must be hypersensitive by construction. Unfortunately, for all other datasets, this hypersensitivity naturally results in extremely low precision values. The value of this sensitivity/precision balance is context dependent: clinical users may require the utmost sensitivity when searching for specific fusions. Epidemiologist however will find research difficult when results are composed of 92–99% false positives. With STARChip, we have attempted to emphasize precision at the expense of sensitivity in these particular gold-standard studies, reasoning that such hyper-tuning inflates type I error in mining novel datasets.
The value and necessity of this strategy are emphasized in Figure 4C. For two studies of healthy tissues, the total number of fusions reported by STARChip is far lower than the other tools. An important but superficial exception to this is FusionCatcher, which used precisely the Bodymap data to identify and automatically hard-filter false-positive fusion partners. Of course this trivially lowers the number of fusions called in Bodymap by FusionCatcher compared to the independent dataset from Ren. Fusions called from RNA-seq must be validated in the lab using Sanger sequencing or other methods. By dramatically lowering the number of false-positive fusions called, STARChip generates output that can reasonably be tested by laboratories with modest resources.
Researchers with limited computing resources may select SOAPFuse for its ability to run on a basic workstation or laptop (6.5 GB memory), though the runtimes are much higher. With sufficient memory however, these STAR-based aligners can save significant computing time. It should be noted that the majority of the time and memory requirements for STARChip arise from the STAR alignment. This alignment is run in order to facilitate expression quantitation in almost all studies that generate RNA-seq data. Thus in the context of a typical study, running STARChip fusion detection represents a minor addition to usual computational requirements, often less than 5 min per sample.
Using STARChip in a pan-cancer dataset, we observed both previously reported and novel fusion events (See Supplementary Results and Discussion). These findings demonstrate the utility of STARChip in large-scale fusion screening.
Acknowledgements
We gratefully acknowledge useful discussions with Gabriel Hoffman, Johan Bjorkegren, Lesca Holt, and Daniel Teupser. We also acknowledge many improvements to the manuscript were made in response to insights from our peer reviewers.
This work was supported in part through the computational resources and staff expertise provided by Scientific Computing at the Icahn School of Medicine at Mount Sinai.
Funding
This work was funded by the Icahn Institute for Genomics and Multiscale Biology.
Conflict of Interest: none declared.
References
BodyMap 2.0 (

