


Abstract
The large-scale multidimensional omics data in the Genomic Data Commons (GDC) provides opportunities to investigate the crosstalk among different RNA species and their regulatory mechanisms in cancers. Easy-to-use bioinformatics pipelines are needed to facilitate such studies.
We have developed a user-friendly R/Bioconductor package, named GDCRNATools, for downloading, organizing and analyzing RNA data in GDC with an emphasis on deciphering the lncRNA-mRNA related competing endogenous RNAs regulatory network in cancers. Many widely used bioinformatics tools and databases are utilized in our package. Users can easily pack preferred downstream analysis pipelines or integrate their own pipelines into the workflow. Interactive shiny web apps built in GDCRNATools greatly improve visualization of results from the analysis.
GDCRNATools is an R/Bioconductor package that is freely available at Bioconductor (http://bioconductor.org/packages/devel/bioc/html/GDCRNATools.html). Detailed instructions, manual and example code are also available in Github (https://github.com/Jialab-UCR/GDCRNATools).
1 Introduction
Competing endogenous RNAs (ceRNAs) are RNA molecules that regulate other RNA transcripts by competing for the shared miRNAs. Deregulation of ceRNA networks may lead to human diseases including cancers. Although functions of a few lncRNA-related ceRNAs have been reported to play critical roles in cancer development (Kumar et al., 2014; Liu et al., 2014), the regulatory mechanisms of a large portion of ceRNAs remain to be unraveled.
The Genomic Data Commons (GDC) provides the cancer research community with a repository of standardized genomic and clinical data from multiple programs including The Cancer Genome Atlas (TCGA), Therapeutically Applicable Research to Generate Effective Treatments (TARGET), as well as data from the Foundation Medicine company. Tools such as TCGA-Assembler (Zhu et al., 2014) and TCGAbiolinks (Colaprico et al., 2016) that were initially developed for retrieving and analyzing TCGA data from DCC (Data Coordinating Center) have been updated to access GDC data. However, none of them offer a route for integrative analysis of RNA-seq and miRNA-seq data.
Here, we present a new R/Bioconductor package, GDCRNATools, for downloading, organizing and integrative analyzing RNA data in GDC (Fig. 1). A newly developed algorithm spongeScan (Furió-Tarí et al., 2016) is used to predict miRNA response elements (MREs) in lncRNAs acting as ceRNAs. In addition, databases including starBase v2.0 (Li et al., 2014), miRcode (Jeggari et al., 2012) and miRTarBase (Chou et al., 2017) are also integrated and used as evidence basis for miRNA-mRNA and miRNA-lncRNA interactions in the package to identify ceRNAs in cancers. Besides ceRNAs network analysis, many routine analyses can be performed in GDCRNATools, including differential gene expression analysis, functional enrichment analysis and univariate survival analysis. GDCRNATools allows users to easily perform the comprehensive analysis or integrate their own pipelines such as molecular subtype classification, weighted correlation network analysis (WGCNA; Langfelder and Horvath, 2008) and TF-miRNA co-regulatory network analysis, etc. into the workflow.
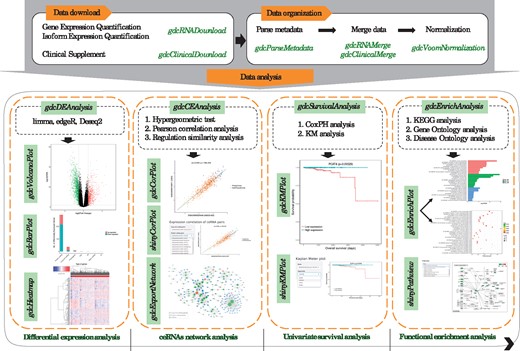
Workflow of GDCRNATools
2 Implementation and main functions
2.1 Data download and organization
To facilitate utilization of the up-to-date datasets in GDC efficiently, a few simple functions are provided to download and organize the data.
gdcRNADownload can download HTSeq-Counts data of RNA-seq and isoform quantification data of miRNA-seq automatically by simply specifying project ID and data type.
gdcParseMetadata parses metadata associated with downloaded files to facilitate downstream analysis.
gdcRNAMerge merges total read counts for 5p and 3p strands of miRNAs in isoform quantification data and HTSeq read counts of gene quantification data to single expression matrices, respectively.
2.2 ceRNAs network analysis
gdcCEAnalysis uses three criteria to identify competing lncRNA-mRNA pairs: (a) the number and hypergeometric probability of shared miRNAs by a lncRNA-mRNA pair, (b) the strength of positive expression correlation between lncRNA and mRNA and (c) the overall regulation similarity of all shared miRNAs on the lncRNA-mRNA pair.
2.3 Other downstream analyses
gdcDEAnalysis can implement three most commonly used methods: limma (Ritchie et al., 2015), edgeR (Robinson et al., 2010) and DESeq2 (Love et al., 2014) to identify differentially expressed genes (DEGs).
gdcEnrichAnalysis performs Gene Ontology (GO) and Kyoto En-cyclopedia of Genes and Genomes (KEGG) functional enrichment analyses using the latest databases through the R/Bioconductor package clusterProfiler (Yu et al., 2012). Disease Ontology analy-sis using DOSE package (Yu et al., 2015) is also included in the gdcEnrichAnalysis function to detect gene-disease associations.
gdcSurvivalAnalysis can perform both Cox Proportional-Hazards (CoxPH) regression and Kaplan Meier (KM) survival analyses reporting the hazard ratio, 95% confidence intervals and P-value for the tested genes on overall survival.
3 Conclusion
We have developed a novel R/Bioconductor package to conduct advanced analyses of RNA-seq and miRNA-seq data in GDC. This easy-to-use package allows users with little coding experience to perform the entire analysis smoothly. As standardized data from other programs would be submitted to GDC, we believe that GDCRNATools will gain ground in cancer research for deciphering the crosstalk among multiple RNA species and their regulatory mechanisms.
Funding
This work was supported by the Faculty Start-up Fund to Z.J. and UC Aca-demic Senate Regents Faculty Fellowship to Z.J., and also partially supported by the grants from National Key Basic Research Program of China [2015CB553706], the Fundamental Research Funds for the Central Universities [2017PY023], the Projects of Guizhou Province [QKHW-G [2014]7004] and the National Natural Science Foundation of China [81571427, 81641102, 81660426, 81360119].
Conflict of Interest: none declared.
References
Author notes
The authors wish it to be known that, in their opinion, Ruidong Li and Han Qu authors should be regarded as Joint First Authors.

