


Abstract
Small RNAs play key roles in gene regulation, defense against viral pathogens and maintenance of genome stability, though many aspects of their biogenesis and function remain to be elucidated. SCRAM (Small Complementary RNA Mapper) is a novel, simple-to-use short read aligner and visualization suite that enhances exploration of small RNA datasets.
The SCRAM pipeline is implemented in Go and Python, and is freely available under MIT license. Source code, multiplatform binaries and a Docker image can be accessed via https://sfletc.github.io/scram/.
Supplementary data are available at Bioinformatics online.
1 Introduction
Small interfering RNAs (siRNAs) and microRNAs (miRNAs) are classes of small RNA derived from longer fully or partially double-stranded RNA (dsRNA) precursors. siRNAs act in the RNA interference (RNAi) pathway to direct degradation and/or translational repression of complementary RNA, as well as target DNA regions for RNA-directed DNA methylation (Borges and Martienssen, 2015). By contrast, miRNAs guide the degradation and/or translational repression of complementary endogenous mRNA transcripts (Zhang et al., 2006).
Next-generation sequencing is widely used to quantify the abundance of discrete small RNAs. Several tools have been developed that align small RNA reads to reference sequences, including all-purpose aligners such as Bowtie (Langmead et al., 2009), STAR (Dobin et al., 2013) and BWA (Li and Durbin, 2009), and small RNA-specific tools wrapping general aligners, such as the Small RNA Workbench (Stocks et al., 2012) and ShortStack (Johnson et al., 2016). Limitations of existing tools include requirements for indexing reference sequences, pre-processing reads for adapter removal and normalization and, in cases such as siRNA analysis, extraction of specific read lengths post-alignment. Additionally, workflows to process alignment outputs and visually compare counts and profiles among treatments are either complex or absent, and thus require a degree of expertise to perform. In contrast, the Small Complementary RNA Mapper (SCRAM) pipeline was developed as a simple-to-use integrated alignment and visualization suite with no requirement for additional scripting and data manipulation prior to single-command plot generation. SCRAM has been used as a key component in several publications, demonstrating the role of DICER-LIKE 2 in systemic RNAi in Arabidopsis (Taochy et al., 2017), the differential response of plant (peanut) and insect (thrip) RNAi pathways to infection by a common tospovirus (Fletcher et al., 2016), and the sustained protection of plants from viral load by topical application of dsRNA in complex with clay nanosheets (Mitter et al., 2017). Comparative analyses of small RNA abundance and distribution are vital for deciphering small RNA function, and the SCRAM pipeline provides a rapid, simple-to-perform means for such comparisons.
2 Implementation
SCRAM uses fast naive algorithms for exact matching reads to reference sequences. Rather than align replicate read files sequentially, mean count and standard error are internally retained for each unique read in a hash map. Alignment to longer reference sequences is via scanning the sense and antisense strands in a window of a set size, e.g. 21 nucleotide (nt), and querying the hash map for the presence of the matching read at each increment (Supplementary Fig. S1A). In contrast, a miRNA aligning option identifies full-length sense-orientation reads that intersect the input mature miRNA reference set (Supplementary Fig. S1B). Visualization of alignments is through an associated Python package (scram_plot.py).
3 Results
Two classes of alignment are performed by SCRAM: (i) a ‘compare’ alignment, where the aggregate aligned read count and standard error for each individual miRNA or longer reference sequence is generated for two treatments or genotypes (e.g. Fig. 1A), and (ii) a ‘profile’ alignment, where position-by-position alignment data (i.e. mean count, standard error, strand etc.) for each individual reference sequence is generated for a single treatment or genotype (e.g. Fig. 1B). Read file inputs to the aligner can be in FASTQ, FASTA or collapsed FASTA format, with the options for on-the-fly 3’ adapter trimming, normalization of read count by library size, and read exclusion based on length or raw count. The output fields for ‘compare’ and ‘profile’ alignments are shown in Supplementary Table S1.
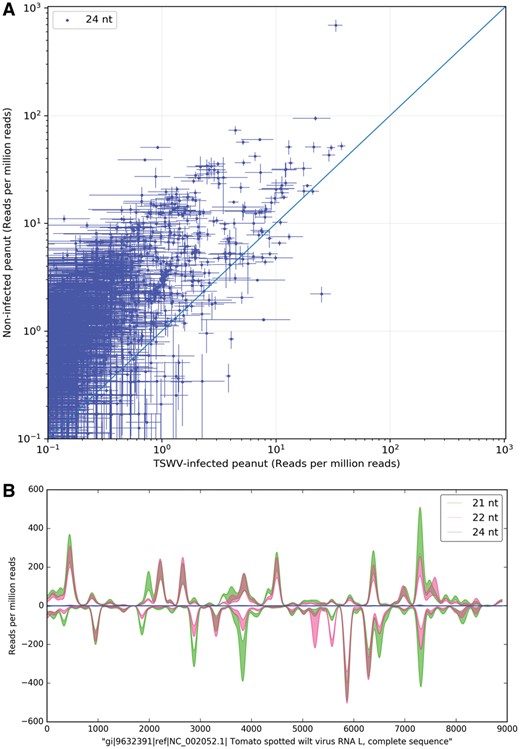
The SCRAM aligner and visualization packages combine to generate ‘compare’ and ‘profile’ plots for Tomato Spotted Wilt Virus (TSWV)-infected and non-infected peanut plants. (A) ‘Compare’ plot showing peanut transcript-aligned 24 nt read abundance for each treatment. The x and y values for each point represent the respective mean alignment counts to a single transcript, with standard error bars indicating the variance among aligned replicate reads. (B) ‘Profile’ plot displaying smoothed 21, 22 and 24 nt viral small RNA read coverage across a reference L RNA segment of TSWV. The shaded regions are bounded by mean coverage ± standard error of the aligned reads. Each plot is shown as generated, without manipulation. Experimental conditions and input read data for the figure are described in Fletcher et al. (2016)
Uniquely for repetitive multi-mapping reads, the aligned count can be evenly split by the number of loci to which the read can align, or retained as the full count for that read at all duplicated loci. Individual files in CSV format are generated for each small RNA size aligned (e.g. 21, 22 and 24 nt alignments are separately written to file), except in the case of miRNAs, where all full-length alignments are reported in a single file. Importantly, error associated with biological variation is propagated throughout the pipeline, the standard errors of reads aligned to a single reference added in quadrature (‘compare’ alignment; Fig. 1A), or as the standard error of each aligned read (‘profile’ alignment; Fig. 1B).
SCRAM’s aligner component maximizes multi-core CPU usage and speed without prior indexing of reference sequences, with most analyses able to be rapidly performed on consumer-grade PCs. Benchmarking of the SCRAM aligner for various example analyses is shown in Supplementary Table S2, with comparative features indicated in Supplementary Table S3.
Complementing the SCRAM aligner, the visualization package (scram_ploy.py) can be invoked in Jupyter Notebook. Each plot type displays the statistical variation present in the aligner output files; interactive ‘compare’ scatter plots show x and y standard error bars for each reference sequence (Fig. 1A, Supplementary Fig. S2), while ‘profile’ plots display standard error bounds of the smoothed mean coverage (Fig. 1B). An example workflow demonstrating the SCRAM pipeline’s capability is shown in Supplementary Fig. S3.
4 Conclusions
The SCRAM pipeline allows for fast exact matching of small RNA reads to reference sequences, whilst indicating error associated with biological variability. Visualization of generated outputs via Jupyter Notebook integration is simple and user-friendly, permitting entire workflows to be completed in minutes using rudimentary command line skills. The scenarios to which the pipeline is suited are diverse, and include generating virus- and dsRNA-derived small RNA profiles, demonstrating abundance shifts of discrete small RNA size classes between treatments or genotypes, and showing changes in location and magnitude of small RNA hotspots along reference sequences in response to particular treatments or mutations. Such applications demonstrate the SCRAM pipeline is a valuable addition to the small RNA researcher’s investigative toolkit.
Funding
This work was supported by the Australian Research Council [DP0988294, DP120103966 and DP150104048].
Conflict of Interest: none declared.
References

