


Abstract
Segmental Duplications (SDs) are DNA fragments longer than 1 kbp, distributed within and between chromosomes and sharing more than 90% identity. Although they hold a significant role in genomic fluidity and adaptability, many key questions about their intrinsic characteristics and mutability remain unsolved due to the persistent difficulty of sequencing highly duplicated genomic regions. The recent development of long and linked-read NGS technologies will increase the need to search for SDs in genomes newly sequenced with these technics. The main limitation of SD analysis will soon be the availability of efficient detection software, to retrieve and compare SD genomic component between species or lineages.
In this paper, we present the open-source ASGART, ‘A Segmental duplications Gathering And Refining Tool’, developed to search for segmental duplications (SDs) in any assembled sequence. We have tested and benchmarked ASGART on five models organisms. Our results demonstrate ASGART’s ability to extract SDs from any genome-wide sequence, regardless of genomic size or organizational complexity and quicker than any other software available.
The online version of ASGART is available at http://asgart.irit.fr. The source code of ASGART is available both on the ASGART website and at https://github.com/delehef/asgart.
Supplementary data are available at Bioinformatics online.
1 Introduction
Segmental duplications (SDs) are key reservoirs of genomic innovation. These segments of DNA are greater than 1 kb in length, are distributed within and between chromosomes, and share more than 90% sequence identity (Eichler, 2001). SDs represent approximately 5% of the human genome and 0.1 to 16% of human chromosomes (Samonte and Eichler, 2002). Their abundance in the human genome and association with Copy Number Variation (CNV) (Fredman et al., 2004) have important implications for genome dynamics (Goidts et al., 2006). SDs have been particularly well studied in great apes (Marques-Bonet et al., 2009) and human Y-chromosomes (Hallast et al., 2013; Rozen et al., 2003; Skaletsky et al., 2003), and these large duplications are also recognized as being involved in massive and complex genomic events in other organisms such as Arabidopsis thaliana (Cannon et al., 2004).
Despite their potential implications for genomic evolutionary dynamics, many key questions about the intrinsic characteristics or mutability of SDs remain unsolved due to the persistent difficulty of sequencing large duplicated regions. The recent development of long-read sequencing technologies such as PacBio (Rhoads and Au, 2015) or Oxford Nanopore (Laver et al., 2015), and linked-read sequencing technology such as 10× Chromium Genomics, represent an opportunity to generate de novo assemblies for any genome (Zheng et al., 2016). These techniques, and the possibility to combine them with well-known short-read sequencing techniques (Mostovoy et al., 2016; Tomaszkiewicz et al., 2016), have considerably changed the perspective of studying SDs. The primary limitation to the study of SDs will soon be the availability of computational tools dedicated to gathering and retrieving SDs from any assembled genome. At least three tools have already been used to this end by the bioinformatics community: MUMmer (Kurtz et al., 2004), LAST (Kiełbasa et al., 2011) and Red (Girgis, 2015). MUMmer is precise, but its tool officially recommended for duplication detection (nucmer) falls out of memory on large sequences; LAST, although fast, tends to require too much memory to process genome-scale sequences; Red is excellent at searching for repetitions but is not designed to work on large amplicons with more variance among repetitions or with larger duplications. Moreover, these programs mask repeated sequences without building underlying families of duplications. Therefore, none of these programs is ideal for the specific search and analysis of whole-genome segmental duplications.
In this paper, we present ASGART, ‘A Segmental Duplications Gathering And Retrieving Tool’, a new software developed to search for SDs in any assembled sequence. ASGART does so by browsing along two DNA strands, collecting identical k-mers which are then clustered in highly similar families—according to the precision settings given by the user. We have compared its performance with LAST and MUMmer by mapping duplications in five of the most commonly analyzed model organisms: Homo sapiens, Mus musculus, Danio rerio, Drosophila melanogaster and Arabidopsis thaliana. ASGART was shown to be capable of finding SDs in a distributed and parallel manner and in a shorter time than MUMmer and LAST; the proportion of SDs found and their intra- and inter-chromosomal distributions were in accordance with results found in the literature for these organisms. Our results demonstrate the ability of ASGART to extract SDs from any genome, regardless of genomic size and organizational complexity, and its high potential for performing whole-genome SD analyses.
2 Materials and methods
The core concept behind ASGART’s algorithm is that given a minimal identity rate and length characterizing a segmental duplication, there is a minimal length such that two substrings of this length in each of the repeated units of the duplication exactly match. For example, given a minimal length of 100 bases and an identity rate of 90%, it is guaranteed that there is at least one substring of 9 bases long common to both units of the duplication. However, in actual cases, dissimilarities between repeated units tend to be grouped in clusters of indels, and SNPs are seldom homogeneously distributed among repeated units. Given this assertion, ASGART’s strategy is to gather duplications between two fragments by looking for subsequences from the first fragment that exactly match others in the second and clustering them together to find the repeated units composing the SD, according to the scheme detailed here and illustrated in Figure 1:
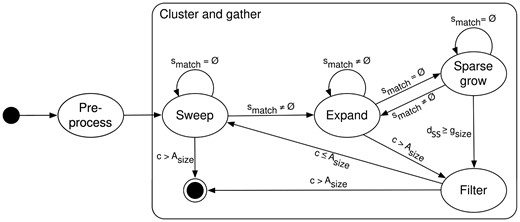
ASGART’s state automaton schema describing conditional transitions between states
pre-process DNA fragments in an efficient data structure;
gather identical k-mers from the two fragments;
merge and cluster these identical substrings together to form families of segmental duplications.
An illustrated example of our algorithm is shown in Figure 2.
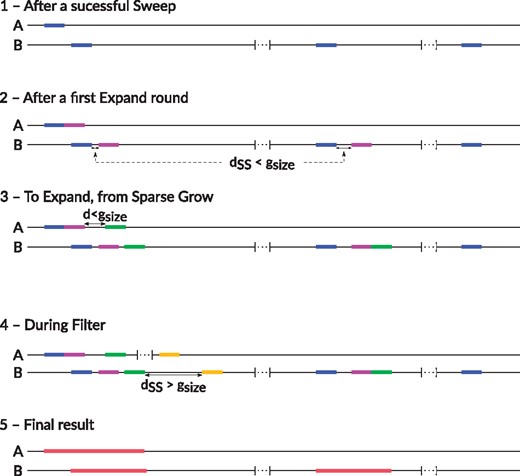
A schematic example of an ASGART run. (1) After a first successful Sweep, a k-mer in A has three matches found on B. (2) A second segment on A, contiguous to the first, has two matches on B close to the existing ones. Those are not contiguous to the existing matches from the previous step, but they are still close enough to be kept. (3) No contiguous k-mer to the last one on A having matches close enough to the existing ones on B, the automaton switched to Sparse Grow state, until it found one having matches on B close to the existing ones. (4) After spending some steps on Sparse Grow, a match on B for the k-mer on A was eventually. But it either didn’t have a match close to the existing ones or it was too far away; therefore, the automaton switch to the Filter state. (5) After the Final state, the third and last set of matches on B as been discarded, as it was too short w.r.t. the settings defined by the user. The other set of matches are marked as being duplications of the part on A
We define a string S as a sequence of letters from an alphabet Σ. The ith letter within a string S is denoted . A substring—or segment—from the ith to the jth letter of a string S is denoted .
A segmental duplication of length l and identity rate h is a set of strings at least l bases long so that each has an identity rate of at least h with the others: is defined by the n repeated units—or arms—Si and the minimal identity rate h between each pair of repeated units.
The identity rate between two strings is defined as the 100-complement of the ratio between the Levenshtein (or edit) distance of these strings and the length of the longest string. For example, two 100 bp long strings differing at ten loci have a 90% identity rate.
The distance between two sets of segments and is defined by , where the distance between two strings S1 and S2 is defined by if otherwise.
2.1 Pre-processing
As inputs, ASGART takes two DNA fragments, denoted A of size Asize and B of size Bsize, a probing size psize and a maximal gap size gsize. Both psize and gsize influence the granularity of the results. As output, ASGART gives a list of segmental duplications spanning the two fragments. To simplify the reuse of data by other tools, duplications with more than two repeated units are split in the results into multiple two-unit duplications (which is necessary in order to make an export to standard genome browsers’ input formats possible). The two input fragments actually are an abstraction due to the algorithm’s internal methodology, so e.g. if the user wishes to look for duplications inside a single DNA fragment the two fragments A and B will be identical. Similarly, if the user wishes to look for reversed and/or complemented duplications, ASGART will proceed as if the two input fragments were the input fragment and its reversed and/or complemented self, though it is only using a single FASTA file.
The first step of ASGART requires a data structure that performs a fast search for exactly matching strings while keeping space and time complexity requirements as low as possible to allow the processing of whole genomes. To this end, we use the suffix array, a derivative of the suffix tree offering a fast search of any substring of a string in a time and O(n) construction time and space complexity. Unlike a suffix tree, a suffix array is a simple array of integers and is a cache-friendly structure offering fast access. A suffix array contains the starting position of each of the suffixes of a given string, sorted lexicographically. Therefore, looking for a string resolves to a simple binary search over this array to obtain the starting indices of the matching substrings. At this point, a suffix array of B is created.
2.2 Clustering and gathering
The gathering of high similarity zones and their subsequent clustering in SD is the heart of ASGART. From a suffix array of B, a finite state automaton will scan A, store and merge identical k-mers among the two fragments, and position and cluster them in proto-SD according to the probing size and the maximal gap length provided by the user. The automaton contains four states: Sweep, Expand, Sparse Grow and Filter. Please remark that for purposes of clarity, the pseudo-code illustrating each of these states doesn’t include DNA strands length checks and other constraints.
2.2.1 Sweep
In the Sweep state, the automaton will run a cursor c along A, while probing B for k-mers psizebp long identical to the one starting from c on A. Once N > 0 substrings matching are found, this set of matches smatch is stored and the automaton switches to the Expand state. Otherwise, the exploration pursues by increasing the cursor’s value until either finding matches or reaching the end of the fragment. This state corresponds to the search for the first matching portions of a duplication’s repeated units.
probing_kmer ← next_probing_kmer()
matches ← search_for(probing_mker, B)
if matches not empty then
GoTo Grow
else
StayIn Sweep
end if
2.2.2 Expand
In the Expand state, the automaton expands a potential proto-SD. The cursor c skims along A while the distance dSS between the set of the matches in B of the probing k-mer and the current set of matches smatch is smaller than gsize. Found matches are successively merged in smatch. When there are no more matches of the current probing k-mer on B, or if the distance dSS to the current set of matches is greater than gsize, the automaton switches to the Sparse Grow state. If the end of A is reached, the automaton switches to the Filter state. This state is dedicated to gathering either exactly matching portions of future duplications or handling deletions in the repeated units on B.
probing_kmer ← next_probing_kmer()
new_matches ← search_for(probing_kmer, B)
if dSS(matches, new_matches) <= MAX_GAP_SIZE then
matches ← merge_matches(matches, new_matches)
StayIn Expand
else
GoTo SparseGrow
end if
2.2.3 Sparse grow
The Sparse Grow state is reached when the current set of matches is not immediately expandable. The automaton will browse cursor c along A until a non-empty set of matches for the current probing k-mer is found on B. If the distance dSS between the matches of the probing k-mer and the current set of matches is smaller than gsize, the sets are merged and the automaton switches back to the Expand state. The automaton switches to the Filter state if the distance exceeds gsize or when the end of A is reached, i.e. . The sparse grow state also handles deletions in the repeated units on A.
probing_kmer ← next_probing_kmer()
gap_size ← gap_size + 1
if gap > MAX_GAP_SIZE then
GoTo Filter
else
new_matches ← search_for(probing_kmer, B)
ifdSS(matches, new_matches) <= MAX_GAP_SIZE then
matches ← merge_matches(matches, new_matches)
GoTo Expand
else
StayIn SparseGrow
end if
end if
2.2.4 Filter
In the Filter state, ASGART extracts a substring of fragment A and a corresponding set of matching segments of fragment B. These data are merged, filtered to ensure they satisfy the minimal length constraint set by the user, and split into multiple two-armed proto-SD as described previously. The automaton then switches back to the Sweep state if it didn’t yet reached A’s end.
proto_sds ← filter(collect_and_cut_in_pair(matches))
GoTo Sweep
2.3 Implementation
ASGART was developed using the Rust language. Rust is a recent general-purpose compiled language developed with the support of the Mozilla Foundation. It is designed as a compiled, low-level language and is currently used, among others, in the development of the Mozilla Firefox web browser. Its main advantages with regards to this project are:
running speed and memory usage comparable to C or C++ due to the use of the LLVM compiler backend, which is also used by the clang C/C++ compiler;
a strong type system;
a powerful error handling system;
memory safety is statically enforced and guaranteed by the compiler, removing the need for a garbage collector and, therefore, offering better runtime performance with the same ease of development;
the absence of data-races in multithreaded environments is enforced by the compiler, facilitating the implementation of parallelization;
easy interfacing with libraries through the C ABI;
a well-furnished standard library offering high-level zero-cost abstractions.
Rust was chosen after the development of an initial prototype in C++ due to the guarantees Rust offers in regard to memory- and thread-safety, while ensuring a C++-par runtime speed. After the translation of our first prototype from C++ to Rust, the compiler found several places in the program likely to cause issues (e.g. data-race conditions, unsafe memory usage, faulty memory management) that eluded us during development. With regard to speed, the mean relative difference never exceeded a few tenth percentage points to the advantage of one or the other, depending on the dataset, without a discernible pattern.
2.4 Use and outputs
There are two ways to use ASGART. One is to use the command line interface (available on Windows, macOS, GNU/Linux and FreeBSD), which should be favored for scripting, batch processing or heavy workloads. The alternative is a web-interface wrapping ASGART with a job-dispatching queue system and an online result viewer: this version is freely available, allowing users easier access and simplifying the sharing of computing servers. The collected regions can be exported in JSON, GFF2 and GFF3 formats, allowing easy parsing and reuse of the results in other applications. GFF2 and GFF3 formats are a standard for genome browser programs, allowing a simple interface with standard tools. ASGART also includes a tool to plot graphs of duplications as chord or linear graphs in the SVG format for a quick and easy visualization method.
3 Results
ASGART is a tool designed to detect large duplications among or between assembled sequences up to genomic scale which features a nearly linearly parallelizable and distributable core algorithm, allowing for the easy dispatching of heavy workloads among multiple CPUs or computers. The program relies on a suffix array index to locate identical zones between one or two DNA sequences that are then extended by a finite-state automaton while guaranteeing that the Levenshtein distance remains over a threshold set by the user. The particularities of ASGART compared to other software using the same core concepts [e.g. YASS (Noé and Kucherov, 2005) or LAST] are: (i) the ability to expand multiple-armed duplications instead of only the two most similar portions; (ii) the ability to dispatch work on multiple CPUs and machines, allowing the analysis of large sequences in a reduced amount of time; and (iii) reduced overall CPU and memory usage.
We validated and benchmarked the efficiency of our program with a twofold method, first on artificially generated FASTA sequences, then on actual data from reference genomes. The validation of ASGART and the comparative study of software performance are run on a 20-core computer server equipped with an Intel bi-Xeon E–2600@2.60 GHz with 32 GB of RAM. Full genome analyses were run on the CALMIP supercomputer, composed of 612 nodes, each of which embeds two 10-cores Intel Xeon E5–2680@2.80 GHz and 64 GB of RAM. Only 20 of these 612 nodes were used simultaneously in this study, equivalent to 400 physical cores.
3.1 Algorithm validation
To validate our algorithm, we built artificial DNA with a segmental duplication generator—which pseudocode is available in Supplementary Material—that can spawn fragments of various sizes (from 1000 to 100 000 bp) harboring 1 to 5 segmental duplications; the lengths of these duplications vary between 1000 and 20 000 bp and include random errors (substitutions and/or indels) resulting in an identity rate varying from 90 to 100%.
With this generator, we spawned 10 000 DNA fragments harboring perfectly known duplications. We analyzed these fragments using ASGART, MUMmer and LAST. Figure 3 shows the error distributions for detected segmental duplications. Each bar represents the percentage of occurrences of error ranges in bases, i.e. the first bin represents the percentage of duplications for each of the programs for which from zero to four base pairs are shifted in the detected duplication with regard to the actual duplication. MUMmer slightly outperforms both ASGART and LAST in precision on the error detection exercise. MUMmer obtained the best precision score, with 36% of tests leading to errors ranging in only 0–4 bp shifts. ASGART and LAST are comparable in terms of quality detection, with most of the detected errors resulting in a less than 40 bp shift. These results confirm the capacity of our algorithm to precisely detect SDs.
![Error distributions of the three algorithms studied on generated DNA fragments. Although MUMMER is the most precise for extremely small errors, ASGART and LAST quickly catch up if considering the [0; 25] bp error range, hence ensuring a globally satisfying quality of the result](https://oup.silverchair-cdn.com/oup/backfile/Content_public/Journal/bioinformatics/34/16/10.1093_bioinformatics_bty172/2/m_bioinformatics_34_16_2708_f4.jpeg?Expires=1716399678&Signature=XzT1oHcd9YYiUwlBk7-a67g~uZWvrdvKKO~IfNiSXZIM0B59sIdoMs9KisGFH4neZIme~oC8ebGyGEpiFF5NXT0~ny~Mh6TkImcqdEWsbsnDw75FkFCpGoyJG9sf0bJLX~A34EimQIz3SWIfzxmLfOls-kl6Bd~Gs0~FhL-L8CYx7~lO9rKQhCMq3tIub8Gc9~T0uGQii3EnFe3J-3Ct0HSQyvZhzUjqZgIbjlF7~vF61GECcr3xqgvwCUmsbaDh~KKxyAStSKpA6qYQkETg0kRCFGMJroFw6hlhTZkHK5a9MpZRvlOGExi-V8jVFHOY8ZgYPRGrL6FIgI9hnhkFuw__&Key-Pair-Id=APKAIE5G5CRDK6RD3PGA)
Error distributions of the three algorithms studied on generated DNA fragments. Although MUMMER is the most precise for extremely small errors, ASGART and LAST quickly catch up if considering the [0; 25] bp error range, hence ensuring a globally satisfying quality of the result
3.2 Algorithmic performances and comparative analyses on a chromosome panel
We have compared the performances of ASGART, MUMmer and LAST based on memory and CPU time usage on five model organisms: Homo sapiens, Mus musculus, Danio rerio, Drosophila melanogaster and Arabidopsis thaliana, for which we used assembled chromosome sequences from the NCBI. We have chosen three chromosomes per organism plus the Y chromosome, when available, on which to compare their respective performances. We have run these programs on three autosomes to test the effect of relative size and on the Y-chromosome due to its known high density of SDs. All algorithms, including ASGART, were run sequentially on only one core in order to ensure a fair comparison with programs not supporting parallelization. Table 1 shows the results of this comparative study: ASGART systematically outperforms both MUMmer and LAST in CPU usage. More importantly, ASGART consistently uses less memory to scan all of the tested chromosomes in comparison to the other programs, which guarantees its ability to successfully process larger DNA fragments on equivalent machines.
Performance comparison of CPU time and memory usage of ASGART, LAST and MUMmer on chromosomes of various sizes and from different species—OoM means Out of Memory, bold values indicate the best performances
| Species | Chr. | Size (Mb) | Linear CPU Time (s) | Memory usage (GB) | ||||
|---|---|---|---|---|---|---|---|---|
| ASGART | LAST | MUMmer | ASGART | LAST | MUMmer | |||
| Homo sapiens (GRCh38) | chr1 | 241 | 2360 | 12 996 | OoM | 1.6 | 9.8 | OoM |
| chr10 | 130 | 953 | 6320 | OoM | 1.6 | 4.9 | OoM | |
| chr21 | 46 | 223 | 1528 | 67 778 | 0.52 | 1.3 | 12 | |
| chrY | 56 | 35 | 1101 | 14 205 | 0.61 | 1.1 | 3.6 | |
| Mus musculus (GRCm38) | chr1 | 190 | 2728 | 6920 | OoM | 2.3 | 3.35 | OoM |
| chr7 | 141 | 1089 | 4807 | OoM | 1.8 | 3.35 | OoM | |
| chr19 | 60 | 146 | 1087 | OoM | 0.8 | 1.01 | OoM | |
| chrY | 89 | 604 | 4932 | OoM | 1.1 | 1.82 | OoM | |
| Danio rerio | chr4 | 76 | 353 | 2050 | OoM | 0.9 | 3.7 | OoM |
| chr17 | 53 | 688 | 1360 | OoM | 0.67 | 3.3 | OoM | |
| chr22 | 39 | 694 | 760 | OoM | 0.5 | 1.9 | OoM | |
| Drosophilia melanogaster | chr3 | 32 | 75 | 11113 | 423 | 0.37 | 1.9 | 4.9 |
| chr2 | 25 | 44 | 489 | 115 | 0.29 | 0.43 | 9.5 | |
| chr4 | 1.4 | 0.95 | 19 | 6.4 | 0.042 | 0.88 | 1.3 | |
| chrY | 3.6 | 2.6 | 195 | 23.4 | 0.064 | 0.2 | 35 | |
| Arabidopsis thaliana | chr1 | 30 | 22.5 | 163 | 2173 | 0.3 | 0.5 | 0.3 |
| chr2 | 20 | 12.7 | 76 | 317 | 0.2 | 0.33 | 0.27 | |
| chr4 | 19 | 16.5 | 90 | 622 | 0.22 | 0.3 | 0.25 | |
3.3 Mapping SDs in full genomes
ASGART has also been run on the full genomic sequences of five model organisms, for which we have deliberately chosen to include centromeric regions, thereby providing an exhaustive distribution of duplicated areas. We could not compare the performance of ASGART with MUMmer or LAST on full genome analyses, because these analyses would exhaust the available memory for MUMmer and LAST for the three largest genomes tested (i.e. Homo sapiens, Mus musculus and Danio rerio). ASGART was able to map SDs in all genomes in a very competitive timeframe: Table 2 shows a numerical analysis of SD mapping with and without prior repeat masking using Red (Girgis, 2015) to estimate the proportion of simple repeats in the SDs detected. The human genome required 371 h of linear CPU time to complete, which is equivalent to approximately 18 h on a 20-cores computing server. Small genomes in the order of hundreds of megabases, such as Arabidopsis thaliana or Drosophila melanogaster, can be processed on personal computers in a few dozen seconds.
Characteristics of segmental duplications detected in the five model organisms studied
| Species | Homo sap. (GRCh38.p7) | Mus musculus | Danio rerio | Droso. mel. | Arabid. thaliana |
|---|---|---|---|---|---|
| Analyzed Genome Size | 2.9 GB | 2.7 GB | 1.4 GB | 85 MB | 119 MB |
| Chromosome (2N) | 23 | 20 | 25 | 4 | 5 |
| Sequential CPU time | 371 h | 263 h | 311 h | 241 s | 481 s |
| Elapsed time on 400 cores | 1 h 55 m | 2 h 07 m | 1 h 03 m | 26 s | 40 s |
| Peak memory usage | 9 GB | 8 GB | 4 GB | 1 GB | 1.4 GB |
| No repeat masking | |||||
| Intra-chr (Mean(stdev)) | 5.69(2.92) | 10.13(19.5) | 4.75(5.72) | 6.81(2.19) | 1.97(0.79) |
| Inter-chr (Mean(stdev)) | 4.09(2.75) | 5.39(1.13) | 7.36(1.79) | 4.98(1.13) | 1.78(0.13) |
| SD (All, in Mbp) | 187 | 265 | 115.8 | 5.4 | 2.98 |
| SD (>20 kbp, in Mbp) | 70.8 | 70.5 | 2.78 | 0.28 | 0.29 |
| SD (% genome) | 6.5 | 9.8 | 8.64 | 6.32 | 2.5 |
| With repeat masking using Red | |||||
| Intra-chr (Mean(stdev)) | 0.85(1.04) | 0.3(0.25) | 0.33(0.21) | 0.29(0.21) | 0.15(0.08) |
| Inter-chr (Mean(stdev)) | 0.25(0.4) | 0.08(0.02) | 0.27(0.07) | 0.12(0.12) | 0.11(0.02) |
| SD (All, in Mbp) | 16.8 | 6.39 | 5.4 | 0.196 | 0.194 |
| SD (>20 kbp, in Mbp) | 2.7 | 0.66 | 0.64 | 0.03 | 0 |
| SD (% genome) | 0.6 | 0.24 | 0.41 | 0.23 | 0.16 |
3.4 SD distribution: less than 10% of all genomes and a high prevalence of direct rather than palindromic SDs
SDs represent less than 10% of all genomes tested, with a minimum of approximately 2.5% observed in Arabidopsis thaliana and up to 8.65% of the Mus musculus genome. The human genome harbors approximately 5.85% SDs, as was estimated in a previous study (Samonte and Eichler, 2002). The intrachromosomal SD density is generally higher than the interchromosomal density (Samonte and Eichler, 2002), and the proportion of direct SDs exceeds the proportion of palindromic SDs for all genomes. A chord graph (a) representing the whole-genome SD content of the human genome is shown in Figure 4 (only SDs longer than 10 kbp are plotted for clarity) and a linear representation (b) of the human Y chromosome is shown to illustrate its large palindromic structures, as reported previously (Skaletsky et al., 2003). Chord graphs for the four other organisms are provided in Supplementary Figures S1–S4.
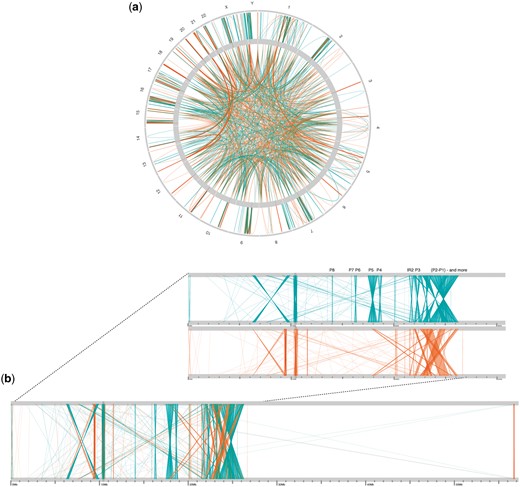
Chord graph showing the SD content of the human genome (a) and linear representations showing global intra-chromosomal SDs for the human Y chromosome and a zoomed-in view of its first 30 Mbp (b): in teal: palindromic repeats; in orange: direct repeats and identified Y palindromes from Skaletsky et al. (2003) (noted as P3: P8)
4 Discussion
In this paper, we presented a new tool, ASGART, which aims to precisely localize highly identical regions between arbitrary DNA strands. We ensured detection quality through benchmarking, while noting the performance gains our tool offers with respect to similar programs that are currently available. We have tested ASGART on five model organisms to evaluate the effects of genome size and repeat content on its performance. ASGART was able to process whole genomes while ensuring nearly linear scaling both in memory consumption and parallelism increase in speed, outperforming all existing software. The estimates of intra-chromosomal, inter-chromosomal and whole-genome SD content obtained using ASGART are compatible with those previously published for all of the organisms studied, thereby providing validation in addition to benchmarking for our program. ASGART’s parameters (k-mer length, max number of family members, etc.) can be set for fitting the problem at hand. ASGART has the potential to provide rapid screening of future de novo sequenced genomes in combination with new NGS technologies. Future developments to improve our tool will include two aims: (i) the current code should be improved by using SIMD instruction sets (e.g. AVX and SSE) to improve performance on modern x86 CPUs; (ii) portions of ASGART can be ported to GPGPU, making ASGART faster on desktop machines with cheap and massively parallel cards. Finally, a graphical user interface should be added to ASGART to improve its ease of use and user experience.
Acknowledgements
This work was performed using HPC resources from CALMIP (grant P1434). We thank the three reviewers for their helpful comments.
Conflict of Interest: none declared.
References

