


Abstract
Thousands of risk variants underlying complex phenotypes (quantitative traits and diseases) have been identified in genome-wide association studies (GWAS). However, there are still two major challenges towards deepening our understanding of the genetic architectures of complex phenotypes. First, the majority of GWAS hits are in non-coding region and their biological interpretation is still unclear. Second, accumulating evidence from GWAS suggests the polygenicity of complex traits, i.e. a complex trait is often affected by many variants with small or moderate effects, whereas a large proportion of risk variants with small effects remain unknown.
The availability of functional annotation data enables us to address the above challenges. In this study, we propose a latent sparse mixed model (LSMM) to integrate functional annotations with GWAS data. Not only does it increase the statistical power of identifying risk variants, but also offers more biological insights by detecting relevant functional annotations. To allow LSMM scalable to millions of variants and hundreds of functional annotations, we developed an efficient variational expectation-maximization algorithm for model parameter estimation and statistical inference. We first conducted comprehensive simulation studies to evaluate the performance of LSMM. Then we applied it to analyze 30 GWAS of complex phenotypes integrated with nine genic category annotations and 127 cell-type specific functional annotations from the Roadmap project. The results demonstrate that our method possesses more statistical power than conventional methods, and can help researchers achieve deeper understanding of genetic architecture of these complex phenotypes.
The LSMM software is available at https://github.com/mingjingsi/LSMM.
Supplementary data are available at Bioinformatics online.
1 Introduction
Since the success of the first GWAS on age-related macular degeneration (Klein et al., 2005), >40 000 single-nucleotide polymorphisms (SNPs) have been reported in about 3300 GWAS at the genome-wide significance level (see GWAS Catalog http://www.ebi.ac.uk/gwas/) (Welter et al., 2014). Despite these fruitful discoveries, the emerging evidence from GWAS presents great challenges towards deeper understanding of the genetic architectures of complex phenotypes. First, >85% genome-wide significant hits are located in the non-coding region (Welter et al., 2014) and most of their functional roles are still elusive. Second, complex phenotypes are often highly polygenic, i.e. they are affected by a vast number of risk variants with individually small effects. For example, it is widely accepted that 70–80% of the variation in human height can be attributed to genetics (Visscher et al., 2008). However, Wood et al. (2014) collected >250 000 samples and identified 697 variants at genome-wide significance level, and all these variants together can only explain 20% of heritability. A recent estimate (Boyle et al., 2017) suggests that about 100 000 variants may be associated with human height. Given current sample sizes, a large proportion of risk variants underlying complex phenotypes remain unknown yet.
Fortunately, an increasing number of reports suggest that the functional importance of SNPs may not be equal (Schork et al., 2013), which provides a direction to address the above challenges. On the one hand, SNPs in or near genic regions can explain more heritability of complex phenotypes (Smith et al., 2011; Yang et al., 2011). For example, the partition of genic category annotations for SNPs has revealed that SNPs in 5′ UTR, exon and 3′ UTR are significantly enriched across diverse complex traits (Schork et al., 2013). On the other hand, cell-type specific functional annotations can provide information that is complementary to genic category annotations, for dissecting genetic contribution to complex diseases in a cell-type specific manner. To name a few, genetic variants related to functions of immune cells are significantly enriched for immune diseases, such as rheumatoid arthritis, coeliac disease and type 1 diabetes; variants with liver functions are enriched for metabolic traits, such as LDL, HDL and total cholesterol; variants with pancreatic islet functions are enriched for fasting glucose (Kundaje et al., 2015). Additionally, SNPs in genes that are preferentially expressed in the central nervous system are significantly enriched in psychiatric disorders (e.g. schizophrenia and bipolar disorder) (Chung et al., 2014).
A large amount of functional annotation data has become publicly available and the volume is still expanding. The Encyclopedia of DNA Elements (ENCODE) project (The ENCODE Project Consortium, 2012) has conducted >1650 experiments on 147 cell lines to delineate functional elements across the human genome, such as DNase I hypersensitive sites and transcription factor binding. The NIH Roadmap Epigenomics Mapping Consortium (Kundaje et al., 2015) is generating high-quality genome-wide human epigenomic maps of histone modifications, chromatin accessibility, DNA methylation and mRNA expression across more than one hundred of human cell types and tissues.
With the availability of rich functional annotations, we aim to (i) integrate genic category annotations and cell-type specific functional annotations with GWAS to increase the statistical power of identifying risk SNPs, and (ii) detect relevant cell-type specific functional annotations among a large amount of available annotation data to have a more biologically insightful interpretation of GWAS results. Statistical methods to incorporate functional annotations with GWAS can be roughly divided into two categories: methods based on individual-level genotype data, e.g. bfGWAS (Yang et al., 2017) and FST (He et al., 2017), and methods based on summary statistics. In practice, the access to the individual-level data of a large sample size is often very difficult. Therefore, methods in the second category play the major role and also have computational advantages. However, existing methods based on summary statistics, e.g. stratified FDR methods (Schork et al., 2013), cmfdr (Zablocki et al., 2014), GPA (Chung et al., 2014), GenoWAP (Lu et al., 2016) and EPS (Liu et al., 2016), were designed to handle only a few number of functional annotations and can not be scalable to a large-scale integrative analysis.
In this study, we propose a latent sparse mixed model (LSMM) to integrate genic category annotations and cell-type specific functional annotations with GWAS data. The ‘latent’ statuses are used to connect the observed summary statistics from GWAS with functional annotations. ‘Mixed’ models are designed to simultaneously consider both genic category and cell-type specific annotations, where genic category annotations are put into the design matrix of fixed effects, and cell-type specific annotations are encoded in the design matrix of random effects. We further impose a ‘sparse’ structure on the random effects to adaptively select relevant cell-type specific annotations. We first conducted comprehensive simulations to investigate the properties of LSMM and then applied LSMM to real data. We integrated summary statistics from 30 GWAS with nine genic category annotations and 127 cell-type specific functional annotations from the Roadmap project. Compared with existing methods, our method is able to increase the statistical power in the identification of risk variants and detection of cell-type specific functional annotations, and thus provides a deeper understanding of genetic architecture of complex phenotypes.
2 Latent sparse mixed model
2.1 Model
Now we partition functional annotations into two categories: genic category annotations and cell-type specific annotations. According to (Schork et al., 2013), genomic regions, such as exon, intron, 5′UTR and 3′UTR, are considered as genic category annotations. For cell-type specific annotations, we used epigenetic markers (H3k4me1, H3k4me3, H3k36me3, H3k27me3, H3k9me3, H3k27ac, H3k9ac and DNase I Hypersensitivity) of multiple tissues from the Roadmap project. As we are more interested in the detection of cell-type specific results, we put genic category annotation data into Z and cell-type specific annotation data into A, where each column of Z corresponds to a genic functional category and each column of A corresponds to a cell-type specific functional category. In the simplest case, the entries in Z and A are binary. For example, Zjl = 1 means that the j-th SNP has a function in the l-th genic category and Zjl = 0 otherwise. Our model also allows the entries in Z and A to be continuous variables, e.g. a score Zjl between 0 and 1 can be used to indicate the degree that the j-the SNP has a function in the l-th category. The closer to 1, the more likely it has a functional role. The entries in A are defined in the same way as those of Z.
2.2 Algorithm
Exact evaluation of posterior (7) is intractable. One difficulty is due to the sigmoid function resulting from the logistic model. The other comes from the spike-slab prior. To address this issue, we propose a variational expectation-maximization (EM) algorithm for parameter estimation and posterior approximation.
It is worth noting that LSMM covers two special cases: (i) Two-groups model only (denoted as TGM) when all the coefficients in b (except the intercept term) and are zero; (ii) Two-groups model plus fixed effects model only (denoted as LFM for the abbreviation of latent fixed effect model) when all coefficients in are zero. This motivates us developing a four-stage algorithm based on warm starts. More specifically, in the first stage, we run an EM algorithm to obtain the two parameters (α and the proportion of non-null group π1) in the TGM. Then we use the estimated parameters as the starting point to run the second stage variational EM algorithm to fit the LFM and obtain the parameter α, b and the posterior probability of . In the third stage, we treat the obtained posterior as the value of and fit the logistic sparse mixed model to obtain the required initial value for the parameters in the next stage. Finally, in the fourth stage, we run the above variational EM algorithm with the obtained parameters at the second and third stage until convergence. Since all the iterations are built upon the framework of EM algorithm, the lower bound is guaranteed to increase at each iteration. The details of the algorithm design are provided in Supplementary Section S2.
2.3 Identification of risk SNPs and detection of relevant cell-type specific functional annotations
After the convergence of the variational EM algorithm, the approximated posterior of latent variables and can be obtained. Using this information, we are able to prioritize risk SNPs and relevant cell-type specific functional annotations.
Relevant cell-type specific functional annotations are inferred from , an approximation of the posterior probability that annotation k is relevant to this phenotype. Similarly, we can calculate the approximated local false discovery rate and convert it into the global false discovery rate. We can either control the local false discovery rate (e.g. ) or global false discovery rate with .
3 Results
3.1 Simulation
We conducted simulations to evaluate the performance of the proposed LSMM. The simulation data was generated as follows. The numbers of SNPs, fixed effects (genic category annotations) and random effects (cell-type specific functional annotations) were set to be M = 100 000, L = 10 and K = 500 respectively. The entries in design matrices Zjl and Ajk were generated from and . Given the proportion of relevant cell-type specific functional annotations ω, ηk was drawn from and the corresponding nonzero entries of random effects were simulated from . The first entry of the coefficients of fixed effects b, i.e. the intercept in the logistic model, was fixed at –2 and other entries were generated from and then kept fixed in multiple replications. After that, we simulated γj from Bernoulli distribution with probability , and then generated pj from if and otherwise.
We first evaluated the performance of LSMM in the identification of risk SNPs. We compared LSMM with two special cases, LFM (with fixed effects only) and TGM (without fixed effects and random effects). After prioritizing the risk SNPs using these methods, we made a comparison upon their empirical FDR, power, area under the receiver operating characteristic curve (AUC) and partial AUC. We varied the proportion of relevant random effects ω at . Figure 1 shows the performance of these three models with and K = 500 (results for other scenarios are shown in Supplementary Figs S1–S8). As shown in Figure 1, the empirical FDRs are indeed controlled at the nominal level () for all these models. For TGM and LFM, the powers increase as the proportion of relevant functional annotations ω increases. This is because a larger ω could result in an increasing proportion of non-null group for SNPs. However, the AUC and partial AUC of LFM slightly decrease because the estimates of fixed effects using LFM would become less accurate when the impact of functional annotations becomes larger. LSMM can adaptively select relevant functional annotations to improve its performance. As expected, it outperforms both TGM and LFM in terms of the power, AUC and partial AUC. One may wonder what if we do not do variable selection and simply treat the effects of all covariates as fixed effects. We evaluated this approach and found that, without variable selection, the FDR would be inflated when the GWAS signal is relatively weak (see Supplementary Fig. S9).
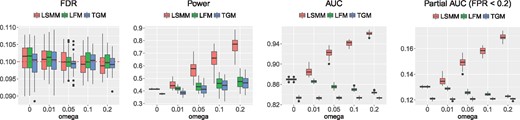
FDR, power, AUC and partial AUC of LSMM, LFM and TGM for identification of risk SNPs with and K = 500. We controlled global FDR at 0.1 to evaluate empirical FDR and power. The results are summarized from 50 replications
Next, we evaluated the performance of LSMM in the detection of relevant cell-type specific functional annotations in terms of the FDR, power, AUC and partial AUC. We varied the proportion of relevant cell-type specific functional annotations ω at . The results are given in Figure 2 with and K = 500 (results for other scenarios are shown in Supplementary Figs S10–S17). The empirical FDR is controlled at 0.1 with conservativeness. This is because the variational approach is adopted to approximate the posterior, e.g. the JJ bound and mean-field approximation. When the signal of the GWAS data is relatively strong, i.e. α is relatively small, LSMM has a very good performance of detecting relevant functional annotations, as indicated by power, AUC and partial AUC. When the number of SNPs becomes larger (e.g. M = 500 000), for a fixed signal strength, the empirical FDR becomes less conservative and the performance becomes better (see Supplementary Figs S18–S20). Simulations (details are given in Supplementary Section S3.5) also show that when the annotations integrated are of greater importance, the performance of LSMM becomes better, especially when the number of SNPs is small (see Supplementary Figs S21–S22). Therefore, the performance of LSMM in the detection of relevant annotations is influenced by the signal strength of the GWAS data, the number of SNPs and the importance of annotations. We also conducted the following simulations to examine the role of adjusting covariates (i.e. genic category annotations) using fixed effects for detecting relevant cell-type specific annotations. We consider the case that genic category annotations and some cell-type specific annotations are correlated and b, the vector of coefficients corresponding to genic category annotations, is nonzero. Without adjusting genic category annotations, some irrelevant cell-type specific annotations will be falsely included in the model due to their correlation with genic category annotations. To verify this, we simulated a case that 10 genic category annotations and first 50 cell-type specific annotations are correlated with correlation coefficient varied at and the remaining annotations are generated independently. The simulation details are given in Supplemenatry Section S3.6. In the presence of correlation, as expected, a larger FDR of detecting relevant cell-type specific annotations is observed without adjusting genic category annotations (see Supplementary Fig. S23).
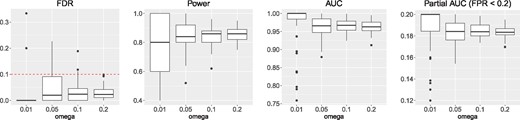
FDR, power, AUC and partial AUC of LSMM for detection of relevant annotations with and K = 500. We controlled global FDR at 0.1 to evaluate empirical FDR and power. The results are summarized from 50 replications
LSMM is not sensitive to initial parameter specification except when the true proportion of risk SNPs is extremely small and the signal of GWAS data is very weak (details of simulation and results are given in Supplementary Section S3.7 and Supplementary Fig. S24). Regarding parameter estimation, LSMM provides a satisfactory estimate of α, the parameter in Beta distribution (see Supplementary Figs S25–S27). When the signal strength of GWAS data is not very weak, the estimated fixed effects b (Supplementary Figs S28–S38) and the proportion of non-zero random effects ω (Supplementary Fig. S39) are relatively accurate. When we generate P-values for SNPs from individual-level data instead of the generative model (1), we note that the value of α is determined by both heritability and sample size of individual-level data (details of simulation and results are given in Supplementary Section S3.9 and Supplementary Fig. S40). Given fixed sample sizes and nonzero proportion, smaller α corresponds to larger heritability.
The computational time of LSMM depends on the strength of GWAS signal, the number of SNPs and the number of random effects. Figure 3 (left) shows that the computational time is nearly linear with respect to M and K with . In the right panel, we fixed M = 100 000 and varied K and α. When the GWAS signal is relatively weak, e.g. , the timings of LSMM remain the same for different scales of random effects. This is because LSMM adopts a warm-start strategy and its last two stages start from the estimates at the second stage (i.e. fixed effects only) and converge in a few iterations when the GWAS signal is too weak to provide information for updating the random effects.
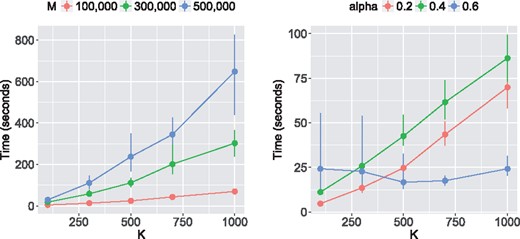
Computational time of LSMM. Left: We varied the number of SNPs M and the number of random effects K, with . Right: We varied the number of random effects K and the strength of GWAS signal α with M = 100 000. The results are summarized from 10 replications
Then we conducted simulations to test the robustness of LSMM under the situation that some assumptions in our proposed model are violated.
LSMM assumes that the P-values of non-null SNPs follow the Beta distribution. Here we simulated the underlying distribution of P-values in non-null group from other distributions. The experimental results (Supplementary Figs S41–S43) indicate that the FDR of LSMM is still well controlled at the nominal level.
We assume independence among SNPs, which greatly facilitates the computation and inference of LSMM. We conducted simulation (details are given in Supplemenatry Section S3.11) to evaluate the impact of this assumption on LSMM. Because GWAS only aim to identify the local genomic region in LD with true risk genetic variants, it is reasonable to consider the identified SNPs not as false positives if they are in the flanking region of the true risk SNPs. In this sense, the results (Supplementary Fig. S44) suggest that LSMM can provide a satisfactory FDR control.
We assume the proportion of risk variants is not very small due to the polygenic effect in the context of GWAS. In the simulation, we used the TGM to generate data such that we can evaluate whether the estimates converge to their true values. We varied the true value of the proportion of risk SNPs . We also used Higher Criticism to estimate the proportion of non-null effects as a comparison. The results (Supplementary Fig. S45) show that when the true proportion of risk SNPs is extremely small (e.g. for ) and the signal of GWAS data is weak (e.g. for ), the estimation using LSMM is not very accurate. However, LSMM can still provide a valid FDR control. The performance of Higher Criticism is quite opposite. Although it can provide stable estimation when the true proportion of risk SNPs is small (), its performance is not as well as LSMM when π1 is relatively large, e.g. .
- In LSMM, we use generative model (2) to integrate functional annotations. Here we conducted simulations based on probit model:(18)
where . And we set if yj > 0, if . The details of the simulation are given in Supplemenatry Section S3.13. The results are provided in Supplementary Figures S46–S51. Noting that FDRs are all well-controlled at the nominal level. LSMM shows the best performance in power, AUC and partial AUC in identification of risk SNPs, and the advantages of LSMM over LFM and TGM are more noticeable as the signal-noise ratio increases.
The correlation among random effects is ignored in LSMM. However, simulation results on correlated random effects (Supplementary Figs S52–S53) indicate the robustness of LSMM.
LSMM assumes a common variance, , for random effects. When this assumption is violated, e.g. the variance for each random effect is from , the performance of LSMM (Supplementary Figs S54–S55) is still comparable to the ideal case shown in Figures 1 and 2.
We compared LSMM with GPA in the identification of risk variants and detection of cell-type specific annotations. As LSMM can integrate both genic category and functional annotations, we compared GPA with LSMM without fixed effects (integrate functional annotations only) for a fair comparison. From the model setup, one main difference between GPA and LSMM is that GPA assumes conditional independence among annotations, whereas in LSMM we do not make this assumption. To check the influence of correlated functional annotations, we simulated a case that the first 10 functional annotations were correlated and all the others were independent. We varied the correlation among annotations at . The results are shown in Supplementary Figures S56–S59. We observe that the empirical FDRs of LSMM and LSMM without fixed effects are indeed controlled at 0.1, but the FDR of GPA inflates very much when annotations are correlated. As the FDR of GPA is not controlled, the power of GPA is not comparable to the other two models. According to the AUC and partial AUC, the performance of GPA becomes worse as the correlation among annotations increase, while the performance of LSMM is still stable and outstanding. It implies that LSMM is able to identify true relevant annotations among correlated misleading ones.
We also conducted simulations to compare LSMM with cmfdr, a fully Bayesian approach to incorporate genic category annotations in GWAS using MCMC sampling algorithm. We find that cmfdr is not able to handle a large number of annotations and the MCMC sampling algorithm is very time-consuming. Besides the computational time, we observe the empirical FDR of cmfdr is slightly inflated and its performance for prioritization of risk variants is inferior to LSMM in terms of AUC and partial AUC (see Supplementary Fig. S60).
As a comparison, we also used GenoWAP, a GWAS signal prioritization method that integrates genomic functional annotation and GWAS test statistics, to prioritize SNPs in our simulation. As GenoWAP can only integrate one annotation at a time, in the simulation we set L = 1 and let Z be the functional annotation integrated using GenoWAP. The performance of LSMM, LFM and GenoWAP for identification of risk SNPs are shown in Supplemenatry Figure S61. We observe that for GenoWAP, the empirical FDRs are very conservative and its power, AUC and pAUC are all very low. That is because the SNPs that GenoWAP detects are disease-specific functional, i.e. only SNPs which are annotated to be functional have a chance be detected. In our simulation, 90% SNPs are not functional in the annotation category and thus are not identified by GenoWAP. To evaluate the influence of the functional proportion on GenoWAP, we conducted the following simulations with no tissue-specific functional annotations. We set L = 1 and generated data from LFM. The results for different functional proportions are shown in Supplementary Figure S62. The empirical FDRs of GenoWAP are still very small. Each of the power, AUC and pAUC of GenoWAP shows an increasing trend as the functional proportion increases, indicating that the performance of GenoWAP is influenced by the quality of annotation.
3.2 Real data analysis
We applied LSMM to analyze 30 GWAS of complex phenotypes. The source of the 30 GWAS is given in Supplemenatry Table S2. We used ANNOVAR (Wang et al., 2010) to provide the genic category annotations: upstream, downstream, exonic, intergenic, intronic, ncRNA_exonic, ncRNA_intronic, UTR3 and UTR5, where ncRNA means variant overlaps a transcript without coding annotation in the gene definition. We obtained 127 cell-type specific functional annotations from GenoSkylinePlus (Lu et al., 2017) (http://genocanyon.med.yale.edu/GenoSkyline). To avoid unusually large GWAS signals in the MHC region (Chromosome 6, 25–35 Mb), we excluded the SNPs in this region.
We compared the number of identified risk SNPs using TGM, LFM and LSMM for 30 GWAS. Using LSMM as a reference, we calculated the ratio of the number of risk SNPs each method identified to that from LSMM under FDR thresholds and . The results are shown in Figure 4. For detecting the relevant cell-type specific functional annotations, we controlled the local fdr at 0.1. Figure 5 shows the approximated posterior probability for annotations and phenotypes, where the darkness of the red entry implies the level of relevance between the corresponding cell-type specific functional annotation and the phenotype, the darker the more relevant.
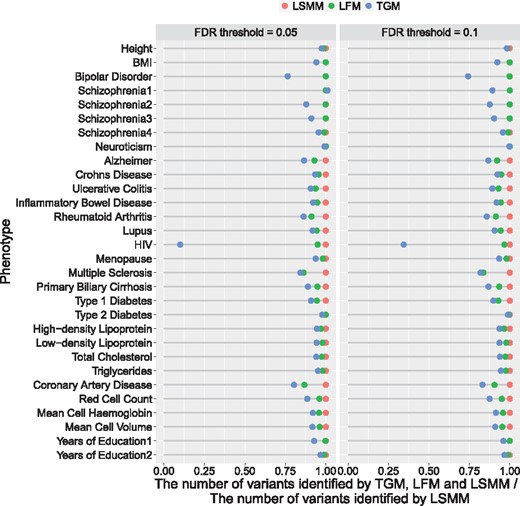
The number of risk variants identified by TGM, LFM and LSMM for 30 GWAS, under the same level of global FDR control (0.05 and 0.1). For visualization purpose, these numbers are normalized by dividing the corresponding number of variants identified by LSMM
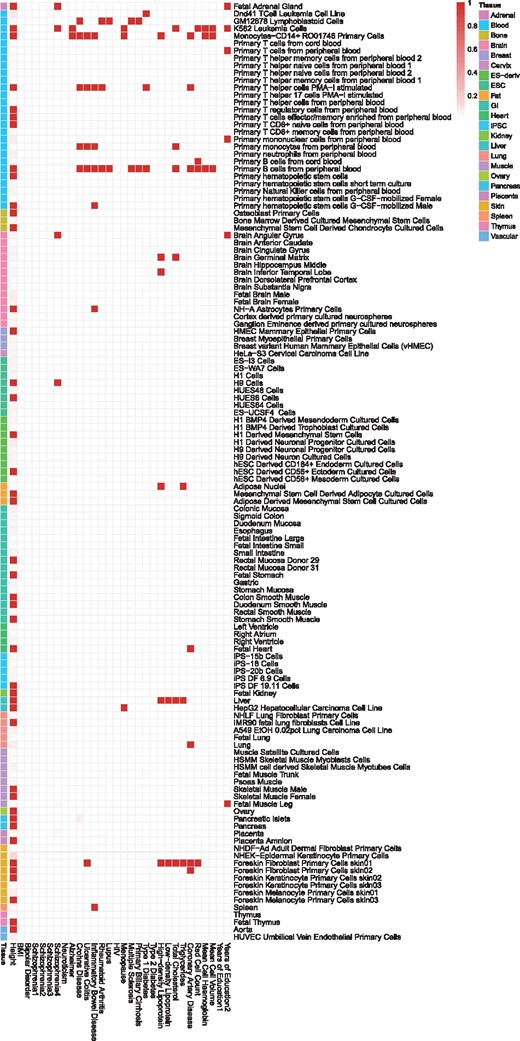
Relevant cell-type specific functional annotations for 30 GWAS
Figure 4 shows that LSMM can identify more risk variants than TGM and LFM, under the same level of FDR control. The differences between TGM and LFM are due to the impact of genic category annotations and the differences between LFM and LSMM can be attributed to cell-type specific functional annotations. For HIV (McLaren et al., 2013) and bipolar disorder (Psychiatric GWAS Consortium Bipolar Disorder Working Group, 2011), a clear improvement in the identification of risk SNPs can be found from TGM to LFM, reflecting a large enrichment of genic category annotations. The contribution of cell-type specific annotations can be clearly seen with the improvement from LFM to LSMM in several GWAS analyses, such as multiple sclerosis (Sawcer et al., 2011) and coronary artery disease (CAD) (Schunkert et al., 2011). For multiple sclerosis, genic category annotations do not show huge contributions, however, the contributions of cell-type specific annotations are substantial. As shown in Figure 5, its relevant cell-type specific annotations are related with immune system, GM12878 lymphoblastoid cells and primary B cells from peripheral blood. For CAD, both enrichment of genic category and cell-type specific annotations are estimated and its relevant cells are from a few different tissues, including blood, heart, lung and skin (see Fig. 5). As a cardiovascular disease, it is reasonable to discover the relevance of these cells to CAD, and Fernández-Ruiz (2016) has shown its relationship with immune system. The annotations in lung and skin we detected may provide some new insights about the disease.
Among the 30 GWAS, we analyzed four GWAS of schizophrenia with different sample sizes, Schizophrenia1 (9379 cases and 7736 controls) (Cross-Disorder Group of the Psychiatric Genomics Consortium, 2013), Schizophrenia2 (9394 cases and 12 462 controls) (Schizophrenia Psychiatric Genome-Wide Association Study (GWAS) Consortium, 2011), Schizophrenia3 (13 833 cases and 18 310 controls) (Ripke et al., 2013) and Schizophrenia4 (36 989 cases and 113 075 controls) (Ripke et al., 2014). The detailed results are summarized in Supplemenatry Table S3. The Manhattan plots using TGM and LSMM are provided in Supplementary Figure S63. Clearly, LSMM steadily improves over TGM and LFM in the analysis of schizophrenia, a highly polygenic trait, with different sample sizes. In particular, for Schizophrenia3, LSMM identified 1492 risk variants which could not be identified by TGM. Interestingly, the majority of them (872 variants) can be re-identified in Schizophrenia4 using TGM. This indicates that LSMM has a better power in prioritizing risk variants than TGM. For Schizophrenia4, four cell-type specific functional annotations are detected. In our analysis, both genetic variants related to functions of brain cells (brain angular gyrus) and blood cells (K562 leukemia cells) are detected to be relevant. This evidence not only connects Schizophrenia with brain, but also suggests the biological link between Schizophrenia and immune system (Ripke et al., 2014). To make a comparison, we also used GenoWAP to analyze Schizophrenia3 and Schizophrenia4 by integrating each of the nine genic category annotations. The results are shown in Supplemenatry Table S4. With the nominal local FDR controlled at 0.1, even we collected the risk SNPs identified by integrating every annotation using GenoWAP, the total number is still much less than TGM, LFM and LSMM, suggesting GenoWAP is too conservative for real data analysis. We also analyzed two GWAS of years of education, Years of Education 1 (Rietveld et al., 2013) and Years of Education 2 (Okbay et al., 2016). Compared with Years of Education 1, the GWAS dataset for Years of Education 2 is based on a larger sample size, and thus it enables LSMM to detect relevant functional annotations in brain and immune system. Our results are consistent with Finucane et al. (2015).
More findings about the relevance between cell-type specific annotations and GWAS are shown in Figure 5. Some are concordant with previous GWAS analyses. For example, we detect the functional annotation in liver to be relevant to the lipid-related phenotypes, including low-density lipoprotein, high-density lipoprotein, triglycerides and total cholesterol (Global Lipids Genetics Consortium, 2013). Similar functional enrichment has been found by Finucane et al. (2015), Kundaje et al. (2015)and Lu et al. (2017). For height (Wood et al., 2014), >40 cell-type specific functional annotations are detected to be relevant using LSMM, which reflects its highly polygenic genetic architecture. These relevant annotations include cells in bone, vascular and skeletal muscle which were also shown significant enrichments for height by Finucane et al. (2015). Recent research has linked some neurodegenerative diseases, which were believed to be more related to brain and neural system, to the immune system, such as Alzheimer’s disease (Sims et al., 2017) and Parkinson’s disease (Sulzer et al., 2017). For Alzheimer’s disease (Lambert et al., 2013), similar results have been found using LSMM. The relevant functional annotations are from blood cells, including monocytes-CD14+ and K562 leukemia cells. For autoimmune diseases including Crohn’s disease (Jostins et al., 2012), ulcerative colitis (Jostins et al., 2012), inflammatory bowel disease (Jostins et al., 2012), rheumatoid arthritis (Okada et al., 2014), lupus (Bentham et al., 2015), menopause (Day et al., 2015), multiple sclerosis (Sawcer et al., 2011) and primary biliary cirrhosis (Cordell et al., 2015), the detected relevant functional annotations are mainly from the immune system and have many overlaps. Our results also provide the genomic level supports to previous medical literature, such as the relevance between spleen and inflammatory bowel disease (Muller et al., 1993), between liver and menopause (Mucci et al., 2001). The result also provides several new insights. Lipid-related phenotypes including high-density lipoprotein and total cholesterol are also relevant to functional annotations in immune system and brain. Additionally, annotations in immune system are considered relevant to blood-related phenotypes including red cell count, mean cell haemoglobin and mean cell volume (Pickrell, 2014). The foreskin fibroblast primary cells in skin are relevant to ulcerative colitis, four lipid-related phenotypes and red cell count.
Regarding the computational time, LSMM takes <6 min to handle each of the 30 GWAS datasets. We also recorded timings of cmfdr as a comparison. As cmfdr is not scalable to a large number of covariates, we only integrated the nine genic category annotations in cmfdr. The MCMC algorithm was suggested (Zablocki et al., 2014) to run with 5000 burn-in and 20 000 main iterations. According to our estimates, cmfdr takes >10 days for most phenotypes. The detailed timing results are shown in Supplementary Figure S64.
If we did not adjust the genic category annotation, more relevant cell-type specific functional annotations would be detected (results are shown in Supplementary Fig. S65). This indicates that LSMM could adjust covariates’ effects and provide a more reliable identification of relevant functional annotations.
4 Conclusion
We have presented a statistical approach, LSMM, to integrate genic category annotations and a large amount of cell-type specific functional annotations with GWAS data. LSMM can not only improve the statistical power in the identification of risk SNPs, but also infer relevant cell-type specific functional annotations to the phenotype, offering new insights to explore the genetic architecture of complex traits or diseases. Through comprehensive simulations and real data analysis of 30 GWAS, LSMM is shown to be statistically efficient and computationally scalable. As more annotation data will become publicly available in the future, we believe LSMM is widely useful for integrative analysis of genomic data.
Funding
This work was supported in part by the National Science Funding of China [61501389]; the Hong Kong Research Grant Council [22302815, 12316116 and 12301417]; The Hong Kong University of Science and Technology [startup grant R9405]; Innovative Technology Funding of Hong Kong [ITF391/15FX (P0162)]; Duke-NUS Medical School WBS [R-913-200-098-263]; Ministry of Education, Singapore [MOE2016-T2-2-029]; Shenzhen Fundamental Research Fund [KQTD2015033114415450].
Conflict of Interest: none declared.
References

