-
PDF
- Split View
-
Views
-
Cite
Cite
Aleksandar Poleksic, Lei Xie, Predicting serious rare adverse reactions of novel chemicals, Bioinformatics, Volume 34, Issue 16, August 2018, Pages 2835–2842, https://doi.org/10.1093/bioinformatics/bty193
Close - Share Icon Share
Abstract
Adverse drug reactions (ADRs) are one of the main causes of death and a major financial burden on the world’s economy. Due to the limitations of the animal model, computational prediction of serious and rare ADRs is invaluable. However, current state-of-the-art computational methods do not yield significantly better predictions of rare ADRs than random guessing.
We present a novel method, based on the theory of ‘compressed sensing’ (CS), which can accurately predict serious side-effects of candidate and market drugs. Not only is our method able to infer new chemical-ADR associations using existing noisy, biased and incomplete databases, but our data also demonstrate that the accuracy of CS in predicting a serious ADR for a candidate drug increases with increasing knowledge of other ADRs associated with the drug. In practice, this means that as the candidate drug moves up the different stages of clinical trials, the prediction accuracy of our method will increase accordingly.
The program is available at https://github.com/poleksic/side-effects.
Supplementary data are available at Bioinformatics online.
1 Introduction
1.1 Background
Adverse drug reactions (ADRs) are one of the main burdens in modern drug discovery (Bouvy et al., 2015). Rare and serious ADRs are responsible for failed drug discovery pipelines and for drug market withdrawals. Cumulative costs of the management of ADRs have been estimated at more than 30 billion per year in the USA alone (Sultana et al., 2013). Clinical impact, including emergency department visits and prolonged hospital stay, account for a large portion of health care cost. Up to one-third of emergency visits by older adults are due to ADRs (Budnitz et al., 2007), while more than one-third of ADRs in the pediatric population are potentially life threatening (Impicciatore et al., 2001). According to a nationwide Swedish study, ADRs rank seventh among all causes of death (Wester et al., 2008). The figures from US studies are even more alarming as they place ADRs as the fourth most common cause of death, ahead of diabetes, pulmonary disease, AIDS, pneumonia, general accidents and automobile accidents (Lazarou et al., 1998).
Finding ADRs for a drug before the drug reaches the market is a difficult and an error prone task. The results of testing a chemical on animals do not always correlate to those obtained when testing the same chemical on humans. Moreover, the patient population recruited during clinical trials is small and biased and hence the data are not statistically robust. Most importantly, clinical trials fail to identify rare and serious side-effects, due to relatively small study duration.
Post marketing surveillance allows for a statistically significant patient population that is followed for a longer period of time. However, the results of post-marketing studies are mostly based on combination drugs and thus are difficult to interpret. More specifically, it is challenging to tell which drug, among multiple ones given to the patient, gives rise to the reported side-effect.
Recent years have seen development of computational approaches to predicting ADRs. Pauwels et al. (2011) and Mizutani et al. (2012) employed canonical correlation analysis (CCA) using the information about chemical substructures and drug’s protein targets. Huang et al. (2013) used the support vector machines to predict ADR profiles by integrating chemical structures with protein–protein interaction networks. Bresso et al. (2013) applied machine learning on integrated functional annotation, pathways and drug characteristics to predict and understand ADR mechanisms. Liu et al. (2012) use machine-learning to integrate drugs’ characteristics, such as indications and known ADRs, with the drug's chemical structures, known targets and pathways. Zhang et al. (2015) viewed ADR prediction as a multi-label learning (ML) and ensemble learning task. In their ML algorithm, drug features are associated with side-effects while feature dimensions represent biological components. Xiao et al. (2017) applied symbolic latent Dirichlet allocation to learn hidden topics that represents biochemical mechanism that associates drugs to ADRs.
While the advances in the area of computational ADR prediction are encouraging, the field is still at its infancy when it comes to predicting rare and serious ADRs. A harmful ADR often surfaces years or even decades after the drug has been approved. Inability to predict these events leads to complications in diseases and treatments, which can have long-term consequences and fatal outcomes. Drug pipeline failures and post-marketing drug withdrawals result in loss of effective compounds (those for which the benefit-to-harm balance is unfavorable), which in turn results in loss of revenue by the drug manufacturer. A methodology capable of predicting ADRs long before the drug reaches the market or even before the drug is withdrawn from the market would significantly enhance drug discovery and improve human health.
1.2 Compressed sensing for ADR prediction
We show that a variant of the ‘compressed sensing’ (CS) technique, namely the ‘low-rank matrix completion’ (LRMC), from the digital signal processing field, can be easily adapted and used to predict drug-ADR associations with unmatched accuracy. Originally proposed to solve problems arising in coding and data acquisition, CS has proved to be an efficient way of recovering any type of signal from few and erroneous samples (Candès, 2006; Candès et al., 2006; Donoho, 2006). In the framework of ADR prediction, the ‘signal’ can be thought of as the set of all drug-ADR associations (those already observed and those yet to be found). The ‘sample’ represents known (reported) associations, identified and stored in the existing drug-ADR databases, such as SIDER (Kuhn et al., 2010). The key observation is that the sample, defined this way, is both sparse and noisy, due to the well-known difficulty of identifying ADRs during clinical trials and post-marketing studies. Therefore, just like the problems in imaging and face recognition, or problems in optical systems research or wireless networking, the drug-ADR association prediction problem is highly amenable to ‘CS’ solution.
2 Materials and methods
2.1 Algorithm
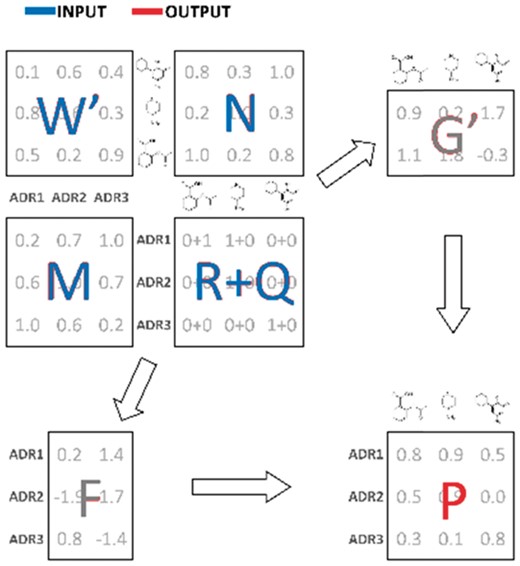
We cast drug-ADR prediction as a signal recovery problem, in which the signal represents the collection of all drug-ADR associations, i.e. those already observed and those yet to be found. The sample is a weak and sparse representation of the signal, consisting only of known (observed) drug-ADR associations, i.e. the associations stored in the existing drug-ADR association databases (in our case SIDER). Assuming that the true (recovered) matrix of drug-ADR associations is of small rank, the drug-ADR signal reconstruction becomes amenable to a variant of CS known as the ‘LRMC’. We note that the small rank assumption is reasonable since a typical ADR is only associated with the low dimensional space of chemical substructures shared by the drugs.
Algorithm flow. R: known drug-ADR associations (sample); M: pairwise ADR similarity matrix; N: pairwise drug similarity matrix; W: drug-ADR frequencies; Q: impute values; F: latent ADR preferences; G: latent drug preferences; P: output drug-ADR probabilities (recovered signal)
The first two terms in Equation (1) drive the ‘signal recovery’ (matrix completion) process, whereas the last two terms mandate that similar drugs have similar side-effects and vice versa. Although our method is capable of factoring in the drug-ADR frequency values and the drug-ADR impute values , this information is currently not been taken advantage of and and are set to 1’s and 0’s, respectively.
The matrices of latent ADR and drug preferences ( and , respectively) are found during the standard minimization procedure. For the sake of brevity, we skip technical details, but emphasize that the key idea behind our approach is to demand that and are small in one dimension. That way, the output matrix of predicted interaction probabilities (recovered signal) must be of small rank and, in turn, free of noise. An efficient optimization of the objective function (1) is achieved using a stochastic gradient descent method (Duchi et al., 2011). For more details on that method, we refer the reader to Lim et al. (2016) and the accompanying Supplementary Material.
While the pairwise drug similarity scores ( are computed using the classical Jaccard index (Rogers and Tanimoto, 1960), the notion of pairwise ADR similarity scores (along with the notion of frequencies and impute values) is unique to our method and improves the prediction accuracy. Our pairwise ADR similarity scores are defined as the average of semantic and relatedness measures (path and lesk, respectively) and are computed by running the umls-similarity software (McInnes et al., 2009) on MedDRA vocabulary (Brown et al., 1999).
An added benefit of our loss function (1) is that it allows one to take advantage of the frequencies of known drug-ADR associations and the drug-ADR impute values. Each represents the frequency at which the drug causes the side-effect , while each can be used to explicitly specify the likelihood of a drug-ADR association. To explain how the impute values can be useful in predicting drug-ADR associations, consider, for instance, an ambiguous case of a newly discovered drug-ADR association that has not yet been observed and recorded in the database (). This new knowledge can be easily incorporated into our method by setting , while adjusting the corresponding weight to account for any uncertainty in the imputed value. Unfortunately, our current experiments use neither the weight nor the impute value functionality, due to the lack of data on drug-ADR frequencies. This might change in the future, as more comprehensive databases, containing frequency information, become available.
While we have originally developed and published the analytical framework (1) for the drug–target interaction problem (Lim et al., 2016), we subsequently noticed that the CS is much more amenable to predicting ADRs. In contrast to drug–target interaction problem, where the baseline data are already clean but incomplete, the drug-ADR association data are both incomplete and noisy. CS is particularly suited to deal with such data.
We compared our approach to two recent state-of-the-art algorithms for drug-ADR association prediction: ML (Zhang et al., 2015) and CCA (Mizutani et al., 2012; Pauwels et al., 2011). In recent benchmarking studies, these two methods exhibited superior accuracy when compared to other methods for the same problem (Zhang et al., 2015). For a fair comparison, the benchmarks presented here use the same dataset and the same test protocols as in Zhang et al. (2015).
In an attempt to gain insight into the progress in the field, we also submitted to our benchmark a naïve, reference method (here called REF). This straightforward method sets the probability that a given drug will give rise to a particular ADR to the overall promiscuity of that ADR. In other words, the probability of a side-effect being associated with any drug is the same for all drugs and is set to the overall frequency of occurrence of .
2.2 Description of the methods compared
ML and CCA are conceptually different from one another and different from the method we propose. CCA attempts to find the weight vectors and that maximize the correlation between the side-effects and drugs’ chemical substructure feature vectors (Pauwels et al., 2011; Mizutani et al., 2012). To accomplish this, the algorithm uses the penalized matrix decomposition (PMD) which can be viewed as a regularized version of the singular value decomposition method. More specifically, let denotes an (incomplete) matrix of drug-ADR association and let denotes a matrix of binary fingerprints for drugs (each represented by a PubChem substructure feature vector of length ). Using the PMD technique, the CCA algorithm finds the representation (approximation) of the matrix of the form , where , and minimize the squared Frobenius norm, subject to penalties on vectors and . The more advanced variant of the CCA algorithm, which we tested here, uses the penalties (where the norm of a vector is defined as the sum of the absolute values of its coordinates), yielding a decomposition of that utilizes sparse vectors and . The recovered matrix of drug-ADR associations is computed as the matrix product . For technical details on PMD, the reader is referred to Witten et al. (2009).
and are computed from the training set.
2.3 Description of the test set and benchmarking measures
We ran several cross-validation tests on the set of all drug-ADR associations from the SIDER database. SIDER 4.1 contains drug-ADR association data for 1430 FDA approved drugs and 5868 ADRs. This data are represented as a binary matrix , whose entry is equal to 1 if the drug is known to cause ADR and 0 otherwise.
Each method submitted to our benchmarks was run using its default parameters. Consistent with the procedure in Zhang et al. (2015), we provided CS and ML with the same matrix of Tanimoto similarity scores (Rogers and Tanimoto, 1960) between pairs of drugs. In contrast to CS and ML, the CCA algorithm takes encoding of drugs’ chemical structures as input. To ensure a fair comparison, we supplied CCA with the set of PubChem fingerprints of lengths 881 (Li et al., 2010), identical to those used by the authors of the CCA algorithm.
To test the accuracy of CS in various settings, we performed multiple cross-validation experiments on different sets of selected drug-ADR pairs. In all but one experiment, we ran five rounds of 10-fold cross-validation on selected drug-ADR pairs. To assess the algorithm’s accuracy in predicting ADRs for chemicals of novel structures, we resorted to leave-one-cross-validation (LOOCV) due to technical reasons (details given in the Results section).
Our tests employ two classical performance measures, namely the area under the ROC curve (AUC) and the area under the PR curve (AUPR). The receiver operating characteristic (ROC) represents the relationship between the false-positive and the true-positive rate while the precision-recall (PR) curve represents the relationship between the sensitivity (true positive rate or recall) and the positive predictive value (precision).
3 Results
Below we show that the CS algorithm is able to reliably infer new chemical-ADR associations using existing noisy, biased and incomplete data stored in the SIDER database. Not only is CS highly tolerant to database errors (mislabeled drug-ADR associations), but it also handles sparse data (yet unknown/unrecorded associations) well. Our method is particularly accurate in predicting severe rare ADRs in cases where some (but not necessarily rare) ADRs for the drug are already known.
3.1 State of the field of computational ADR prediction
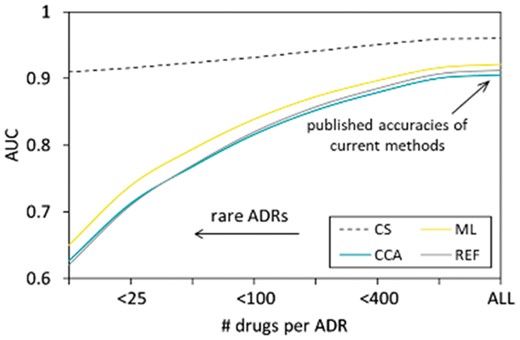
To assess methods’ accuracies on rare ADRs, we first ran multiple, independent and statistically robust, cross-validation experiments, one for each selected ADR promiscuity cutoff (12, 25, 50, 100, 200, 400, 800, ∞), where the ‘promiscuity’ of an ADR is defined as the number of FDA approved drugs that are known to cause the ADR. For each promiscuity cutoff x, a cross-validation experiment was performed on the set of randomly selected drug-ADR pairs in which the ADR’s promiscuity is below x. It should be emphasized that the ADR promiscuity can only serve as a crude estimate of how harmful an ADR is (mild ADRs tend to be frequent while harmful ADRs are relatively rare).
The analysis presented in Figure 2 not only confirms the published accuracy of current methods but also provides an insight into the performance of the state-of-the-art algorithms as well as the accuracy improvement offered by CS.
State-of-the-art in ADR prediction and the value added by CS, ML, CCA, REF: naïve (reference) method. The values on the x-axis represent ADR promiscuities. The -axis represents the performance metrics, defined as the AUC. The results were obtained using a statistically rigorous cross-validation experiment on the set of drug-ADR pairs (STDERR is too small to show)
We can summarize the results shown in Figure 2 as follows:
The existing algorithms are unable to predict serious rare side-effects. While published accuracies of current methods are more or less satisfactory (balanced and unbalanced AUC and balanced AUPR ∼0.9; unbalanced AUPR ∼0.35), they should be interpreted properly as they only represent the average accuracies computed for all ADRs combined (the right side of Fig. 2). The cumulative accuracies are driven strongly by easy predictions of frequent and innocuous ADRs, those of little interest in drug discovery. For rare and serious ADRs, the accuracy of current algorithms quickly approaches the accuracy a purely random classifier (AUC ∼0.5).
To date, the progress in the field of computational prediction of rare severe ADRs has been dismal at best. To assert this claim, it is enough to glance over the line that traces the performance of the naïve and straightforward REF method in Figure 2. Going beyond this simple approach and implementing more sophisticated techniques, such as ML and CCA, yields a low diminishing return.
CS overcomes current obstacles in predicting drug-ADR associations. Our method is so efficient in extracting relevant information from noisy, biased and incomplete data (stored in the SIDER database) that its performance in predicting severe ADR (left part of Fig. 2) matches or even exceeds the cumulative performances of current methods on all side-effects combined (right part of Fig. 2).
3.2 Compressed sensing learns on the fly
Not only is CS able to predict rare ADRs, but also, as we will demonstrate later, the performance of CS in predicting ADRs for a particular chemical improves with the increasing knowledge of other ADRs associated with the chemical. In practice, this means that the ability of CS to predict a serious ADR for a candidate chemical would increase as the drug moves up the different stages of clinical trials. Other methods are unable to take advantage of accumulating information on ADRs. This comes as no surprise to us, since a closer look into the ML algorithm reveals that, when predicting whether a drug is likely to cause an ADR , ML utilizes the information on other drugs that cause the side-effect , but not the information on other ADRs associated to .
Before running a more comprehensive benchmark, we tested the performance of CS in predicting selected serious side-effects, including hepatotoxicity, cardiotoxicity, carcinogenicity, neurotoxicity, as well as thrombocytopenia, leukopenia, anaemia, nepropathy and death. Those nine ADRs represent some of the main side-effects responsible for drug market withdrawals (Onakpoya et al., 2016).
Starting with hepatotoxicity, we selected all drugs that, according to SIDER classification, are known to cause that ADR (‘cases’) and the same number of randomly selected drugs that are known not to cause hepatotoxicity (‘controls’). We let each method access different amount of information on other ADRs caused by the drugs (10%, 25%, 50%). Figure 3 illustrates the differences in normalized raw scores obtained by CS, ML and CCA on ‘case’ and ‘control’ drugs.
Predicting hepatotoxicity of drugs. Drugs known to cause hepatotoxicity (‘cases’) are shown in “yes” column, while “no” column (“controls”) represents randomly chosen drugs known not to cause hepatotoxicity. The vertical axis gives normalized prediction scores
While it is obvious that only CS can differentiate between the two sets of drugs (‘cases’ and ‘controls’), it should be noted that the performance of our method might be better than suggested in Figure 3. For instance, the ‘control’ outlier shown in the middle subfigure of Figure 3 corresponds to the drug minoxidil and clearly stands out by its high CS score. Despite being classified as a non-hepatotoxicity drug in SIDER, minoxidil is, according to FDA reports, in fact, known to cause hepatotoxicity in patients over the age of 60.
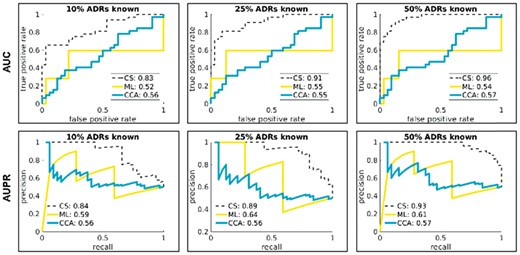
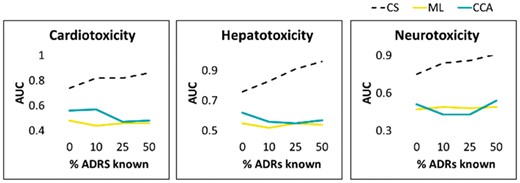
The performance statistics (AUC and AUPR) obtained from the algorithms’ raw scores (after averaging the raw scores over a dozen of randomly chosen sets of ‘control’ drugs) is presented in Figure 4. Summary performance data for cardiotoxicity, hepatotoxicity, and neurotoxicity are shown in Figure 5. As illustrated in the Supplementary Figure S1, the results for the remaining six ADRs show similar trends.
Accuracy of hepatotoxicity predictions. The ROC (top) and PR (bottom) curves are generated based upon the raw scores obtained on ‘case’ and ‘control’ drugs. We performed a number of different tests, each time letting the methods under study (CS, ML, CCA) access different amount of information (10%, 25%, 50%) on other, non-hepatotoxicity ADRs associated with ‘case’ and ‘control’ drugs, thus mimicking methods’ accuracy and reliability during clinical trials. We use “balanced” AUPR for better visualization. Unbalanced AUPR scores are easily obtained by multiplying the balanced scores by the fraction of condition positives in the test set
Predicting ADRs responsible for drug market withdrawals. The x-axis represents the percentage (0%, 10%, 25%, 50%) of other ADRs for the drugs made available to the algorithms under study. The y-axis represents the AUC values. The mean AUC values shown in the figures are obtained over multiple runs on ‘control’ drugs to achieve robust statistics (STDERR too small to show). Corresponding figures for other selected ADRs are given in the Supplementary Material
3.3 Significant performance gains of CS in comprehensive cross-validation benchmarks
We now return to the comprehensive benchmark from the beginning of this section to provide a more detailed and more illustrative performance analysis.
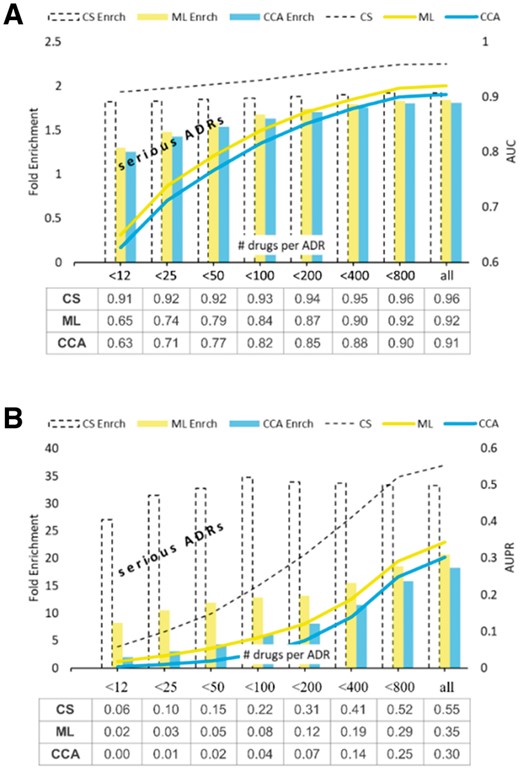
Aside from showing the raw scores, Figure 6 illustrates the ‘fold enrichment’ offered by the methods compared. The ‘fold enrichment’ represents the improvement in a method’s performance over the random predictor (one that generates prediction scores uniformly at random). In other words, defined as the quotient of two scores, ‘fold enrichment’ shows how many times is the method’s AUC (or AUPR) better than the AUC (respectively, AUPR) obtained by the purely random classifier. This measure is particularly useful when interpreting the AUPR scores (Fig. 6B), because (in contrast to the intuitive AUC scores) the AUPR scores depend on the property of the test set. It is important to note that the AUPR score achieved by the purely random classifier is equal to the fraction of condition positives in the test set ().
Value added by CS in AUC and AUPR benchmarks. The data tables beneath the graphs give the mean methods’ AUC (A) and AUPR (B) scores obtained in five rounds of 10-fold CV benchmark (STDERR too small to show)
As seen in Figure 6, CS enriches prediction of ADRs at an almost uniform rate, irrespective of the ADR promiscuity and the type of test performed (AUC or AUPR). For extremely rare ADRs, those associated with less than 12 FDA drugs (such as carcinogenicity), the performance of
CS, as measured by AUPR, is about 27 times better than the performance of the random classifier, while the performance of the better of the two remaining methods (in this case ML) is only about eight times better. For the more frequent serious ADRs, those associated with <50 drugs (such as, for example, neurotoxicity or cardiotoxicity) the AUPR fold enrichments of CS and SOA are 34 and 12, respectively.
We also tested the methods accuracy using the Matthews correlation coefficient (MCC) (Matthews, 1975. For this purpose, each method was turned into a binary classifier by splitting the SIDER data into training, validation and test set, in the ratio 80/10/10. The benchmarking results are given in Supplementary Figure S2. As shown in this figure, the MCC score of CS is significantly higher than that of ML and CCA.
We note that the cutoff scores required by MCC provide a single set of predictions for a given dataset and each method compared. This approach is advantageous as it provides insight into the benchmarking performance beyond what is available using the cutoff independent metrics such as AUC and AUPR. It is important to emphasize that the actual MCC scores achieved by the three classifiers should be viewed in light of an incomplete and biased test set. First, we note that SIDER contains only ‘positive’ data, namely only the drug-ADR associations observed during clinical trials, which are of limited duration and performed on small patient population groups. More specifically, on average SIDER has 69 ADRs per drug while, in reality, this number is several times higher (Tatonetti et al., 2012). For instance, a study of FAERS (FDA Adverse Event Reporting System) postmarketing data reveals at least 329 ADRs per drug on average (Tatonetti et al., 2012). This makes the MCC scores close to 1 out of reach of highly accurate classifiers. Even if one errs on conservative side and assumes only 200 ADRs per drug, the top MCC score achieved by a perfect classifier would only be about 0.5807. On the other hand, each classifier in our study uses information beyond what is encoded in SIDER (e.g. the pairwise similarity of drug chemical structures) and thus is potentially capable of detecting the true drug-ADR associations that have not been observed during clinical trials. Liver injury caused by minoxidil therapy, discussed earlier, is one such example.
3.4 Predicting ADRs for novel chemicals with no known ADRs
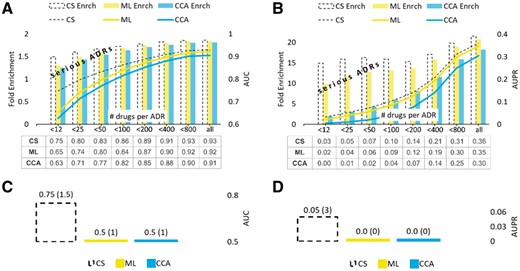
A cross-validation benchmarks segregated by drugs was performed to assess the methods’ accuracy in predicting ADRs for chemicals with no known ADRs. The results of AUC and AUPR benchmarks are summarized in Figure 7A and B and are consistent with those seen on example ADRs presented earlier.
Value added by CS in the ‘cold-start’ setting. AUC and AUPR scores shown in subfigures (A) and (B) represent the mean values obtained in five rounds of the 10-fold cross-validation on the set of ‘new’ drugs, those with all ADRs hidden (masked out). Subfigures (C) and (D) show the methods’ performances in CV segregated by ADRs (enrichment scores given in parentheses). STDERR values are too small to show
Figure 7C and D show the methods performance in the CV segregated by ADRs using the AUC and AUPR measures, respectively. As seen in those figures, the accuracies of ML and CCA in predicting drugs associated with ‘new’ ADRs do not improve the accuracies of the random classifier.
The results of the previously described MCC benchmark in ‘cold start’ setting are given in Supplementary Figure S3. As seen in this figure, the MCC scores achieved by CS range from <0.1 to about 0.4. Nevertheless, CS outperforms ML and CCA, especially on rare ADRs.
3.5 Predicting ADRs for chemicals with no known rare ADRs
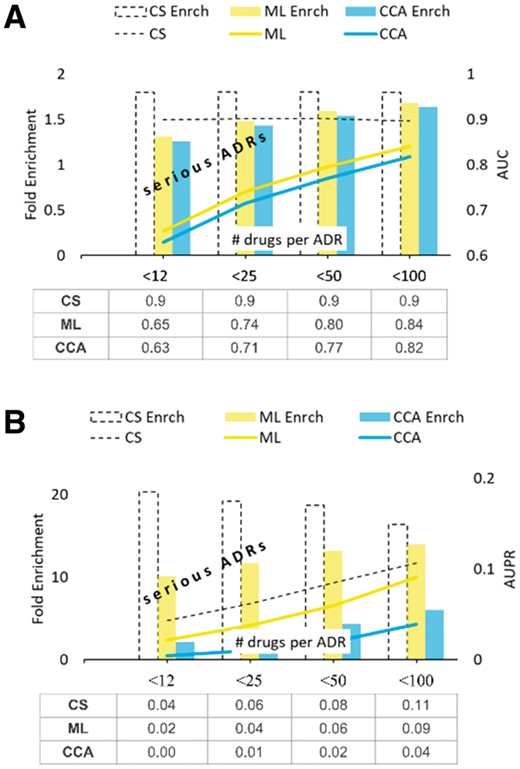
Figure 7 shows that CS has advantage over the other methods when applied to chemicals with no known ADRs. Furthermore, Figure 5 suggests that such an advantage might sharply increase with the increasing number of ADRs discovered for the drug (right side of the Fig. 5 plots). To test this hypothesis, we removed and then tried to re-discover all associations between drugs and their severe, rare ADRs (those that have promiscuity below the specified cutoff). The results of our analysis are summarized in Figure 8.
Test for rare ADRs. The mean values obtained in five rounds of 10-fold CV test on the set of drugs with no known rare ADRs. STDERR is too small to show
As seen in Figure 8B, the AUPR fold enrichment achieved by CS is significant and, in case of very rare ADRs, about twice as large as the one obtained using the better of the two remaining methods. Supplementary Figure S4 illustrates the results of the MCC benchmark in this setting.
It should be noted that the benchmark presented in this section measures methods’ accuracy and reliability in predicting severe rare ADRs for a drug of interest, given that some (relatively mild) side-effects for the drug have already been observed. Unlike the other two methods, CS is capable of taking advantage of the information of other ADRs associated with a drug of interest. In practice, this means that the ability of CS to predict rare ADRs for a candidate chemical increases as the drug progresses through various stages of clinical trials. Moreover, the results of this benchmark suggest potential ability of CS to predict drug market withdrawal ahead of time.
3.6 Predicting ADRs for chemicals of novel structure
Finally, we used cross-validation to test the ability of our method to correctly predict side-effects of novel chemicals. For the purpose of this study, a chemical is considered to have a ‘novel’ structure if its Tanimoto similarity to each other database chemical is below the upfront specified cutoff.
To perform cross-validation, the training set had to be altered by removing all chemicals (along with their ADR associations) that had above the threshold Tanimoto similarity to any chemical from the test set. This intervention rendered 10-fold cross-validation unfeasible, due to the training set in each fold being nearly or completely empty. Hence, in order to gain insight into methods’ performance in discovering rare ADRs for novel drugs, we resorted to LOOCV on the set of drugs. For each drug in the test set, we hide, and then try to recover, all rare ADRs (those of drug-promiscuity below the specified cutoff).
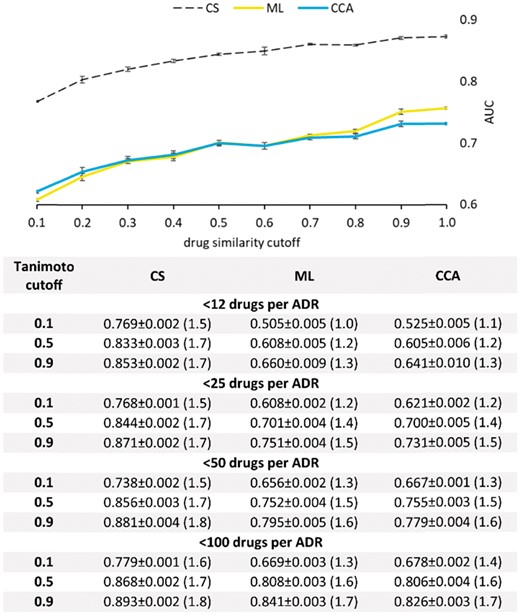
The plot in Figure 9 shows a head-to-head comparison between CS, ML and CCA in recovering hidden ADRs associated with less than 25 drugs, using varying Tanimoto cutoffs for excluding ‘similar’ drugs from the training set. As seen in this figure, even if provided with a severely reducedtraining set (Tanimoto cutoff = 0.1), our algorithm exhibits accuracy superior to the accuracies of other state-of-the-art methods even in cases where the other methods are trained on comprehensive data sets (Tanimoto cutoff = 1.0). Additional data are presented in the table beneath the graph. Complete benchmarking results are given in the Supplementary Tables S1 and S2.
LOOCV on chemicals of novel 3 D structure. Recorded are the mean values obtained in five rounds of the LOOCV test on the sets of 100 randomly chosen drugs. The top figure shows the AUC values obtained on ADRs associated with <25 FDA approved drugs. The table beneath the figure shows the AUC values for selected Tanimoto and ADR promiscuity cutoff values. The fold enrichment is given in parentheses
Using a subset of drugs (of the same size as the test set) from SIDER as ‘validation’ drugs, we derived the optimal cutoff score for each method and tested the method’s accuracy in a benchmark that uses MCC as the test measure The results are given in the Supplementary Table S3.
3.7 Algorithm’s complexity
The running time of our program is comparable to that of CCA but worse than the running time of ML. When tested on a 2.5 GHz Intel® Core i7 CPU with 16GB of RAM, the running times of the three algorithms in completing the SIDER matrix are as follows: CS 58 s, ML 2 s and CCA 93 s. It should be noted that the straightforward parallel implementation can make CS program practical, even for large-scale studies.
4 Discussion
ADRs play a major role in drug discovery and human health. Despite significant efforts made over the last decade, the progress in developing computational tools capable of predicting serious side-effects of novel chemicals and market drugs has been dismal at best. No current computational method is able to predict whether a novel and promising compound will eventually cause hepatotoxicity, carcinogenicity, cardiotoxicity, neurotoxicity, immune reaction thrombocytopenia, leukopenia, anaemia or any other harmful and potentially fatal ADRs. Moreover, advances in the area of drug-ADR association prediction are hindered by a lack of clean and comprehensive databases that store drug-ADR associations and by the difficulty of current methods to deal with noisy and sparse information.
Using the ‘CS’ framework from the digital signal processing field, we developed a computational method that can reliably infer new chemical-ADR associations using existing noisy, biased and incomplete databases. Not only is our method able to detect rare ADRs associated with novel chemicals, but also our data demonstrate that the accuracy of CS in predicting a serious ADR for a candidate drug increases with increasing knowledge of other ADRs associated with the drug. In practice, this means that, as the candidate drug moves up the different stages of clinical trials, the prediction accuracy of our method will increase accordingly.
CS represents an important first step in the development of a fully automated and accurate computational method for predicting serious ADRs. Ultimately, accurate and reliable prediction of ADRs will accelerate drug discovery and reduce the risks of drug treatment.
The difficulty in identifying ADRs during clinical trials and the complexity of parsing side-effect data from drug package inserts and post-marketing reports gives rise to incomplete and noisy databases of drug-ADR associations. On the other hand, clean and comprehensive databases represent a straightforward way of improving the performance of prediction methods. For instance, we were able to increase the accuracy of our method in predicting drug-induced liver injury by replacing the hepatotoxicity associations stored in SIDER by those stored in LTKB-BD (Chen et al., 2011). LTKB-BD represents an expert classification of only 287 drugs with respect to drug-induced liver injury.
Aside from utilizing cleaner data, we believe that much more accurate predictions of drug-ADR associations can be made by taking advantage of gender-, age- and demographics-specific drug-ADR associations, drug-dose specific associations and data on side-effects arising from combination drugs (Tatonetti et al., 2012).
Funding
This research was supported by the National Library of Medicine of the National Institute of Health under the award number [R01LM011986] (L.X.), the National Institute of General Medical Sciences of the National Institute of Health under the award number [R01GM122845] (L.X.), National Science Foundation under the award number [CNS-0958379, CNS-0855217, ACI-1126113], the City University of New York High Performance Computing Center at the College of Staten Island, and University of Northern Iowa Equipment Grant (A.P.).
Conflict of Interest: none declared.
References


