


Abstract
Advances in high-throughput sequencing technologies have made it possible to generate multiple omics data at an unprecedented rate and scale. The accumulation of these omics data far outpaces the rate at which biologists can mine and generate new hypothesis to test experimentally. There is an urgent need to develop a myriad of powerful tools to efficiently and effectively search and filter these resources to address specific post-GWAS functional genomics questions. However, to date, these resources are scattered across several databases and often lack a unified portal for data annotation and analytics. In addition, existing tools to analyze and visualize these databases are highly fragmented, resulting researchers to access multiple applications and manual interventions for each gene or variant in an ad hoc fashion until all the questions are answered.
In this study, we present GENEASE, a web-based one-stop bioinformatics tool designed to not only query and explore multi-omics and phenotype databases (e.g. GTEx, ClinVar, dbGaP, GWAS Catalog, ENCODE, Roadmap Epigenomics, KEGG, Reactome, Gene and Phenotype Ontology) in a single web interface but also to perform seamless post genome-wide association downstream functional and overlap analysis for non-coding regulatory variants. GENEASE accesses over 50 different databases in public domain including model organism-specific databases to facilitate gene/variant and disease exploration, enrichment and overlap analysis in real time. It is a user-friendly tool with point-and-click interface containing links for support information including user manual and examples.
GENEASE can be accessed freely at http://research.cchmc.org/mershalab/GENEASE/login.html.
Supplementary data are available at Bioinformatics online.
1 Introduction
The completion of human genome project and advances in high throughput technology platforms such as next generation sequencing, led to a significant increase not only in volume but also the rate at which these data are being generated (Li et al., 2011). The amount and complexity of the data poses serious challenges to researchers with limited bioinformatics expertise, who are prime users and need to handle and analyze these data before it can be interpreted and understood in a biological context (Andreatta et al., 2011). In particular, the different types of data are scattered and stored in various repositories and databases and analyzed independently (Palsson and Zengler, 2010). However, each resource may contain only a part of the information that a researcher is looking for and there is a need to access multiple tools, websites and databases for each gene, variant or disease of interest until all the questions are answered (Wu et al., 2009). Determining which databases to search is often not straightforward: a single database query, while simple from a user’s perspective, is often not as informative as drawing data from multiple databases. In addition, most web applications have different user interfaces and query systems and one has to remember each and every website URL.
To prioritize or rank disease related genes/variants from lists of risk loci and gene sets associated with diseases, biologists first explore annotation information including basic information, sequence, genomic regions and population genetics information including genotypes, allele frequencies and transcripts by browsing NCBI GenBank database. The second step is to use the SNP information and evaluate its potential impact on gene function or regulation, to map SNPs and mutations in genes, to explore SNPs with potential phenotypic effects, to use SNP haplotypes to detect signature of selection, to explore haplotype block structure maps, to perform SNP allele frequency summary from multiple populations. One could query for levels of gene expression in different tissues by searching Genotype-Tissue Expression (GTEx), genetic association by accessing GWAS Catalog, biological pathways by visiting KEGG, RegulomeDB annotation for genetic variants in noncoding regions. The final step is to analyze and find overrepresented and enriched phenotype annotations from these candidate gene lists and reduce the amount of time for wet-lab experimentation. Several software tools like DAVID (Huang da et al., 2009), ToppGene (Chen et al., 2009), Enrichr (Chen et al., 2013) and g: Profiler (Reimand et al., 2016) to name a few have been developed which can help the users to perform enrichment analysis of candidate gene lists using functional ontology terms. The most common limitation is that they download and store annotation resources in their local databases, and lack real-time updates. Even though most of these tools update their local databases periodically, the speed at which current omics databases change and update require tools that explore up-to-date annotation information in real-time. Thus, there is a need for automated and real-time functional genomics analysis and data mining tools with an integrative and centralize access to recently released and updated omics data such as GTEx, ENCODE, GWAS Catalog, Roadmap Epigenomics, Gene and phenotype ontologies.
To take advantage of the wealth of publicly available omics resources and address current limitations, we developed GENEASE, a web-based application to automatically extract genes or SNPs information based on user-defined criteria and export results in formats suitable for subsequent use. GENEASE is a real-time, platform independent, api-driven bioinformatics tool for multi-omic and phenotype data exploration, statistical enrichment, overlap analysis and visualization. It can be broadly divided into three modules. The data exploration module enables users to search multiple databases and retrieve SNP(s), gene(s), CpG site or disease information. The results returned are dependent on the input choice selected. Apart from providing descriptive information, the exploration results also contain input-specific outputs based on external databases such as GTEx, ClinVar, ENCODE, GWAS Catalog, Roadmap Epigenomics, OMIM and model organism orthologs. An important feature of exploration module is that it can also be used to explore a list of bulk inputs. This helps to simultaneously view information about sets of candidate inputs without having the need to make multiple individual requests saving time and resources. The next module is the enrichment analysis module which is used to perform real-time statistical enrichment analysis of gene functional annotations.
GENEASE supports enrichment analysis of KEGG pathways (Kanehisa et al., 2017), gene ontology (Gene Ontology Consortium, 2015) and phenotype ontology annotations (Kohler et al., 2017). In all the cases, the annotation data is downloaded in real-time either using the API’s exposed by the respective websites or from the ftp repositories. Unlike most bioinformatics tools, data that are either recently added or updated will not be missed in GENEASE analysis, thus, presenting accurate and up-to-date genome annotation results. Finally, the overlap analysis module is used not only to find overlapping genes/variants, pathways or gene ontology from multiple sources or experiments but also to analyze shared genetic loci/pathways between diseases.
2 Materials and methods
2.1 Programmatic architecture
GENEASE is a dynamic web tool which can run on any browsers such as Chrome, Firefox, Internet Explorer, Safari, etc. The application was developed using HTML 5.0 (front end) with the combination of Cascading Style Sheets (CSS) and jQuery JavaScript library (client-side validation) and PHP (server-side scripting). All the statistical tests and visualizations with in the tool are performed using Python’s SciPy (https://docs.scipy.org/doc/scipy-0.14.0/reference/index.html) and matplotlib (https://matplotlib.org/) packages. The storage layer consists of MySQL as the database server and the whole application was deployed on an Apache 2.0(httpd) web-server enabling multiple concurrent requests to the tool. HTML iframes and hyperlinks are used to provide direct access to other external databases (e.g. ClinVar, GTEx, dbGaP, GWAS Catalog, ENCODE, KEGG, Reactome, Roadmap Epigenomics, Gene and Phenotype Ontology). Additionally, a distributed caching system is configured to store results of frequently accessed input values.
2.2 Two-step input authentication
In each of the three modules of GENEASE, a two-step authentication process is employed. Genes/SNPs entered by the user are first checked in our local database, and if found the relevant information is retrieved through an API (Fig. 1a). In the scenario where the inputs are not found, we access HGNC (for gene) or dbSNP (for SNP) tools on-the-fly for each request to verify and fetch the information. If they are not found in either of these databases, we add them to our ‘missing input’ list which will be displayed to the user for further authentication and verification. This approach gives users the opportunity to explore or analyze all their inputs.
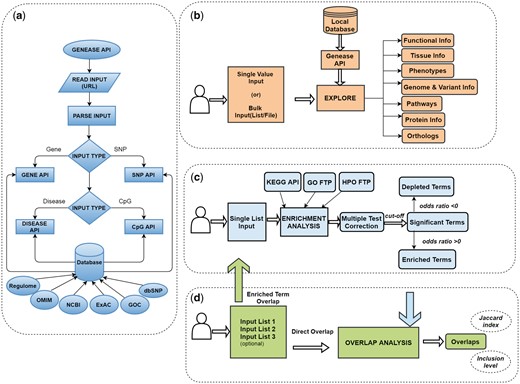
GENEASE workflows: (a) GENEASE API used to retrieve gene, SNP, disease or CpG site information from local database. (b) Exploration module, begins with reading the input types from the explore screen. Local API used to extract information if the input is found and external database links are included in the final result. (c) Enrichment analysis module, starts with reading the gene/SNP lists from the analysis screen. Functional annotations are accessed and parsed on-the-fly and statistical tests are performed to test for enrichment. Multiple test correction procedures are employed and odds ratio is used to find enrichment/depletion. (d) Overlap analysis module firstly reads the gene/SNP sets supplied by the user. In case of direct overlap, intersections are found and overlap scores are computed directly. For enriched term overlap analysis, enrichment analysis module is used to retrieve the enriched terms in each of the sets and overlap is computed using them (Color version of this figure is available at Bioinformatics online.)
2.3 Data exploration
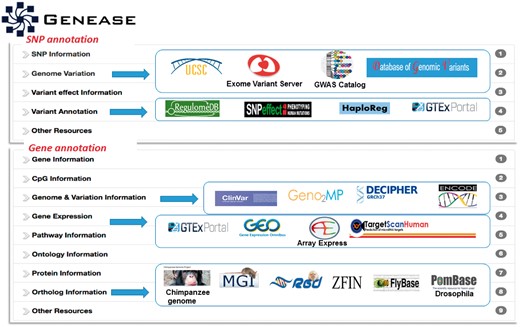
Using the data exploration module one can explore a gene, SNP, disease or methylation-site (Fig. 1b). The authentication process described above is employed and primary information like chromosome, gene or SNP locus, position etc. are fetched. We additionally provide real-time access to multiple databases for different input types (Supplementary Tables S1–S3) through HTML iframes and hyperlinks enabling the users to simultaneously visualize data from multiple databases. One major advantage of this approach is that the users can access multiple websites simultaneously without having to worry about the type of input identifiers (Entrez IDs, HGNC symbols, rsIDs, UniProt IDs, transcript IDs, etc.) that have to be used in them. GENEASE takes care of transitions between all these identifiers. Once the input type is selected and the relevant inputs are provided, the result from explore module is displayed in a dynamic design by grouping the information and the links to databases based on the underlying information shown using a ‘sliding window’ layout. Execution time for bulk requests is significantly reduced if the inputs are found in the application cache (Supplementary Table S4). The results are displayed in downloadable HTML tables for bulk input scenario.
2.4 Enrichment analysis
Contingency table used in Fisher's exact test
| Group 1 (in pathway) | Group 2 (not in pathway) | ||
|---|---|---|---|
| Group 1 (in the list) | a | b | a + b |
| Group 2 (not in list) | c | d | c + d |
| a + c | b + d | a + b + c + d (=n) |
| Group 1 (in pathway) | Group 2 (not in pathway) | ||
|---|---|---|---|
| Group 1 (in the list) | a | b | a + b |
| Group 2 (not in list) | c | d | c + d |
| a + c | b + d | a + b + c + d (=n) |
Note: Significance P-values calculated based on the observed gene/SNP counts for enrichment analysis.
The calculated significance value of the observed arrangement of data indicates whether the annotation term under question is enriched or not. A two-tailed test is used to check for both enrichment and depletion of an annotation term in the given gene list (Rivals et al., 2007). Since multiple testing is involved, we adapt correction procedures that control both family-wise error rate (FWER)—Bonferroni method and false discovery rate—Benjamini-Hochberg FDR (Benjamini and Hochberg, 1995) and q-value FDR (Storey and Tibshirani, 2003). Users can select the method of their choice and supply the significance cut-off they want to use in the analysis. Transitions between the input types (symbols <-> IDs) are structured inside the tool. Major advantage of using GENEASE for enrichment analysis is that all the gene functional annotations are downloaded and analyzed at runtime for each and every request. The intuition in using this technique is to make sure newly introduced terms or recent mappings between a gene and an annotation term will not be missed in the analysis.
Gene counts corresponding to the annotation terms are very important in calculating the probabilities and their significance. Any small changes in the counts due to missing the latest updates from these annotation databases might lead to inaccurate results. A pathway or ontology which is actually enriched might be categorized as otherwise or vice versa. Various annotation terms and the databases used to download these data are detailed in Supplementary Table S5.
2.5 Overlap analysis
3 Results and discussion
3.1 GENEASE application
GENEASE begins with a home screen from which all modules in the tool can be accessed (Fig. 2). The explore screen provides users the option to select the input type to be used (default value is gene). Inputs can either be entered into the text area or uploaded in a file (bulk input case). A sample link is provided for both input scenarios in the bulk input case, which either populates the text area with a sample list of inputs or downloads a text file containing them.
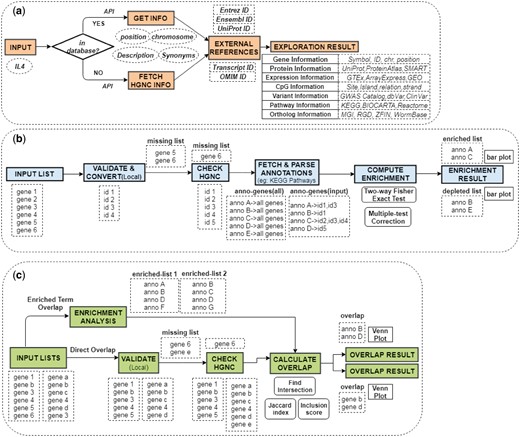
GENEASE module procedures: (a) Step-by-step procedures followed in Exploration module including the conditional validation procedure. External references are downloaded and appended to external links to form dynamic requests. (b) All steps of enrichment module including the two-step validation. Annotation data is downloaded in run-time and input ‘hit’ counts processed for significance tests. (c) Summary of procedures followed in overlap analysis. Enrichment analysis performed before computing the overlaps in case of ‘enriched term overlap’ case (Color version of this figure is available at Bioinformatics online.)
GENEASE has separate result interfaces for single input case and bulk input case. In the single input case, summarized information about the input is displayed in a table and links to external databases are grouped by the category of the information displayed (Fig. 3). Using GENEASE users can explore non-coding and coding omics databases simultaneously within the same screen by clicking on the respective logos. Non-coding genetic variants are linked with gene expression, RNA splicing transcription factor binding, chromatin openness measured by DNASE I hypersensitivity, DNA methylation and histone modifications. Additionally they can open them in a new browser tab by clicking on the ‘new tab’ link (under each logo). The gene category of the exploration module contains links to gene orthologs from 10 different model organisms including mouse, rat, zebrafish, yeast, drosophila and chimpanzee.
Exploration module: Result interface of exploration module includes multiple information ‘sliders’. SNP information and gene information sliders include gene/SNP descriptive information about the SNP or gene. Other sliders contain links to functional omics external resources for non-coding variants including RegulomeDB, HaploReg, GTEx and SNPeffect, etc. (Color version of this figure is available at Bioinformatics online.)
The bulk input scenario works similarly except that all the results are shown in tabular fashion and external databases can be viewed in a new browser tab by clicking on the respective logos. The enrichment analysis screen allows the user to select input types, annotation terms to test for enrichment, multiple testing correction procedures and the significant cut-off to be used. Similar to explore—bulk input case, ‘sample link’ option is provided. Result interface for enrichment analysis displays bar plots of the top five enriched and depleted terms (if any) from the input list. Multiple testing corrected P-values (or q-value) and odds-ratio are utilized to judge a term as enriched or depleted and the negative logarithm of the Fisher exact test P-value is used as a metric to determine the magnitude of enrichment or depletion. Hence longer the horizontal bar, larger the significance of enrichment or depletion. Apart from that, the result screen also contains a downloadable HTML table listing each annotation term, values from the sample which are mapped to it and the significance P-value. The last column of the table indicates whether the term is enriched or depleted. All the annotation terms in the result table can be further explored in the source websites through hyperlinks. Links are also provided to explore each of the input values through the exploration module of GENEASE. Furthermore, both the plot and table results can be downloaded.
Overlap analysis screen is similar in style to that of enrichment analysis screen. Users can supply up to three lists and provide custom names to them. There are two usage scenarios in overlap analysis and certain input selections are triggered based on it. (i) Simple overlap analysis can be used to find direct overlap between input lists at gene or SNP level. This does not involve enrichment analysis. (ii) Overlap analysis among enriched terms can be used to calculate similarity between input lists based on enriched pathways, biological processes or phenotype ontologies shared among them. In this case users would be prompted to select the annotation term to be used, multiple testing correction procedures and the significance cut-off values. The overlap analysis result contains a Venn diagram to illustrate the level of overlap between the inputs and a downloadable HTML table. The first column of the table has the names of the input lists given by the user (placeholder names used if none supplied). Unique input values belonging to each list can be downloaded by clicking on this column value. The respective counts are displayed in the second column. Last two columns display the Jaccard and inclusion scores respectively. The text in the overlap line of the result table is highlighted in shade to distinguish them from the non-overlap lines. The overlap Venn diagram and the result table can be downloaded for subsequent usage.
3.2 GENEASE as a tool to explore disease variants
GENEASE can be used to explore and extract genes and variants associated with a particular disease. To illustrate this we first used GENEASE to search for variants associated with asthma from GWAS Catalog database (MacArthur et al., 2017). SNP rs9272346 is one of the most replicated variant on chromosome 6 and associated with asthma. Similar to most GWAS results, rs9272346 is located in the non-coding regions of genome and could likely affect gene regulatory mechanisms. The advantage of GENEASE is it can explore non-coding regions of the genome which are enriched for expression quantitative loci (eQTLs) (Nicolae et al., 2010), DNase I hypersensitive sites sequencing (DHSseq) peaks and chromatin immunoprecipitation sequencing (CHIPseq) peaks (Encode Project Consortium, 2012). Regulatory SNPs modulate gene expression through multiple mechanisms involving RNA splicing, transcription factor binding, DNA methylation and miRNA recruitment. Accordingly, rs9272346 likely affects binding sites and is linked to expression of gene target, eQTLs, CpG sites, promoter and enhancer histone marks and motif altering (Fig. 4). Further, proxy variants in linkage disequilibrium (LD) with the actual risk variants can also be identified using the GENEASE explore module (Supplementary Fig. S1).
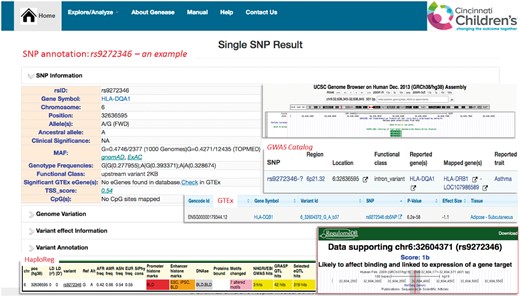
Exploration—example: SNP explore result for rs9272346 with snapshots of non-coding variant annotations databases including RegulomeDB, HaploReg, GTEx and Roadmap Epigenomics (Color version of this figure is available at Bioinformatics online.)
3.3 Comparison of GENEASE with DAVID, Enrichr and ToppGene for enrichment analysis
To evaluate the advantages of real-time data access, we compare GENEASE with existing enrichment analysis tools DAVID (https://david.ncifcrf.gov), ToppGene (https://toppgene.cchmc.org) and Enrichr (http://amp.pharm.mssm.edu/Enrichr) using GWAS Catalog data for asthma. There were 709 genes reported to be associated with asthma in the GWAS Catalog database (https://www.ebi.ac.uk/gwas/search? query=asthma). This gene set was then used to perform KEGG pathway enrichment analysis with FDR q-value of 0.05 as threshold. The results showed that ‘Asthma – Homo sapiens (human)’ is the most enriched pathway (q-value 0.009 and P-value 0.002) in the list having one-third of all the genes belonging to this pathway (Fig. 5). In both DAVID and ToppGene tools, ‘asthma’ is the second most enriched pathway. Differences were observed in the counts of genes and annotations. At the time of drafting our analysis, out of the 709 genes, 28 genes were unidentified in ToppGene and hence were not part of the pathway analysis. In case of DAVID, six genes were unidentified. GENEASE tackles this issue by using the two-step authentication procedure described above (Supplementary Table S6). Even though all 709 asthma-associated genes were identified in both Enrichr and GENEASE, the gene coverage across all KEGG pathways was 7010 and 7320 for Enrichr and GENEASE, respectively. In case of DAVID, this coverage drops to 6910 unique genes. Real-time data retrieval in GENEASE results in getting the exact counts for every request. This count is used in calculating the P-value and any differences could lead to significant variations in the results obtained as most enrichment analysis tests are highly sensitive to these counts. Additionally, unlike DAVID, Enrichr or ToppGene, GENEASE, via the exploration module provides regulatory variant information located in noncoding regions of the genome generated from databases such as GTEx, Roadmap Epigenomics, TargetScan, UniProt, RegulomeDB, HaploReg and GWAVA. Hence it is critically important for users of omics data to be informed in real-time about existing information related to regulatory and non-regulatory functional annotation resources as current data and format continue to be in a state of change.
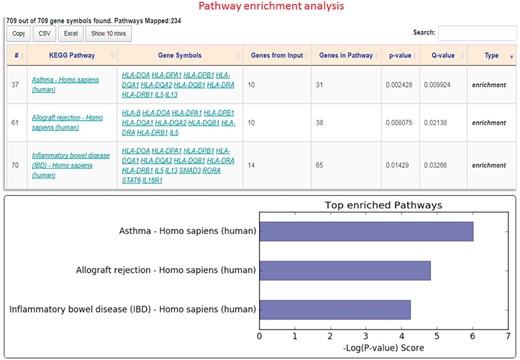
Pathway enrichment analysis: Result interface having downloadable HTML table listing pathways and corresponding gene counts. Bar plot of top enriched pathways is also included (Color version of this figure is available at Bioinformatics online.)
3.4 Investigating genetic loci overlap between phenotypes using GENEASE
It has been observed that asthma and atopic dermatitis (AD) have epidemiologic correlations (Eichenfield et al., 2003). However, little is known about shared genes, pathways and functional ontologies of risk loci for such comorbidities. To test this overlap genetically, we first performed gene overlap analysis of asthma and AD associated genes—709 genes in asthma and 173 in AD (accessed from GWAS catalog). The results showed there are 40 genes shared by both with a similarity score of 5 and 23% inclusion level (Fig. 6a). Furthermore, we computed overlap among disease-related biological processes using FDR q-value for multiple test correction with a 0.05 significance cut-off. Results showed that there are 2326 enriched process terms shared between asthma and AD genes with a 77% inclusion and 43% Jaccard similarity scores (Fig. 6b). Our exploratory analysis shows that the degree of interconnection between asthma and AD genes couldn’t be explained by random chance, suggesting a shared molecular mechanisms linking asthma and AD. An improved understanding of shared genomic regions could provide valuable insights into the causal pleiotropic effects that may contribute to comorbidity between asthma and AD (Galli et al., 2007).
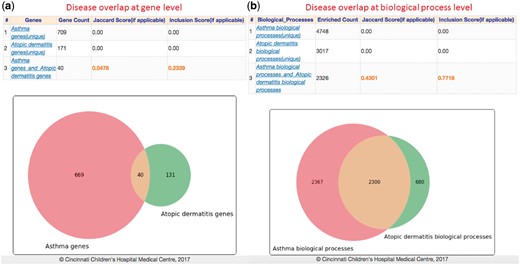
Gene and ontology overlap analysis: Computed results for overlap among genes and biological processes associated with asthma and atopic dermatitis (extracted from GWAS Catalog). Both overlap analysis result tables contains the computed similarity and inclusion scores and Venn diagrams illustrating the overlap levels (Color version of this figure is available at Bioinformatics online.)
3.5 Discussion
Although the amount of genomic sequence and annotation data available continues to increase at a very fast rate, users of these datasets have several common questions including the following: how are the genome data-bases deposited/organized; where is the data stored, and how to access it; how to analyze the data; how many minutes—maybe hours does a scientist spend every day to search the ‘right’ genomic resource and perform the analysis? Because the state of the art for identifying and characterizing genomic annotations is continually improving and changing, it is important for the user to be aware of the capabilities and limitations of currently available genome database annotations and bioinformatics tools. With an emphasis on the application of omics databases accessing and visualization of non-coding regions of the genome, we developed GENEASE as a tool to explore, analyze and visualize omics data in real-time. It provides an efficient ‘point-and-click’ interface for searching and retrieving SNPs, genes, disease or CpG sites and their relationship to several genomic annotations resources and explore a novel approach for data mining, analysis and visualization under a single interface. Annotation information in GENEASE is obtained in real-time through online databases.
For each user specified gene(s) or variant(s) request, GENEASE displays information on tissue expression, protein localization, animal orthologs, biological process and molecular functions for each input on a single output webpage. Hence rather than making multiple requests by visiting multiple separate databases for each gene or variant, users can obtain information by searching all at once in real-time. GENEASE also enables them to analyze candidate genes or variants by pulling out both coding and noncoding annotation resources and use them to find similarity with other candidate lists. Users can then be able to filter down their list based on the candidates contributing to enrichment. Altogether GENEASE improves efficiency and accessibility to data exploration and analysis of genes and variants by cross-disciplinary and real-time integration of data available in more than 50 databases to facilitate basic and translational research.
4 Conclusion
The unprecedented rate and scale of omics data accumulation in several databases and the lack of a unified portal for post-GWAS noncoding variants annotation pose significant challenges to biologists. Most disease associated variants are located in regulatory rather than protein coding regions of the genome and likely affect gene regulation mechanisms.
GENEASE helps to in-silico explore the non-coding regions by providing single page simultaneous access to these databases for exploration and pulling the data in real-time to conduct functional enrichment analysis. Since it is not a desktop tool, installations and configurations are not required and users do not have to allocate extra computer memories and prepare local databases for analysis. Future updates in GENEASE would include supporting unsupervised clustering by leveraging diverse omics data including functional information and cell type-specific eQTLs. In addition, we will incorporate feedbacks and suggestions from the users to keep the tool up-to-date without losing the originality. We anticipate that GENEASE and its interactive exploration, enrichment, overlap and visualization applications at SNP, gene and disease level will be widely used by biologist and clinicians with less bioinformatics training.
Funding
This work was supported by the National Institutes of Health grant R01HL132344.
Conflict of Interest: none declared.
References

