


Abstract
Transcription factor (TF) binds to the promoter region of a gene to control gene expression. Identifying precise TF binding sites (TFBSs) is essential for understanding the detailed mechanisms of TF-mediated gene regulation. However, there is a shortage of computational approach that can deliver single base pair resolution prediction of TFBS.
In this paper, we propose DeepSNR, a Deep Learning algorithm for predicting TF binding location at Single Nucleotide Resolution de novo from DNA sequence. DeepSNR adopts a novel deconvolutional network (deconvNet) model and is inspired by the similarity to image segmentation by deconvNet. The proposed deconvNet architecture is constructed on top of ‘DeepBind’ and we trained the entire model using TF-specific data from ChIP-exonuclease (ChIP-exo) experiments. DeepSNR has been shown to outperform motif search–based methods for several evaluation metrics. We have also demonstrated the usefulness of DeepSNR in the regulatory analysis of TFBS as well as in improving the TFBS prediction specificity using ChIP-seq data.
DeepSNR is available open source in the GitHub repository (https://github.com/sirajulsalekin/DeepSNR)
Supplementary data are available at Bioinformatics online.
1 Introduction
Transcription factor (TF) binding sites are specific DNA sequences that control gene expression through interaction with TF proteins. Revealing the dynamic regulatory systems by TFs signifies one of the major challenges in biological research. Precise mapping of TF binding sites (TFBSs) on a genomic scale plays a pivotal role in delineating transcription regulatory network and remains a long sought goal in genomic annotations (Guo et al., 2014; Salekin et al., 2016, 2017). Chromatin immunoprecipitation (ChIP) that yields a set of statistically enriched high occupancy binding regions is the most widely used method to recognize protein–DNA binding locations (Peng et al., 2007; Tuteja et al., 2009). However, unequal size of randomly clipped DNA fragments in ChIP technology largely limits the resolution of ChIP-seq data. To overcome this limit, ChIP-exo technique was developed that uses λ phage exonuclease to digest the 5′ end of TF-unbound DNA after ChIP (Rhee and Pugh, 2011). In ChIP-exo, λ exonuclease digestion leaves homogenous 5′ ends of DNA fragments at the actual two boundaries of TFBS, and after sequencing and mapping reads to the reference genome two borders of TFBS could be defined. The λ exonuclease treatment augments signal-to-noise ratio by eliminating unwanted DNA, which allows the discovery of low affinity binding sites.
With the advent of rapidly increasing genomic sequences, sequence-based computational methods have been developed and proven to be valuable in predicting TFBS (Guo et al., 2014; Stormo, 2000). The computational methods generally scrutinizes user provided input sequences in order to identify TF binding motifs that are statistically over-represented in binding sites with respect to background sequence. Predicting the binding location based on motif suffers from several shortcomings. First, motifs are typically short 10–15 bp sequences and therefore prediction using binding motifs is unlikely to generate predictions with high specificity. Moreover, motifs represent only the enriched binding sequence patterns and thus cannot explain all possible bindings of a TF. Finally, even if the motif search methods succeed in determining the anchor position of a putative binding site, they cannot predict the actual width of TFBS. The specificity of protein–DNA binding does not depend only on DNA sequence, but it also depends on methylation and 3D structures of DNA and TF protein macromolecules (Rohs et al., 2010) which explains the failure of motif searches in predicting true TFBS.
To enable precise prediction of TFBS, we designed in this paper a deep learning based model called DeepSNR. Deep learning, the most active field in machine learning, has been proven to achieve record-breaking performances in image and speech recognition (Graves et al., 2013; Zeiler and Fergus, 2014), natural language understanding (Sutskever et al., 2014; Xiong et al., 2016), and most recently, in computational biology (Alipanahi et al., 2015; Hassanzadeh and Wang, 2016; Quang and Xie, 2016; Zhou and Troyanskaya, 2015). The two recent methods, DeepBind (Alipanahi et al., 2015) and DeepSEA (Zhou and Troyanskaya, 2015), successfully applied deep learning to model the sequence specificity of TF binding with a performance superior to the best existing motif based statistical methods. Convolutional neural network (CNN) was adopted by these methods to capture the features essential for accurate characterization of motifs for target TFs. DeeperBind (Hassanzadeh and Wang, 2016) and DanQ (Quang and Xie, 2016) employed recurrent neural network (RNN) along with CNN to learn the spatial dependencies of detected motifs and yielded improved prediction performance in comparison with DeepBind and DeepSEA, respectively. In spite of their success in determining the presence of binding site in a given DNA sequence, these approaches cannot report the precise binding location. Our proposed method intends to bridge the gap by identifying TF binding location at single nucleotide resolution from 100 bp long input DNA sequence that is known to contain TFBS (e.g. ChIP-seq regions). DeepSNR is inspired by the similarity between ascertaining the TF binding location from 100 bp long sequences and image segmentation method. Similar to pixel-level image segmentation where each pixel is categorized as belonging to target object (e.g. dog, car and human) or background, DeepSNR classifies each nucleotide in a DNA sequence as putative binding site or background sequence and thereby achieves base pair resolution prediction. Recently, deconvNet (Noh et al., 2015) has achieved remarkable success in semantic image segmentation that aims to predict a category label for every image pixel. In that study, the authors built the deconvNet on top of the CNN obtained from VGG 16-layer net. Comparatively, the multi-layer deconvolution network in DeepSNR is composed of convolution layers adopted from DeepBind, deconvolution, unpooling and rectified linear unit layers (Fig. 1). Instead of relying on the similarity of binding sequences for deriving the binding preference of a TF, DeepSNR accurately captures the inherent complex interactions between TF and DNA and thus enables it to precisely locate the binding site.
DeepSNR model architecture
The entire deconvNet is trained using the data generated by ChIP-exo experiment and can be applied to individual sequences to pinpoint the TFBS location. When tested, DeepSNR attained outstanding result that substantially surpasses binding motif based algorithms in terms of precision, recall, F-Score and IoU. For instance, the trained DeepSNR model for CTCF achieved 83% median F-Score over 19 600 test sequences while MatInspector managed to record only 58%. We further discovered that the trained model automatically detects the location of motif sequence in pursuit of identifying binding site. When we applied DeepSNR on ChIP-seq data, it rendered us with unique display of distribution of TF binding motif over the ChIP-seq binding area which was possible to visualize because of the base-pair resolution prediction of DeepSNR (Supplementary Fig. S2).
We have also demonstrated the capacity of DeepSNR in improving the specificity of ChIP-seq peak calling results by an independent motif enrichment analysis that confirms the presence of highly enriched motif sequence in DeepSNR predicted binding region (Table 1). Moreover, the capability of DeepSNR in pinpointing the motif sequence in ChIP-seq data makes it suitable for playing a role in regulatory analysis of TFBS.
Motif enrichment analysis result of DeepSNR prediction on ChIP-seq data
| E-score where DeepSNR predicted TFBS(1), NO TFBS(0) and GEM predicted binding event | |||
|---|---|---|---|
| Motif found | TFBS | NO TFBS | GEM |
 | 3.6e–1241 | Not enriched | Not enriched |
 | 1.7e–1132 | 3.8e–002 | 5.3e–617 |
 | 8.5e–795 | 1.2e–047 | 1.5e–590 |
 | Not enriched | Not enriched | 9.2e–3043 |
| E-score where DeepSNR predicted TFBS(1), NO TFBS(0) and GEM predicted binding event | |||
|---|---|---|---|
| Motif found | TFBS | NO TFBS | GEM |
| 3.6e–1241 | Not enriched | Not enriched |
| 1.7e–1132 | 3.8e–002 | 5.3e–617 |
| 8.5e–795 | 1.2e–047 | 1.5e–590 |
| Not enriched | Not enriched | 9.2e–3043 |
Note: CTCF motifs are significantly enriched where DeepSNR predicted binding site within ChIP-seq peak in comparison to locations where it did not.
Motif enrichment analysis result of DeepSNR prediction on ChIP-seq data
| E-score where DeepSNR predicted TFBS(1), NO TFBS(0) and GEM predicted binding event | |||
|---|---|---|---|
| Motif found | TFBS | NO TFBS | GEM |
| 3.6e–1241 | Not enriched | Not enriched |
| 1.7e–1132 | 3.8e–002 | 5.3e–617 |
| 8.5e–795 | 1.2e–047 | 1.5e–590 |
| Not enriched | Not enriched | 9.2e–3043 |
Note: CTCF motifs are significantly enriched where DeepSNR predicted binding site within ChIP-seq peak in comparison to locations where it did not.
2 Materials and methods
This section discusses the architecture of DeepSNR model and describes the overall TFBS discovery algorithm.
2.1 Model design/architecture
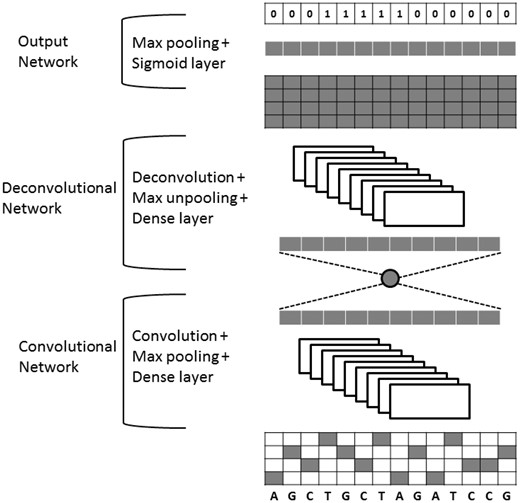
Figure 1 illustrates the detailed configuration of DeepSNR which is composed of three parts—convolutional, deconvolutional and output networks. The input of DeepSNR is 100 bp long DNA sequences that are known to contain a binding site of the TF of interest. The 100 bp DNA sequence is represented by a 4 × 100 binary matrix, with rows corresponding to A, C, G and T (one-hot encoding). While the convolutional network corresponds to feature extractor that learns the inherent features imperative for TF-DNA binding, the deconvNet is a shape generator that locates the binding site using the feature extracted from the convolution network. The output network of the model is used to generate a 100 bit binary sequence, indicating whether each nucleotide belongs to binding site (1) or background sequence (0).
The convolutional part of DeepSNR model is a replica of DeepBind (Alipanahi et al., 2015) network, which consists of one convolutional layer, followed by rectification and pooling operation, and one fully connected network augmented at the end to transform feature vectors into a scalar binding score. Our deconvNet is a mirrored version of the convolution network, and has a series of unpooling, deconvolution and rectification layers. Contrary to convolutional network that reduces the size of activations through feedforward step; deconvNet enlarges the activations through combinations of unpooling and deconvolution operations. The last layer, the sigmoid output layer, makes binary predictions for each of the 100 nucleotides. We get the maximum for each base pair over the output of deconvolution layer before employing the sigmoid function and then we apply a threshold to map the final output to 0/1.
To implement max-unpooling and deconvolution operations, we followed the similar procedure described in Noh et al. (2015) and Zeiler and Fergus (2014). The model records the position of maximum activation while performing the pooling operation and later this information is used in unpooling procedure to assign each stimulus back into appropriate location. The unpooling layer is especially important because retaining the place of maxima assists in capturing the binding motif and the binding site associated 3D contextual information and proves to be critical for precise localization of TFBS. The output of deconvolution layer associates a single input activation with multiple outputs, as illustrated in Noh et al. (2015). The deconvolution layer employed in our model is fundamentally the reverse operation of convolution and used to learn the shape details of TFBS. Integrating this layer in the architecture helps DeepSNR to capture the overall breadth of a binding site, thus improving the completeness of the model.
2.2 Training the DeepSNR model
The entire deconvolutional network is comprised of seven layers and contains a lot of associated parameters. In addition, the parameter search space for predicting binding location is enormous because TF-DNA binding is a very complicated phenomenon depending on DNA sequence, 3D structure of DNA and TF protein and their intrinsic complex interactions. Therefore, we trained DeepSNR in two stages as in Noh et al. (2015), so that the model progressively learns the essential features to recognize TFBS and tunes to optimum set of parameters. For the first stage of training, we constructed the training set such that the binding sites were placed at the center of 100 bp long input sequence. By doing so, we limited the search space significantly and forced the model to learn the intricate details of TF-DNA binding. We initialized the weights in convolutional network using DeepBind pre-trained for specific TF, while the weights in deconvNet were initialized with random samples from zero-mean Gaussians. Initializing the weights with DeepBind convolutional network is very important because it assists the model to converge with minimum iterations and mitigates vanishing gradient problem. In the second stage, we imposed the model with more challenging training samples by placing the binding site in random locations within input sequence as described in the next section. Weights learned from the first stage of training were used to initialize all the layers in this stage and they were fine-tuned making the network robust to TF binding location. Another major challenge in training a deep network is the modification of weight distributions due to the parameter updates of preceding layers which amplifies through propagation across layers (Ioffe and Szegedy, 2015). Hence, we performed batch normalization at the output of convolutional and deconvolutional layer to better optimize our network.
To train the model, we minimized the sigmoid cross-entropy loss which essentially leads to binary logistic regression. The standard stochastic gradient descent (SGD) was employed for optimization, where the learning rate was set to 0.01. The SGD method estimates the training objective gradient using only a subset of training examples. The batch size determines how many training pairs to sample for each parameter update step. In our implementation, the batch size was equal to 100 samples. The network converges after approximately 15 000 and 20 000 iterations, respectively, in first and second stage and the training takes less than an hour in a single computer with 12 G memory. We implemented the proposed network based on tensorflow. Lastly, a threshold was set at the output layer of DeepSNR architecture to return binary outcome that indicates whether a nucleotide belongs to binding site or not. We learned the threshold using validation set such that average F-Score (Supplementary Section S1) is maximized over the whole set and then, applied it on the test set for performance evaluation of DeepSNR.
2.3 Data for training DeepSNR
We employed published human CTCF ChIP-exo data (accession number: SRA044886) for training and testing the proposed DeepSNR. Engaging the highly sensitive ChIP-exo experimental data is imperative to train DeepSNR because it aids our model to learn essential contextual information to precisely locate TFBS. We applied MACE (Wang et al., 2014) to the ChIP-exo data to identify genome-wide mapping of CTCF binding sites (CBSs). MACE identified total 110 183 CBSs across the whole genome. After investigating the size distribution of those sites, we observed that 59 425 sites’ width was equal to 49 bp in accordance with the previously studied results (Rhee and Pugh, 2011; Wang et al., 2014). Hence, we utilized these 49 bp long TFBSs and added 51 bp flanking regions from two sides to make each sample 100 bp long. The flanking regions provide extra contextual information about TFBS to the model. The test set contains 19 600 randomly selected samples and the rest of the samples were used for training (34 925 sites) and validation (5000 sites). The training, testing and validation samples are strictly non-overlapping.
Each training sample consists of a 100 bp sequence from the human hg19 reference genome and is paired with a label vector of same size indicating TFBS location. To construct training samples, we used the same training and validation set in both training stages with only one difference. While in the first stage, we placed the 49 bp long binding region at position 26–74 bp of a 100 bp input sequence for all the training and validation samples, the binding sites were positioned contiguously anywhere between 10 and 90 bp for the second stage of training. For the 19 600 samples of test set, the input sequences were generated in the same procedure as second stage and we utilized it to assess the performance of DeepSNR only after both stages of training were completed.
We also trained separate DeepSNR models to predict binding location of androgen receptor (AR) and glucocorticoid receptor (GR) TFs. Supplementary Table S1 summarizes the dataset information of these TFs.
3 Results
MatInspector (Cartharius et al., 2005) and MATCH (Kel et al., 2003) are two of the widely used DNA sequence-based computational approaches for determining the location of TFBS. These methods scan input DNA sequences using position weight matrix (PWM) model of the desired TF and assign matrix similarity score (MSS) for each K-mer. After assigning MSS, a cut-off threshold is set to decide putative binding site. To evaluate the effectiveness and efficiency of our proposed approach, we compare the performance of DeepSNR with MatInspector on the CTCF dataset derived from ChIP-exo experiment. Performance comparison analysis with MATCH is elaborated in Supplementary Section where we observed that MatInspector and MATCH perform quite similarly as both the methods rely on motif search for predicting TFBS and this finding aligns with previous studies (Kel et al., 2003).
There are several methods that can also provide base pair resolution prediction of TFBS using ChIP-seq data such as GEM (Guo et al., 2012), PeakZilla (Bardet et al., 2013) and PICS (Zhang et al., 2011). However, all of these methods were designed to identify read-enriched regions from ChIP-seq data and require ChIP-seq read distribution information to predict binding location. For instance, GEM empirically models the likelihood of a set of ChIP-seq reads being generated from a set of protein–DNA binding events. In the process of discovering high resolution binding event, the model generates positional prior utilizing the binding event read count. Contrarily, DeepSNR is designed to identify TF binding region using DNA sequences only and it is not a peak calling method. Therefore, directly comparing the prediction performance of DeepSNR with those methods is not appropriate. Nevertheless, we analyzed the binding event prediction capability of GEM and DeepSNR using an independent ChIP-seq data to exhibit the superiority of our algorithm (Section 3.4).
3.1 Performance evaluation scheme
The goal of the proposed algorithm is to precisely identify the TFBS location from 100 bp long DNA sequence at single bp resolution. That is, for each nucleotide of input sequence, we aim to determine whether the base-pair categorizes to putative binding site or contextual sequence. Hence, we employed Intersection-over-Union (IoU) between ground-truth and predicted location as one of the evaluation metric to assess performance. IoU is very popular in the field of pixel-level image segmentation since it discerns a proposed solution with respect to the ground truth in perceptually meaningful way. We have also compared the performance of DeepSNR and MatInspector in terms of precision, recall and F-Score (Supplementary Section S1).
To assess the efficacy of DeepSNR in regard to the metrics mentioned above, we distinctly tested the performance of each independently trained DeepSNR model for CTCF, GR and AR TFs. Since, our method yields 1/0 for each nucleotide in a sequence, we calculated precision, recall, F-Score and IoU for each of the input sequences individually for further analysis. For CTCF, the whole test set which comprises 19 600 distinct DNA sequences of 100 bp length each was used to estimate the performance of DeepSNR. On the other hand, the performance of MatInspector was assessed slightly differently. When we run MatInspector over 19 600 test sequences with all the parameters set to optimized values as determined by the algorithm, we found that the method was able to detect TFBS only in 2942 sequences. We investigated the missed sequences using MEME (Machanick and Bailey, 2011) and FIMO (Grant et al., 2011) and learned that those sequences contain highly enriched CTCF motifs, albeit a degenerate version. This maybe explains the failure of MatInspector in discovering any binding site for those sequences. However, we used these 2942 sequences to measure the performance of MatInspector and compared the results with DeepSNR which were calculated based on 19 600 test sequences, though it is advantageous for MatInspector algorithm.
3.2 Performance analysis of DeepSNR and MatInspector
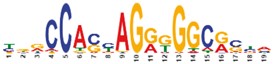
In this section, we comprehensively analyze the performance of DeepSNR and MatInspector using the ground truth TFBSs locations derived from CTCF ChIP-exo dataset. Since, ChIP-exo reports TFBS location at single nucleotide sensitivity, using it as ground truth helps eliminating any ambiguity in performance comparison between different methods. The box plots in Figure 2(a) show median values of evaluation metrics when calculated over all sequences as described in the previous section. It is clear that DeepSNR outperforms MatInspector to a large extent. The median recall of DeepSNR over all test sequences is 91% and it achieves sensitivity greater than 98% for at least 25% of the sequences under consideration. On the other hand, the best recall recorded by MatInspector for any sequence is merely 55%. The large difference in recall score between two methods emphasizes that DeepSNR is very sensitive in locating TFBS at base-pair resolution and it can successfully predict the total width of binding site instead of identifying just the anchor position.
(a) Performance comparison of DeepSNR and MatInspector. (b) Distribution of the distance of center nucleotide for DeepSNR and MatInspector from that of ground truth binding sites
The median specificity of our system against false positives seems to be lower than MatInspector. However, DeepSNR demonstrates a precision higher than 73% for at least 10 000 test sequences whereas the median precision of MatInspector is 81% despite the fact that the statistics was measured across 2947 sequences only. Combining the precision and recall evaluation metrics in the F-Score measure shows that DeepSNR significantly improved the prediction performance of locating TFBSs by 25% compared with MatInspector. Furthermore, DeepSNR accomplishes the F-Score as high as 98% for some of the test sequences. Finally, the DeepSNR has IoU greater than 68% on half of the test sequences while MatInspector achieves a median IoU score of only 40%. The higher IoU of DeepSNR indicates that the method is sensitive enough to recognize nucleotides belonging to true TFBSs without conceding to precision, which is a remarkable feat. This pattern extends to the remaining TFs as DeepSNR outperforms MatInpector by 23.8% and 48.5% respective improvement of IoU for GR and AR (Supplementary Fig. S1). The center position of TFBS is also important for downstream analysis. Hence, we also investigated distance between the centers for predicted sites and the centers of ground truth binding sites of test dataset. As evident from Figure 2(b), the distance density plot for DeepSNR predicted center binding region is highly focused at the vicinity of zero in comparison to MatInspector. We found that DeepSNR displayed distance mean 0.69 bp and SD 10.23 bp while the mean and SD for MatInpector were found to be 1.95 bp and 20.37 bp, respectively (P-value = 2e–5). The narrower peak of DeepSNR illustrates that the center nucleotide of predicted binding sites mostly coincide with the center of true binding site. Overall, these results demonstrate that the proposed deep learning model successfully captures TF-DNA binding interactions and improves the prediction of binding location.
3.3 DeepSNR precisely locates binding motif
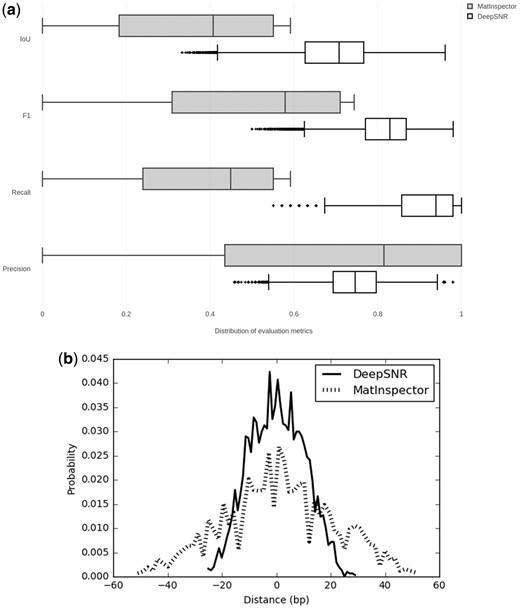
To rigorously understand the significance of the results predicted by the trained DeepSNR model, we investigated the output of max-pooling layer at output network for 19 600 CTCF test sequences. The pooling layer yields 100 scaler numbers (scores) upon which the sigmoid function and a threshold is applied to produce binary outcome corresponding to each base-pair of an input sequence. We surmised that the base-pairs having higher scores may indicate biologically significant nucleotides for TF binding. Hence, mutation map scheme (Alipanahi et al., 2015) was deployed to identify the most significant nucleotide (Ntms) for TF binding (Supplementary Section S3). Then, we assessed distance of Ntms from the nucleotide having maximum score (Ntmax) as computed by DeepSNR or (Ntms – Ntmax). Figure 3(a) shows the histogram of distances measured across 19 600 CTCF test sequences. It is evident from the histogram that in a large portion (57%) of test sequences the nucleotide whose mutation predominantly impacts the binding affinity is positioned at 10–18 bp apart from Ntmax. Interestingly, a previous study showed that nucleotides 4–8 and 10–18 within core motif of a CBS are the most critical determinant for CTCF binding (Plasschaert et al., 2014; Renda et al., 2007). Since the nucleotides maximally influencing the CTCF binding because of point mutations are commonly placed at a distance of 10–18 bp from Ntmax, we deduced that the base achieving maximum score according to DeepSNR (Ntmax) marks the first nucleotide of CTCF binding motif in CBS.
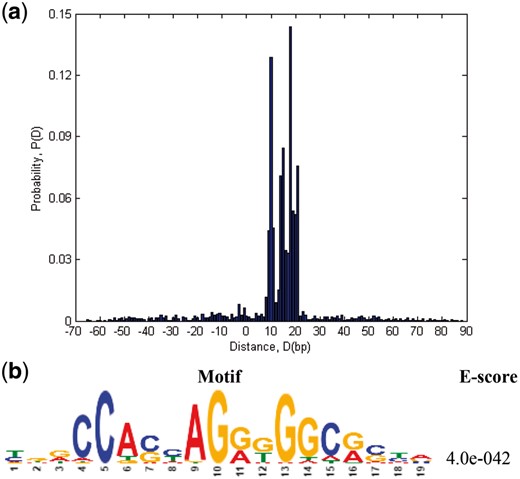
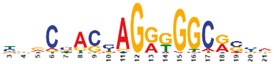
(a) Probability distribution of distance of the most significant nucleotide (Ntms) for TF binding identified by DeepBind from the nucleotide having maximum score (Ntmax) according to DeepSNR. (b) CTCF motif found as highly present in motif enrichment analysis on all test sequences for very short region, only 20 bp downstream from Ntmax
To further validate our implication that Ntmax truly indicates the first nucleotide of CTCF core motif within CBS, we performed motif enrichment analysis using MEME within 20 bp downstream from Ntmax. CTCF binding motifs are known to be ∼20 bp long (Plasschaert et al., 2014; Rhee and Pugh, 2011). Hence, we selected 20 bp only to impose the most stringent criteria in the motif enrichment analysis and we found the CTCF motifs to be highly enriched even with such a short input sequence (Fig. 3b). The result demonstrates that Ntmax indeed denotes the first nucleotide of CTCF motif in a binding site.
3.4 Increasing resolution of ChIP-seq data using DeepSNR
ChIP has emerged as the most widely used assay over the last decade for genome-scale mapping of TF-DNA footprints and gene regulation. Although ChIP-seq method is an effective approach to decode regulatory relationships, it cannot resolve TF-DNA binding interactions at basepair resolution. Generally, size of the binding regions determined from ChIP-seq data are on the order of hundreds of base pairs. Taking advantage of single nucleotide resolution prediction capability of DeepSNR, the specificity of ChIP-seq data can be improved to base pair resolution. Notably, the deep learning model trained for one cell of a particular TF is feasible to be applied on any other cell lines.
To exhibit the performance of DeepSNR on ChIP-seq data, we collected human CTCF ChIP-seq peak calling result for CD4 cell line published in Martin et al. (2011). The ChIP-seq dataset was originally generated by Cuddapah et al. (2009) and the peak calling reports 20 272 peak regions each of which is 400 bp wide. When we applied DeepBind and DeepSNR concurrently on ChIP-seq data (see Supplementary Section S4), DeepBind confirmed CTCF binding in 11 750 peak regions (58% of all peaks). Hence, we restricted our further analysis to these peaks only. For each predicted binding site location by DeepSNR, we calculated the distance between Ntmax (described in Section 3.3) and center of ChIP-seq binding region, the histogram of which is plotted in Supplementary Figure S2. As evident, peak of the histogram is centered around –10 bp which implies that the first nucleotide of CTCF motif and therefore, the binding motif coincides with the ChIP-seq summit for most of the sites. Considering that CTCF motif is ∼20 bp long, center nucleotide of the motif detected by DeepSNR overlaps with ChIP-seq peak. However, for a significant number of ChIP-seq binding region, the binding motif (or binding site) is located far apart from ChIP-seq summit. This precise display of motif distribution within ChIP-seq peak region came into picture owing to the base pair resolution prediction of DeepSNR, which is otherwise not possible to visualize. Since, ChIP-seq summit doesn’t necessarily represent TF-DNA binding location as shown in Supplementary Figure S2, DeepSNR can significantly reduce false positives/negatives in the analysis of ChIP-Seq data that results from consistently choosing the peak center as the putative TFBS. Besides, application of DeepSNR on ChIP seq data delivers an unprecedented knowledge of the span of binding site which is not possible to attain using any motif search based methods.
To verify the credibility of DeepSNR prediction results on ChIP-Seq peaks, we performed independent motif enrichment analysis using nucleotide sequences where DeepSNR predicted ‘1’ and the sequences where it predicted ‘0’ within 400 bp wide ChIP-seq binding region. Table 1 presents the motifs derived from this analysis for CTCF.
The striking difference in E-value (estimated statistical significance of a motif) between the CTCF motifs for positions where DeepSNR predicted protein–DNA binding (column 2) and those where it did not predict any binding (column 3) advocates for the efficacy of DeepSNR in pinpointing the binding location. While the CTCF motifs were identified as significantly enriched (E-values: 10−1132, 10−795) in DeepSNR predicted binding sequences, the enrichment scores were comparatively negligible in rest of the regions (E-values: 10−47, 10−2) demonstrating that DeepSNR is truly effective in predicting putative TF-DNA binding position.
To gauge the supremacy of DeepSNR comparing to the contemporary high resolution peak calling algorithms, we also applied GEM on the same ChIP-seq data (Cuddapah et al., 2009) to predict TF binding event and performed motif enrichment analysis on 61 bp surrounding region as exercised in their original work. As seen in Table 1, GEM also discovers similar motifs as DeepSNR but the enrichment is not as prominent. Though the short motif was significantly enriched, this motif is not a complete representation of CTCF binding event due to missing the critically important nucleotides described in Section 3.3. We realized that the enrichment of this motif is mostly attributed to the incompetence of GEM in capturing the entire width of a TFBS. It is likely that for most of the binding events predicted by GEM, the complete binding site is not fully encompassed within 61 bp region of the center nucleotide, which explains the detection of such shorter motif. We also investigated the role of the most enriched motif identified by DeepSNR which was not discovered by GEM and notably displays weaker enrichment of the second Cytosine. It has been observed in previous studies that methylation of this Cytosine (m5C) drastically reduces the affinity of CTCF binding which could be perished completely by increased methylation (Hashimoto et al., 2017; Renda et al., 2007). Hence, the absence of this Cytosine may prohibit methylation, eventually leading to the higher TF binding activity. We conjectured that identification of this novel motif helps DeepSNR in locating CBSs that will be generally neglected by other methods due to their inability in detecting such motif.
3.5 DeepSNR recognizes functionally active regulatory sequence
TF proteins and DNA interacts with each other to regulate the transcription. One of the major impediments in unravelling the function of TF binding sites is to complement TFBS predictions with a high-throughput experimental approach that directly validates the functional contribution made by transcriptional regulatory motifs (Elnitski et al., 2006). In Whitfield et al. (2012), the authors carried out a large-scale systematic functional analysis, at base-pair resolution, of predicted TF binding sites in four immortalized human cell lines (K562, HT1080, HCT116 and HepG2) by performing transient transfection assays on promoters.
There are 168 functionally verified 16 bp short regulatory sequences reported along with their genomic coordinates across four cell lines for CTCF. We wanted to investigate whether DeepSNR is sensitive enough to recognize these short controlling sequences when it is concealed inside 100 bp long genomic sequence. Therefore, combining adjacent nucleotides from human genome we extended each of these tiny sequences to the length of 100 bp for three instances such that they were placed in three different locations (27–42, 42–57 and 58–73 bp). Next, we applied trained DeepSNR model of CTCF TF on 168 sequences of each separate cases and recorded the nucleotide position of maximum score at the output of second max-pooling layer (Ntmax of Section 3.3). The histogram of Ntmax across 168 sequences of each scenario are plotted in Figure 4 depicting that DeepSNR responds actively to the change of locations of the most critical segment of input sequence required for TF regulation. The peak of histogram plots follows the positioning of the regulatory sequence which illustrates that DeepSNR is very accurate in recognizing the controlling sequence from noisy background sequence.
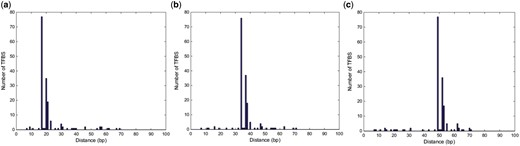
Histograms of distances of 168 experimentally verified 16 bp long regulatory sequences from Ntmax when they were concealed between (a) 27–42 bp, (b) 42–57 bp and (c) 58–73 bp. As evident, histogram peak follows the regulatory sequence validating that DeepSNR is very effective in discerning it from noisy background sequence
More intriguingly, the distance between histogram peak and the first nucleotide of regulatory sequence is 10 bp for all the cases which is reminiscent of the result discussed in previous section. In the process of determining transcriptional activity of a regulatory sequence the nucleotides making the greatest contribution to the TF-DNA binding were mutated such that it abolishes the binding (Whitfield et al., 2012) and transient transfection promoter activity assays were performed later on both wildtype and mutant sequences in order to determine substantial differences in transcriptional mechanism. It implies that the nucleotides pivotal for TF-DNA binding also govern the regulation orchestration of the TF binding site. These nucleotides are eventually part of the binding motif and for CTCF, they are mostly located at 10 bp onwards within the motif sequence. Since, DeepSNR responds very sensitively to the positioning of regulatory (or motif) sequence, the model can play a role in the analysis of TF regulation scheme by locating the regulatory sequence in promoter region.
4 Conclusion
Computational prediction of TF binding location from a genomic sequence remains a substantial challenge for the research community. While in previous decades genetic analyses focused on experimentally discovering TF–DNA binding (ChIP-seq, ChIP-exo, etc.), due to the availability of deep sequencing the search using computational methods has meanwhile become a research focus. We developed DeepSNR, a deep learning framework to identify TFBS which performs better than sequence based approaches because it automatically learns the dependencies between nucleotides at different positions within the binding site description. DeepSNR is accomplished by successfully combining several technologies such as deconvNet, DeepBind and ChIP-exo that have been proved to achieve ground-breaking performance in their respective domain. In addition, this is the first application of deconvNet to address a computational biology problem. The proposed model determines TFBS at base-pair resolution with high precision and recall which makes it suitable to discover regulatory sequences and to improve the specificity of ChIP-seq data. Currently, the state-of-the art methods for determining functional importance of TF utilize PWMs to identify regulatory (or motif) sequence as one of the initial procedures (Whitfield et al., 2012). It is not surprising that regulatory sequences derived using such technique exhibit highly different success rates in modeling TF-DNA binding. We have shown that DeepSNR responds very sensitively to the position of regulatory sequences when hidden at various places inside noisy background sequence. Therefore, instead of relying on PWM, DeepSNR can be applied to identify the location of regulatory sequence.
Because of the limited availability of ChIP-exo data and to ensure wide applicability of DeepSNR, we focused on training the model with lone TF on every occasion. However, predicting the binding location of multiple TFs simultaneously is an area that worth exploration in future. It can be expected that prediction of multiple TFs’ altogether might lead us to fully understand gene regulation and concurrent expression of genes as observed in expression array analysis.
Funding
National Institutes of Health [GM113245-01 to Y.H.].
Conflict of Interest: none declared.
References

