


Abstract
Multiple Reaction Monitoring (MRM)-based targeted proteomics is increasingly being used to study the molecular basis of disease. When combined with an internal standard, MRM allows absolute quantification of proteins in virtually any type of sample but the development and validation of an MRM assay for a specific protein is laborious. Therefore, several public repositories now host targeted proteomics MRM assays, including NCI’s Clinical Proteomic Tumor Analysis Consortium assay portals, PeptideAtlas SRM Experiment Library, SRMAtlas, PanoramaWeb and PeptideTracker, with all of which contain different levels of information.
Here we present MRMAssayDB, a web-based application that integrates these repositories into a single resource. MRMAssayDB maps and links the targeted assays, annotates the proteins with information from UniProtKB, KEGG pathways and Gene Ontologies, and provides several visualization options on the peptide and protein level. Currently MRMAssayDB contains >168K assays covering more than 34K proteins from 63 organisms; >13.5K of these proteins are present in >2.3K KEGG biological pathways corresponding to >300 master pathways, and mapping to >13K GO biological processes. MRMAssayDB allows comprehensive searches for a targeted-proteomics assay depending on the user’s interests, by using target-protein name or accession number, or using annotations such as subcellular localization, biological pathway, or disease or drug associations. The user can see how many data repositories include a specific peptide assay, and the commonly used transitions for each peptide in all empirical data from the repositories.
Supplementary data are available at Bioinformatics online.
1 Introduction
Targeted proteomics has become the method of choice for protein quantification which can be used to reproducibly quantitate large sets of proteins in a high-throughput manner, up to hundred proteins in 45 min (Keshishian et al., 2009; Percy et al., 2014; Picotti et al., 2013). Targeted proteomics methods are typically performed using triple quadrupole in the Multiple Reaction Monitoring (MRM) mode, or using Orbitrap mass spectrometers in the Parallel Reaction Monitoring (PRM) mode. In an MRM experiment, the first quadrupole is used to isolate a particular precursor peptide ion, the second quadrupole is used for collision-induced dissociation, and the third one is used to isolate a characteristic fragment ion. In PRM, only the last step differs in that all ions are monitored. In scheduled LC/MRM-MS analysis, specific precursor/product ion pairs are monitored while the peptide is eluting from the liquid chromatography system, which allows quantitation of a large number of peptides and, by inference, the corresponding proteins (Mohammed et al., 2014).
Designing and validating a new MRM/PRM assay is a laborious process. It is a multistep workflow that, in addition to performing wet-laboratory experiments, requires integration of prior knowledge with experimental data. This information includes for example the uniqueness of the proxy peptide (surrogate for a protein of interest) within a particular proteome, its retention time under specific LC conditions, the corresponding precursor/fragment ion pairs and more. The very first step in the assay design workflow is a good example of the challenges that one can face. Selecting the most suitable MRM peptide from a target protein includes enforcing almost 30 rules (Mohammed et al., 2014), where an important aspect is whether a peptide has been previously observed in MS/MS analyses and thus is known to be detectable—and this type of data can be found in several online public repositories (Liebler and Zimmerman, 2013).
There is no doubt that sharing already designed and validated targeted proteomics assays can save a lot of work for scientists and researchers planning to perform MRM or PRM experiments. Well-established resources for MRM-based targeted proteomics data include: PeptideAtlas SRM Experiment Library (PASSEL) (Farrah et al., 2012), NCI’s Clinical Proteomic Tumor Analysis Consortium (CPTAC) (Whiteaker et al., 2014), PanoramaWeb (Sharma et al., 2014), SRMAtlas (Kusebauch et al., 2016) and PeptideTracker (Mohammed et al., 2016). New entries are added constantly to these repositories by different groups, whereas some repositories are specific like CPTAC which hosts mainly tumor assays, others are more generic for any targeted proteomics experiment like PASSEL. Some repositories store the raw data like PanoramaWeb, while others put emphasis on including the full sample preparation protocols like CPTAC and PeptideTracker. Also, for some protein entries, PeptideTracker lists the determined protein concentration ranges in samples, as measured by MRM.
PASSEL is a generic data repository from the Institute of System Biology. New MRM experimental results and the corresponding raw data can be submitted by the user (Farrah et al., 2012), (www.peptideatlas.org/passel/), which—along with the corresponding internally-processed results—are made available to the research community.
The assay portal of CPTAC (Whiteaker et al., 2014) from the National Cancer Institute (NCI), (http://assays.cancer.gov), serves as an open-source repository of well-characterized targeted proteomic assays. Its main goals are to enable robust quantification of all human proteins and to standardize the quantification of targeted MS-based assays (Whiteaker et al., 2016). Submission to the portal is done by the consortium partners.
PanoramaWeb (Sharma et al., 2014) is an online resource for storing, sharing and analyzing targeted proteomic experiment processed by Skyline software (MacLean et al., 2010). The PanoramaWeb repository (https://panoramaweb.org) provides a detailed view for the peptide, including chromatograms for the precursors in of all the replicates and also plots the peak area integrations.
PeptideTracker (Mohammed et al., 2016) (http://peptidetracker.proteincentre.com) was introduced as a knowledge base that is designed for collecting and storing information on protein concentration ranges in biological tissues along with the detailed description of the assays that were used. The information in PeptideTracker has been compiled from different experiments, along with the acquisition protocols and conditions used. While submission of new data is possible, the listed assay entries are mainly for human and mouse tissues due to the work history of the group behind PeptideTracker.
Because these data repositories and knowledge bases on targeted proteomics assays were introduced with different goals in mind, it is understandable that the information hosted is heterogeneous. In this context, MRMAssayDB provides the first tool to obtain comprehensive information on all available targeted proteomics assays in all of these community-wide online resources.
2 Materials and methods
2.1 MRMAssayDB data collection
Currently, MRMAssayDB is populated with MRM-based targeted proteomics assay data from PASSEL (Farrah et al., 2012), CPTAC (Whiteaker et al., 2014), PanoramaWeb (Sharma et al., 2014), SRMAtlas (Kusebauch et al., 2016) and PeptideTracker (Mohammed et al., 2016). Ultimately, the goal is to combine data that resides in different targeted proteomics repositories, and provide users with a unified view of available targeted proteomics assays.
MRMAssayDB keeps various information on the protein assays including UniProtKB accession number (UniProt_Consortium 2011), protein name, gene name, organisms, peptide sequence, uniqueness in the proteome, peptide presence of isoforms, labeled internal standard used and, importantly, a hyperlink of each entry to the relevant targeted proteomics resources from which the information was obtained (Supplementary Fig. S1). The datatables in MRMAssayDB are updated periodically. For this, new data from all five repositories is retrieved, matched with UniProtKB (UniProt_Consortium 2011) and other databases, and compiled automatically on a monthly basis. The uniqueness of the peptide to the target protein is re-assessed in each compilation as it may change with the discovery of new proteins. Here, a ‘unique peptide’ means that its sequence is present only in the specific protein and/or its isoforms, and both these levels are annotated. This means that users have available to them information on whether a peptide assay can be used to quantify a specific isoform, or whether it can be used to test if a gene model with any splice isoform is expressed at the protein level.
2.2 Search functionality
Because of the richness of the collected data, having a good search algorithm is essential. MRMAssayDB allows searching the assays and filtering as well as downloading the search results in various ways, based on the user’s interest. The assays can be searched based on partial protein name, protein accession, partial peptide sequence, biological pathway involvement, or involvement in disease (Fig. 1). After the search results are present on the screen, additional filters can be applied to each column, columns can be blended and viewed, and a final report of the search results can be downloaded. MRMAssayDB also provides an advanced search option where multiple search terms specific to different data types can be combined, e.g. protein name and subcellular location, or gene name, organism and biological pathway. It is recommended that users use the advanced search function whenever possible because combined queries limit the volume of data that has to be loaded, and thereby improve responsiveness.
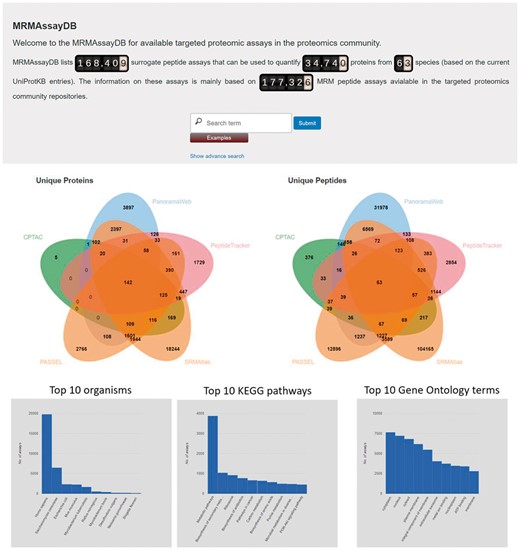
MRMAssayDB homepage with simple and advanced search functionalities, along with some statistics on its content
2.3 Domain, post-translational modifications and disease-causing mutations
Mutations and post-translational modifications (PTMs) are important in the study of health and disease, and more data is continuously becoming available on the positions of disease-related mutations and PTMs on the protein (Lam et al., 2016; Nehrt et al., 2012). While the majority of MRM/PRM targeted proteomics assays are based on non-modified peptides, it is important to have updated information on whether the proxy peptide selected carries a mutation or PTM, or not. We have combined data on known disease-causing mutations and PTMs, and mapped it to the assays in MRMAssayDB. To visualize the variations, PTMs and important UniProtKB features, we have added a recently-released visualization tool, ProtVista (Watkins et al., 2017), that shows the proxy peptide, protein sequence features in the UniProtKB, experimental proteomics and variation public datasets (Fig. 2). The functional, positional and variant information was obtained from the EBI Protein API (Nightingale et al., 2017).
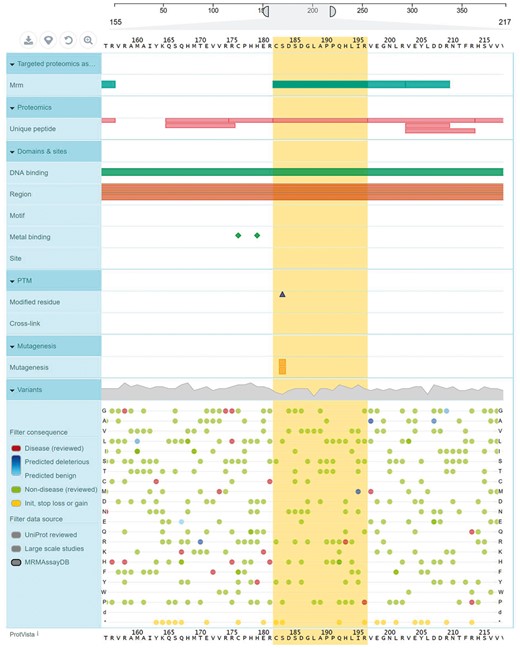
A visual representation of a protein and its MRM peptide assays along with other annotations displayed in MRMAssayDB. The example in the figure is from cellular tumor antigen p53 protein (P04637) showing UniProtKB features, experimental proteomics and variants obtained from public datasets using the EBI ProtVista tool after extending it with MRMAssayDB data
2.4 Structural data
In targeted proteomics methods that are based on surrogate or proxy peptides, it is sometime of interest to know the exact position of the peptide in the 3D structure of the protein. Therefore, 3D protein struc-tures in the unbound (free) and bound (complex) states that include the particular peptide have been extracted from Protein Databank (PDB) (Berman et al., 2002). PDB structures were selected using two criteria: (i) the constructs used for the structure determination experiment contained the peptide sequence of interest, and (ii) there is visible electron density for the peptide. IUPred (Dosztányi et al., 2005) software was used to predict the structural disorder, and IUPred outputs scores (ranging between 0 and 1) are included for each residue; with scores that are >0.5 indicating disordered residues (the ‘short’ mode of IUPred was used) (Supplementary Fig. S2A–E).
2.5 Biological pathways
MRMAssayDB maps all available assays to the entries in the KEGG pathway database (Kanehisa and Goto, 2000), and extracts and displays the entire network of which the assay is a part. The genes or proteins in the pathway maps are color coded, with violet indicating the assay that the user searched for in MRMAssayDB, and maroon and orange indicating that there is an assay available for a protein or gene, while rectangular green boxes represent genes or proteins in the pathway without assays in MRMAssayDB. All color-coded boxes are linked to the data in MRMAssayDB via hyperlinks. With one single interactive plot, the user can see the coverage of the biological pathway using available assays (Fig. 3A).
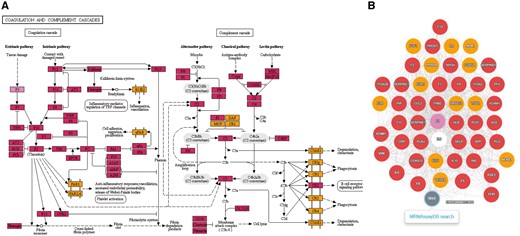
Pathway and PPI Viewer in MRMAssayDB. (A) An example of Complement and Coagulation cascades for tissue factor protein (gene name F3) from the KEGG database. (B) Protein–protein interaction network of the F3 gene. All nodes in (A) and (B) can be searched for targeted assays in MRMAssayDB via the web interface, using a single click
2.6 Protein–protein interactions
For each assay, MRMAssayDB extracts the known protein–protein interactions from the STRING database (Szklarczyk et al., 2015). The same color-coding scheme for pathway analysis was used when mapping the genes or proteins onto the protein–protein-interaction network, while white boxes represent non-mapped genes in the interactome (Fig. 3B).
2.7 Functional data
MRMAssayDB links the targeted proteomics protein assays to the functional data annotations for the protein as represented in the Gene Ontology (GO) annotations from the QuickGO (Binns et al., 2009) web-based portal (Supplementary Fig. S3). This functional data includes information on the three most general GO terms: Biological Process, Molecular Function and Cellular Component. Briefly, Molecular Function explains what a gene product does at the biochemical level. Biological Process explains a broad biological objective. Cellular Component defines the location of a gene product, within cellular structures and within macromolecular complexes (Gene_Ontology_Consortium 2011).
2.8 Implementation
All the routines in MRMAssayDB are written in the Python 2.7 programming language (www.python.org). The user web interface was developed using the Django 1.8 framework (https://djangoproject.com), and displays plots are generated on the fly using JavaScript. JSmol is used to visualize the 3D protein structures interactively (http://wiki.jmol.org/index.php/JSmol#JSmol). We preferred JSmol over Jmol because JSmol is a JavaScript applet and does not require any Java (popup window) authorization. Jvenn (Bardou et al., 2014) and Cytoscape.js (Franz et al., 2016) were used to plot the interactive Euclidean diagrams (Fig. 1) and PPI networks (Fig. 3B), respectively. The metadata from PASSEL (Farrah et al., 2012), CPTAC (Whiteaker et al., 2014), PanoramaWeb (Sharma et al., 2014), SRMAtlas (Kusebauch et al.), PeptideTracker (Mohammed et al., 2016), UniProt (UniProt_Consortium 2011), PDB (Berman et al., 2002), KEGG (Kanehisa and Goto, 2000), STRING (Szklarczyk et al., 2015) and QuickGO (Binns et al., 2009) are automatically retrieved using routines written in Java (www.oracle.com/java/index.html), Python and Selenium Webdriver (http://www.seleniumhq.org).
3 Results
MRMAssayDB captures various types of data and information from MRM/PRM experiment repositories as well as proteomic and pathway information from targeted proteomics assays, and makes all linked information accessible through a single web interface. Our system provides up-to-date information on thousands of targeted proteomics assays. Currently, entries for 168 404 peptide assays are included, covering more than 34 740 proteins from 63 species (Table 1). These proteins correspond to 13 102 biological processes, 4886 molecular functions, and 1929 cellular components. Supplementary Figure S4 shows this trend exemplified in the top GO terms for human proteins. As of March 2018, PanoramaWeb (Sharma et al., 2014), CPTAC (Whiteaker et al., 2014), SRMAtlas (Kusebauch et al.) and PASSEL (Farrah et al., 2012), and PeptideTracker (Mohammed et al., 2016) contain information on thousands of assays with transitions for the labeled and label-free forms of the peptide (Table 2). While each of the five resources was developed for a specific goal, the information hosted by them is complementary (Fig. 1), and together they form a valuable foundation for MRM based targeted proteomics.
The five organisms with the highest number of entries in MRMAssayDB (March 2018)
| Organism name | Number of unique peptide assay entries |
|---|---|
| Homo sapiens (human) | 101 613 (covering 19 777 proteins) |
| Saccharomyces cerevisiae (yeast) | 47 946 (covering 6478 proteins) |
| Escherichia coli | 3420 (covering 2363 proteins) |
| Mus musculus (mouse) | 5327 (covering 2304 proteins) |
| Mycobacterium tuberculosis | 5892 (covering 1681 proteins) |
| Others | 4211 (covering 2137 proteins) |
| Total | 168409 (covering 34740 proteins) |
Assays in the targeted proteomics repositories
| Database name | Number of unique peptide assay entries |
|---|---|
| CPTAC | 1405 assay covering 808 proteins |
| PanoramaWeb | 41 998 assay covering 8625 proteins |
| PASSEL | 20 496 assay covering 7553 proteins |
| PeptideTracker | 5640 assay covering 3281 proteins |
| SRMAtlas | 118 098 assay covering 25914 proteins |
The information on these 168K proteotypic peptide assays is based on the 177 327 MRM assays currently available in the targeted proteomics community repositories. The difference in the numbers is due to assays that are not unique to the proteome of a specific organism (using UniProtKB as the reference). A user can nevertheless use the advanced search function to upload his own protein sequences in FASTA format, and all 177K assays will be searched and suitable proteotypic peptide assays will be reported in the results.
Because MRMAssayDB uses an integrative approach and maps data from multiple repositories, it allows a new view of every assay and shows how many data repository a particular assay is in. For example one protein may have multiple proteotypic peptide assays already developed, validated, and in used. The proteotypic peptide which has been successfully used by the largest number of users would probably be a good choice if one is interested in simple quantification of the protein. In addition, MRMAssayDB lists the most common transitions for each peptide MRM assay. Keeping in mind that all transitions originate from actual validated assays used in one or more laboratory, the most commonly used transitions are those ions which appearing most frequently in the assays for a specific surrogate peptide. Although there may be various ways of determining the ‘best’ transitions—e.g. those with the highest intensity, best peak shape, or fewer interferences, we assume that if various scientists have followed various methods to determine the transitions and validate them in actual experiments, then the best transitions will be those that appear most frequently in various experiments. Keeping in mind that the user can sort and filter any column in the MRMAssayDB results datatable, the user can, for example, identify the most commonly used assay for a specific protein and its best transitions with only few clicks.
Not all of the assays in the online repositories are based on unique peptides in the proteome. Therefore, for all peptides that are included in the MRMAssayDB, a uniqueness test is performed and the results are reported next to each peptide. Currently 93% of all assays are based on unique peptides (Table 3). Using the EBI standard tool for the graphical representation of protein sequence features—ProtVista tool (Watkins et al., 2017), the proxy peptide of the target protein can be compared to the various protein-sequence features in UniProtKB, and experimental proteomics and sequence variation data. As example of the human protein P53_HUMAN which functions as a tumor suppressor (25) is shown in Figure 2, and one can see that the proxy peptide (residues 182–196) contain a modified residue and two disease-causing mutations.
Assay specificity to protein isoform based on repository data
| Database name | Peptide uniqueness in proteome (%) | Peptide is specific to one protein isoform (%) |
|---|---|---|
| CPTAC | 97.30 | 48.93 |
| PanoramaWeb | 95.65 | 95.41 |
| PASSEL | 96.38 | 82.15 |
| PeptideTracker | 95.65 | 67.12 |
| SRMAtlas | 78.21 | 60.23 |
| Overall | 92.64 | 70.77 |
| Database name | Peptide uniqueness in proteome (%) | Peptide is specific to one protein isoform (%) |
|---|---|---|
| CPTAC | 97.30 | 48.93 |
| PanoramaWeb | 95.65 | 95.41 |
| PASSEL | 96.38 | 82.15 |
| PeptideTracker | 95.65 | 67.12 |
| SRMAtlas | 78.21 | 60.23 |
| Overall | 92.64 | 70.77 |
The protein structure viewer facilitates the exploration and visualization of 3D protein structures and allows the user to visualize the region of origin of the proxy peptide. This allows the user to visually explore whether the surrogate peptide originated from the surface or was embedded deeper in the folded protein, or whether the peptide formed part of an alpha helix or a beta sheet. In case of multiple peptide assays for one protein, the user can choose an assay based on the specific region of the proxy peptide in the 3D structure of the protein. An example showing ubiquitin-like ISG15 protein and its assay using the surrogate peptide LAVHPSGVALQDR is presented in Supplementary Figure S2.
From all entries in MRMAssayDB, we were able to map a total of 13 568 proteins to 384 KEGG master biological pathways. Figure 4 shows a few examples of these pathways, such as the P13K-AKT signalling pathway in humans which includes 524 proteins of which 342 are present with assays in MRMAssayDB, the KEGG pathways in cancer for which there are 522 assays available for human (Fig. 4). Figure 4 provides an insight into how the integrative approach of combining the five major targeted-proteomics assay repositories can provide improved coverage compared to an individual repository. Approximately only two-third of all human proteins are currently associated with metabolic pathways (based on entries retrieved from KEGG and UniProtKB in March 2018). Using the information in MRMAassayDB on the protein in volvement in biological pathways, assays can be chosen and used to further characterize existing pathways, or—as not all proteins are present in KEGG—an assay can be chosen to find new undocumented involvement of a protein in a pathway. For pathway visualization, all nodes (genes/proteins/enzymes) can be interactively used, as they are hyperlinked to each corresponding entry and are color-coded and highlighted on the pathway graphs (Fig. 3A).
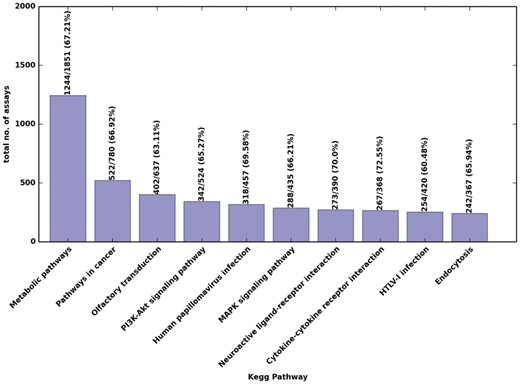
Top 10 KEGG pathways with targeted proteomics assays in humans. Above each bar is the number of proteins with assays in MRMAssayDB, the total number of proteins corresponding to that pathway, and—in parentheses—the corresponding percent coverage
As the amount of available protein–protein interaction data increases, it is common for researchers to analyze their proteins of interest as a part of a system of dynamic interactions. The protein–protein interaction network of each assay in MRMAssayDB is displayed using the Cytoscape Web application (Franz et al., 2016). The network can be obtained from the search-results table (Supplementary Fig. S1). The color-coded network (See Section 2) (Fig. 3B) provides helpful insights into the available targeted proteomics assay for which interaction.
MRMAssayDB also maps all entries to their Gene Ontology annotation. The current assays map to 13102 biological processes, 4886 molecular functions, and 1929 cellular components. Most of the available assays for human samples are associated with G-protein coupled receptor signaling pathway (99%) and signal transduction (99.5%). On one hand, this indicates the possibility of using the assays collected in MRMAssayDB to characterize diverse biological process (Supplementary Fig. S4), and, on the other hand, it shows the preferences in the targeted proteomics community toward developing assays to characterize biological processes. The majority of the molecular functions and cellular components were associated with protein binding and cytosol (Supplementary Fig. S4).
4 Conclusions
MRMAssayDB is a freely available web-based resource for accumulating available targeted proteomics assays in the community. It retrieves information from five major MRM and PRM targeted-proteomics assay portals, and the data repositories: PASSEL, PanoramaWeb, CPTAC assay portal, SRMAtlas and PeptideTracker. The collected information is integrated and annotated with additional information on the involvement of biological pathways, protein–protein interaction, Gene Ontology terms, known PTMs and disease-associated mutations, disease involvement, etc. MRMAssayDB will help scientists and researchers attempting to perform a targeted proteomics experiment to easily find the suitable assay and will accelerate sharing the assays between scientists.
MRMAssayDB shows how many data repositories reported each assay, allowing results to be sorted and enabling the user to immediately see which assay was used successfully by most users. Furthermore, for each MRM peptide assay, the common transitions appearing most frequently in all available assays from different repositories and instruments are listed. Users can also upload own protein sequences to search for suitable existing assays.
The application combines the strengths of Java, Python, Ajax, JavaScript, Selenium Webdriver and Django with a suite of integrated bioinformatics tools. Ultimately, MRMAssayDB supports basic and advanced search queries, as well as the possibility of filtering and sorting the search results. The software has also an advanced Application Program Interface allowing a query to be sent in an automated manner. As new datasets become available, we intend to continue to integrate them into the database. The data entries are updated automatically at the beginning of each month.
MRMAssayDB is unique in both its integrative approach and the comprehensiveness of information provided on the available targeted-proteomics assays in the community–wide online resources. The type of empirical, detailed information included in this tool for each peptide is required and essential for the planning of MRM experiments. Access to the software is available free of charge, at http://MRMAssayDB.proteincentre.com/.
Acknowledgements
C.H.B is grateful for support from the Leading Edge Endowment Fund, for support from the Segal McGill Family Chair in Molecular Oncology at the Jewish General Hospital (Montreal, Quebec, Canada), and for support from both the Warren Y. Soper Foundation and the Alvin Segal Family Foundation at the Jewish General Hospital (Montreal, Quebec, Canada). Y.M. thanks LUMC for support. The authors thank Dr. Carol Parker for editing.
Funding
This work was supported by a Science and Technology Innovation Centre grant from Genome Canada and Genome British Columbia, and by support to the University of Victoria - Genome British Columbia Proteomics Centre through Genome Canada and Genome British Columbia’s Genome Innovations Network (204PRO for operations; 214PRO for technology development) and Genome Canada and Genome British Columbia's Genomics Technology Platform (264PRO).
Conflict of Interest: C.H.B. is the CSO of MRM Proteomics, Inc. The other authors declare no conflict of interest.
References
Author notes
The authors wish it to be known that, in their opinion, the first two authors should be regarded as Joint First Authors.

