


Abstract
Datasets that are derived from different studies (e.g. MHC ligand elution, MHC binding, B/T cell epitope screening etc.) often vary in terms of experimental approaches, sizes of peptides tested, including partial and or nested overlapping peptides and in the number of donors tested.
We present a customized application of the Immune Epitope Database’s ImmunomeBrowser tool, which can be used to effectively aggregate and visualize heterogeneous immunological data. User provided peptide sets and associated response data is mapped to a user-provided protein reference sequence. The output consists of tables and figures representing the aggregated data represented by a Response Frequency score and associated estimated confidence interval. This allows the user to visualizing regions associated with dominant responses and their boundaries. The results are presented both as a user interactive javascript based web interface and a tabular format in a selected reference sequence.
The ‘ImmunomeBrowser’ has been a longstanding feature of the IEDB (http://www.iedb.org). The present application extends the use of this tool to work with user-provided datasets, rather than the output of IEDB queries. This new server version of the ImmunomeBrowser is freely accessible at http://tools.iedb.org/immunomebrowser/.
1 Introduction
Datasets that are derived from different studies (e.g. MHC ligand elution, MHC binding, B/T cell epitope screening etc.; Li Pira et al., 2010) will often vary in terms of the experimental approaches used, the size of peptides that were tested and in the number of donors tested.
To enable simplified visualization of the aggregated data present in the Immune Epitope Database (IEDB), we implemented the application called the ‘ImmunomeBrowser’ in the IEDB (Vita et al., 2015). This tool aggregates all data relevant to the user query and allows one to visualize the known immune response to a specific antigen, as well as illustrating knowledge gaps in a reference protein. It provides the immune reactivity in terms of response frequency (RF) and the number of subjects tested/responded and/or number of independent assays performed along the length of reference protein. The tool was originally implemented in the results page of the database section of the IEDB. To further extend the usability to predicted epitopes and propriety epitopes or non-IEDB data, the online tool described herein was developed.
The utility of the approach was demonstrated by Kim et al. who performed a meta-analysis of Hepatitis C virus (HCV) data available in the IEDB, to present a bigger picture of the immune reactivity and knowledge gaps in the reference protein sequences of the virus (Kim et al., 2012).
Currently, the Immunomebrowser can only be used with data derived from IEDB queries, and not with user datasets. To overcome this problem, we implemented the ImmunomeBrowser as a stand-alone tool to allow users to analyze and visualize immunodominant regions within their own dataset.
2 Materials and methods
2.1 Data input
The user provides peptide sequences, the response data for each, the protein sequence/s of interest and their desired sequence identity threshold in specified formats. The peptide response can be either pasted or uploaded as a file in whitespace separated format with three columns, corresponding to peptide sequence, number of subjects tested and/or number of assays performed, and the number of subjects responded and/or number of assays resulting in a positive response. In cases, where the number of subjects tested or responded or assays performed are not provided, the program will automatically fill in a value of ‘1’ for the number of subjects tested or assays performed, as well as for the number of subjects responding or positive assays. Protein sequences/s must be provided in ‘Fasta’ format and sequence identity is selected from a drop-down menu that varies from 10–100% with an interval of 10%.
2.2 Mapping of epitopes
Each peptide is mapped to a user provided reference protein sequence according to the provided identity threshold. The degree of identity is calculated based on the alignment of the peptide within reference sequence. Only peptides with sequence identity above the threshold are selected for further calculations.
2.3 RF and confidence interval calculations
A Confidence interval (CI) is calculated to weight the RF reliability as a function of the number of subjects tested. CI is calculated using the binomial cumulative distribution function and Wilson score.
For small small sample sizes (N < 50), lower and upper bounds are calculated using binomial cumulative distribution function.
2.4 Aggregation of RF data from different overlapping peptides
Aggregation of data is required to identify the most frequently recognized epitopes, which can reflect the overall frequency of recognition of peptide sequence containing a given residue. This approach is useful to identify the RF at each position in the reference sequence. To calculate the aggregated RF data, the number of subjects tested and/or assay performed and number of subjects responded and/or number of assays resulted a positive response were summed up for each mapped position in a given source protein. The CI of RF is calculated using the equations described above.
2.5 Result display
The results are presented in two steps, where the first step provides the summary of epitopes and assays mapped back to the reference protein sequence (Fig. 1).
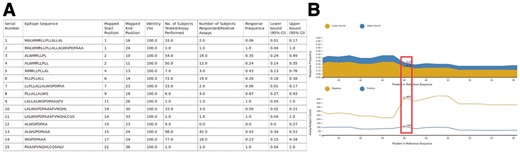
Screenshots for the example output of the customized application of ‘ImmunomeBrowser’. (A) Tabular format listing all the different epitopes mapped to the given reference protein sequence. (B) Area plot for upper and lower bound CI for RF. The line plot shows the number of positive and negative assays or number of responder and not-responder subjects along the positions in reference protein. Hovering the mouse over any position in the reference protein in any of these plots will display the lower and upper bounds of the RF and number of assays/subjects count found as positive and negative (as shown in red rectangle)
For each protein, a table lists all the epitopes, its mapped position, the number of subjects responded/positive assays, the number of subjects tested/assays performed and the RF along with its upper and lower bounds at 95% CI (Fig. 1A). The second step provides the aggregate plot of the mapped RF for each region of the reference protein, in two different plots representing the cumulative RF (upper and lower bound of RF) and total number of results (positive and negative) along the length of the selected reference protein (Fig. 1B).
3 Applications
The customized application of the ImmunomeBrowser lends itself to several applications. As mentioned above, Kim et al. has performed a meta-analysis of HCV data available in the IEDB, (Kim et al., 2012; Vita et al., 2015). The tool can now be utilized by users to collate and perform meta-analysis of data generated in multiple related studies. For example, the ImmunomeBrowser can be applied to natural ligand elution data containing largely overlapping peptides, and which are studied in different donors expressing different HLA molecules (Schellens et al., 2015; Shastri et al., 2002). For this purpose, the data needs to be combined for response frequencies from different donors and for each HLA molecule (Alvarez et al., 2018). In this context, Vaughan et al. analyzed naturally processed data curated within the IEDB to characterize the overall general features of the known processed data and to highlight existing knowledge gaps (Vaughan et al., 2017). The Immunomebrowser is also useful to analyze the immunogenicity testing of therapeutic proteins, where the overlapping peptides from a therapeutic protein are tested for immunogenicity to evaluate the unwanted immune response (Asgari et al., 2015; Dhanda et al., 2018; Jawa et al., 2013; Salvat et al., 2017). The Immunomebrowser, can thus aggregate the immune response data from different peptides and/or peptide analogs spanning through the length of the specified reference protein, even when tested in different donors and derived from different clinical studies. This allows users to easily view their data in a more meaningful and useful manner.
Acknowledgement
The authors acknowledge the support from Jason Greenbaum and Jason Yan at La Jolla Institute for Allergy and Immunology in implementation of the tool.
Funding
This work was supported by funds from the National Institute of Allergy and Infectious Diseases, National Institute of Health, under Contract No. HHSN272201200010C.
Conflict of Interest: none declared.
References

