


Abstract
Lysine acetylation exists extensively in prokaryotes, and plays a vital role in function adjustment. Recent progresses in the identification of prokaryote acetylation substrates and sites provide a great opportunity to explore the difference of substrate site specificity between prokaryotic and eukaryotic acetylation. Motif analysis suggests that prokaryotic and eukaryotic acetylation sites have distinct location-specific difference, and it is necessary to develop a prokaryote-specific acetylation sites prediction tool.
Therefore, we collected nine species of prokaryote lysine acetylation data from various databases and literature, and developed a novel online tool named ProAcePred for predicting prokaryote lysine acetylation sites. Optimization of feature vectors via elastic net could considerably improve the prediction performance. Feature analyses demonstrated that evolutionary information played significant roles in prediction model for prokaryote acetylation. Comparison between our method and other tools suggested that our species-specific prediction outperformed other existing works. We expect that the ProAcePred could provide more instructive help for further experimental investigation of prokaryotes acetylation.
Supplementary data are available at Bioinformatics online.
1 Introduction
Lysine (K) acetylation is an essentially reversible and highly regulated post-translational modification (PTM) that has been shown to occur in many protein targets, including core histones, approximately 40 transcription factors and over 30 other proteins (Vidali et al., 1968; Yang, 2004). Of the known PTM, lysine acetylation has the capacity to destabilize the chromatin polymer through charge neutralization of the basic lysine residues, potentially harboring structural consequences for higher-order chromatin structures (Taverna et al., 2007; Verreault et al., 1998). This scenario is not only crucial in the nucleus but also important for regulating different cytoplasmic processes, including cytoskeleton dynamics, energy metabolism, endocytosis and even signaling from the plasma membrane (Yang and Seto, 2008). Recently, increasingly more experimental observations have suggested that amino acid variations could indirectly or directly influence the original acetylation sites. For example, Iwasaki et al. (2011) investigated the mutations of eight lysine residues which were known to be targets for acetylation in Homo sapiens histones H3 and H4. They found some of these amino acid substitutions altered the local protein-DNA interactions and the interactions between amino acid residues within the nucleosome, which could affect chromatin structure and function and consequently cause related disease. Thus, knowledge of lysine acetylation sites can be very helpful in drug design for various related diseases.
A lot of experimental approaches, such as mass spectrometry-based experiments, radioactive chemical method and chromatin immunoprecipitation, have been used to identify lysine acetylation sites (Medzihradszky, 2005; Umlauf et al., 2004; Welsch and Nelsestuen, 1988). However, the conventional experimental identification of lysine acetylation substrates is usually expensive and time consuming. Therefore, computational prediction is desirable and necessary. By combing experimental methods with clustering analysis, Basu et al. (2009) constructed a tool named as PredMod to predict acetylation based on the sequence characteristics. Li et al. (2012) developed the acetylation set enrichment based computer program to predict lysine (K)-acetyl-transferase-families-specific acetylation site. On the basis of logistic regression classifiers and different biological features, Hou et al. (2014) proposed a predictor called LAceP for lysine acetylation prediction. Li et al. (2014) developed a method termed as SSPKA for species-specific lysine acetylation prediction by using random forest classifiers. The majority of the rest of these methods, such as LysAcet (Li et al., 2009), N-Ace (Lee et al., 2010), EnsemblePail (Xu et al., 2010), Phosida (Gnad et al., 2010), PLMLA (Shi et al., 2012), PSKAcePred (Suo et al., 2012), BRABSB (Shao et al., 2012) and KA-predictor (Wuyun et al., 2016), have been carried out with support vector machines (SVM) classifiers based on different feature extraction. Taken together, most of the predictors were not species-specific models or were only designed for eukaryote acetylation. SSPKA and KA-predictor were developed for eukaryote and prokaryote acetylation sites which included two prokaryote species Escherichia coli (E. coli) and Salmonella typhimurium (S. typhimurium), and their results indicated that species-specific prediction can effectively promote the prediction performance.
Recent progresses in the identification of prokaryote acetylation substrates and sites provide a great opportunity to explore the difference of substrate site specificity between prokaryotic and eukaryotic acetylation. We collected 7288 non-redundant prokaryotic acetylation sites across nine different species from the databases and relevant literature (Section 2.1), and 29 930 non-redundant eukaryotic acetylation sites from 6077 Homo sapiens (H. sapiens) proteins and 3644 Mus musculus (M. musculus) proteins extracted from the PLMD database (Xu et al., 2017). The corresponding data can be downloaded from our website. Based on motif-x (Chou and Schwartz, 2011), we got 33 and 13 significant sequence motifs of eukaryotic and prokaryotic, respectively (detailed motif figures shown in Supplementary Fig. S1). We observed that the eukaryotic acetylation preferred to AEK, GKL, KXGK and SKP motifs and prokaryotic acetylation preferred to EK, DK, KXR and KY motifs (‘X’ denotes any amino acid). Moreover, the arginine (R) was abundant in downstream for prokaryotes acetylation sequence, but K preferred to locate in the downstream of eukaryotic acetylation sequences and upstream sequences have also some difference between prokaryotes and eukaryotes. These observations suggest that prokaryotic and eukaryotic acetylation sites have distinct location-specific difference, and it is necessary to develop a prokaryote specific acetylation prediction tool.
In this study, we specially developed a novel tool named as ProAcePred to predict nine species of prokaryote lysine acetylation sites based on the combination of sequence-based, physicochemical property and evolutionary information features via elastic net. In the first-stage, we trained three type features in nine species. Then we incorporated all of the features, and used elastic net method to reduce the dimensionality of feature vectors. Finally, we used optimal feature vectors and through 10-fold cross-validation to evaluate the performance of the model based on SVM. The results of independent test set showed that our models were significantly enhanced in comparison with other existing models. Taken together, ProAcePred could be a powerful tool for the computational identification and characterization of prokaryote protein acetylation on a large scale, and the online service is freely available at http://computbiol.ncu.edu.cn/ProAcePred.
2 Materials and methods
2.1 Data collection and pre-processing
We collected eight species of lysine acetylation from bacteria in prokaryotes: E. coli, S. typhimurium, Bacillus subtilis (B. subtilis), Vibrio parahemolvticus (V. parahemolvticus), Mycobacterium tuberculosis (M. tuberculosis), Corynebacterium glutamicum (C. glutamicum), Erwinia amylovora (E. amylovora) and Geobacillus kaustophilus (G. kaustophilus), respectively. In addition, we also collected some lysine acetylation data from Archaea, including Thermos themophilus (T. themophilus) and other species for Archaea, which Archaea appears as a category of prokaryotes. Therefore, we finally collected nine categories in prokaryotes. These datasets were extracted from multiple public resources, including UniProtKB/Swiss-Prot (Boutet et al., 2007), NCBI (https://www.ncbi.nlm.nih.gov/), CPLM database (Liu et al., 2014a, b) as well as the relevant literature (Kosono et al., 2015; Lee et al., 2013; Mizuno et al., 2016; Okanishi et al., 2013; Pan et al., 2014; Wu et al., 2013; Xie et al., 2015). After removing other mistaken sequences with modification sites among those databases, we finally collected 5316 experimental acetylated protein (shown in Supplementary Table S1). It contained 8787 lysine acetylation sites and 87 585 lysine non-acetylation sites.
Because the structural studies have shown that lysine acetyltransferase (KATs) domains coupled with peptide substrates typically do not exceed 14–20 amino acids in length (Marmorstein, 2001), we first chose maximum number of 20 residues that were upstream and downstream of the acetylation or non-acetylation site in such a way that the whole length of the peptide became 41. When sequence fragment length was insufficient, we added the letter O (O is defined as a virtual amino acid). Subsequently, we clustered the protein sequences with a threshold of 30% identity using the CD-HIT (Li and Godzik, 2006) and then 7288 lysine acetylation fragments with 41 638 lysine non-acetylation fragments were extracted for further pre-processing. The positive samples extracted from acetyl-lysine fragments were divided into training datasets and independent datasets in nine species. We used the same type of residue (lysine), excluding known acetylation sites, as the negative set (non-acetylation sites). Afterwards, we randomly selected 10% of non-homologous lysine acetylation fragments with non-homologous lysine non-acetylation fragments as independent test dataset in nine species, respectively. It was used as a benchmark for evaluating our model as well as for comparing it with other published methods. Finally, due to the number of negative samples more than positive samples for training dataset and independent test dataset (shown in Supplementary Table S2), we randomly selected negative samples with the same as positive ones to form a balance of the positive and negative samples in training sets and test sets. The corresponding data can be downloaded from our website.
For all of the positive and negative sets in nine species, we optimized the final window sizes through training K nearest neighbors (KNN) features. In nine species, the final window sizes were 13 for Archaea, 17 for V. parahemolvticus and 21 for others species (detailed information shown in Supplementary Text S1).
2.2 Features extraction
In this work, amino acid compositions (AAC), amino acids binary encoding (BE), position weight amino acid compositions (PWAA) and K-space amino acid pair composition (K-space) were used to describe sequence-based features. Average accessible surface area (AASA) and encoding based on grouped weight (EBGW) were adopted to extract physicochemical property features. KNN was utilized to represent evolutionary information features.
2.2.1 Sequence-based feature
AAC and BE are widely used in various prediction systems (Chen et al., 2013; Liu et al., 2014a, b; Suo et al., 2012), which can efficiently describe the specific state of a given acetylated and non-acetylated peptide fragments. AAC and BE are considered on the basis of a single amino acid residue sequence information, therefore we further took the K-space to extract correlation information between amino acids. Meanwhile we adopted PWAA (Shi et al., 2012) to extract the sequence-order information of amino acid residues around acetyl-lysine sites. The detailed information of AAC, BE, K-space and PWAA are shown in Supplementary Text S2.
2.2.2 Physicochemical properties
AASA: Pang et al. (2007) investigated the structural environment of 8378 incidences of 44 types of PTM and found a side-chain of amino acid that undergoes PTM prefers to be accessible on the surface of a protein. In the previous literature, AASA feature has been showing better predictive performance (Suo et al., 2012; Xu et al., 2015). Therefore, the solvent accessibility of amino acid residues surrounding the acetylation sites may be adapted to distinguish between the acetylation sites and non-acetylation sites. Here, we demonstrated the effectiveness of AASA as features for acetylation site prediction.
EBGW: Acetylation of lysine neutralizes the positive charge of this amino acid, and changes the protein function in diverse ways (Yang, 2004). Thus, in the following, we adopted an encoding scheme of the amino acid sequence considering the hydrophobicity and charged character of amino acid residues. The EBGW divides the 20 amino acid residues into four different classes on the basis of their hydrophobicity and charged character:
The hydrophobic group C1 = {A, F, G, I, L, M, P, V, W}.
The polar group C2 = {C, N, Q, S, T, Y}.
The positively charged group C3 = {K, H, R}.
The negatively charged group C4 = {D, E}.
Where the function gives the number of 1 in the sub-sequence, denotes the length of the sub-sequence, the rounds a number to the nearest integer and L is the length of the sliding window sequence. The 3*J-dimension vector X=[X1, X2, X3] is defined as the EBGW string of protein sequence. Here, we made J = 5.
2.2.3 Evolutionary-derived information
KNN: In order to take advantage of cluster information of local sequence fragments for predicting acetylation sites, we took the local sequence around acetylation sites in a query protein and extracted features from its similar sequences in both positive and negative datasets by a KNN score algorithm (Gao et al., 2010; Shen et al., 2006; Tan, 2006).
Where, L represents the length of a protein sequence fragment; the, the amino acid similarity matrix, is derived from the BLOSUM62 substitution matrix (Henikoff and Henikoff, 1992); a and b denote two amino acids, M is the substitution matrix and represent the largest/smallest number in the matrix, respectively.
To take advantage of different properties of neighbors with various similarities, different K values can be used to obtain multiple scores. In this work, because of different amount of datasets for nine species, we chose different K value. K was chosen to be 2, 4, 8, 16 and 32 and the 5 KNN scores were extracted as features from Archaea. K was chosen to be 4, 8, 16, 32 and 64 and the 5 KNN scores were extracted as features from E. amylovora, S. typhimurium, G. kaustophilus and V. parahemolvticus. K was chosen to be 4, 8, 16, 32, 64, 128 and 256 and the 7 KNN scores were extracted as features from E.coli, C. glutamicum, M. tuberculosis and B. subtilis.
2.3 Features optimization via elastic net
A promising technique called the lasso was proposed by Tibshirani (1996). The lasso is a penalized least squares method imposing an L1-penalty on the regression coefficients. Owing to the nature of the L1-penalty, the lasso does both continuous shrinkage and automatic variable selection simultaneously. Although the lasso has shown success in many situations, it has some limitations. For example, if there is a group of variables among which the pairwise correlations are very high, then the lasso tends to select only one variable from the group and does not care which one is selected; For usual n > p situations, if there are high correlations between predictors, it has been empirically observed that the prediction performance of the lasso is dominated by ridge regression (where n is observation, p is predictors). Therefore, Zou and Hastie (2005) based on lasso theory, proposed new method elastic net. Similar to the lasso, the elastic net simultaneously does automatic variable selection and continuous shrinkage and it can select groups of correlated variables. Simulation studies and real data examples show that the elastic net often outperforms the lasso in terms of prediction accuracy.
By the proportional relationship between and, we used to parameterize the elastic net and further selected the optimal feature vectors based on optimization parameter.
3 Results and discussion
3.1 The features optimization results
Seven features (AAC, BE, K-space, PWAA, AASA, EBGW and KNN feature) were encoded independently to predict nine species acetylation sites, which the performances were not fully satisfactory. However, the combination of different features, compared with single feature, would provide more powerful prediction performances (Suo et al., 2012; Wang et al., 2016). If we combined all seven features, the feature vectors have bigger dimensions. The dimensions of each kind of feature vectors and combined all feature vectors in different species are listed in Supplementary Table S3. The highly dimensional features will lead to a time-consuming classification of the training model, and some of feature vectors may be unwanted noise and lead to bias about the prediction performance. Therefore, it is generally necessary to reduce dimensionality of incorporative feature vectors, ultimately, retain some important feature vectors in models.
Here, we used elastic net to optimize the dimensionality of feature vectors. For example, when generating the predictive model of Archaea, first, we defined parameter and applied elastic net to evaluate all of the feature vectors and received parameter s value about each of feature vectors, so all feature vectors were ranked according to their s values from small to large. If the s value is smaller, the feature vector is more important for the model. Second, we trained feature vectors with s value less than 0.1, 0.2, 0.3, 0.4 and 0.5 by using 10-fold cross-validation respectively, and then selected optimization s value according to maximum accuracy (Acc) value of. The detailed model optimization and evaluation method is shown in Supplementary Text S3. Third, we used similar method to process. Finally, we selected optimized feature vectors according to maximum Acc value. Here, the optimized parameter for Arhaea (other species optimized parameter shown in Supplementary Table S4), and the dimension of feature vectors was reduced from 2552 to 283. The elastic net scores (i.e. s value) about optimization feature for nine species can be downloaded from our website. We compared the prediction performance of all incorporative features with optimized feature for nine species (Table 1). We observed that the performance of optimized features generated by elastic net were better than those of all incorporative feature vectors by 10-fold cross-validation based on SVM, and the dimensions of feature vectors were dramatically reduced. For example, the value of area under receiver operating characteristic (AUC) of combined all seven feature sets is 0.721 in Archaea, but the AUC of the model with optimized feature vectors improved 0.176. The AUC of E. amylovora and S. typhimurium were non-entity for combined all the feature vectors, but the AUC of the models with optimized feature vectors were 0.988 and 0.778, respectively. These results may be explained by that fusion of all feature vectors can extract more information on the protein, but it still contains some redundancy or unimportant feature vectors which may have a negative influence on the performance of model. However, the elastic net can not only keep the group effect but also overcome the double shrinkage by the quadratic penalty, and it can select groups of correlated variables from all feature vectors (Zou and Hastie, 2005). Therefore, the optimal feature subsets generated by the elastic net retain best group effect, which may result in a significant improvement in the predictive performance of the model. Furthermore, for different species, we found that their performance have different levels of improvement. It suggested that different species may have different sequence or structure properties (Section 3.2), and it is necessary to distinguish different species.
The training results of combined all eigenvector and optimal feature vectors in nine species
| Acc | Sn | Sp | MCC | AUC | dimension | ||
|---|---|---|---|---|---|---|---|
| Archaea | All | 0.743 | 0.772 | 0.713 | 0.488 | 0.721 | 2552 |
| Optimal | 0.9 | 0.9 | 0.9 | 0.803 | 0.897 | 283 | |
| V. parahemolvticus | All | 0.724 | 0.736 | 0.719 | 0.456 | 0.697 | 2640 |
| Optimal | 0.802 | 0.808 | 0.796 | 0.605 | 0.799 | 303 | |
| E. coli | All | 0.659 | 0.691 | 0.627 | 0.319 | 0.658 | 2730 |
| Optimal | 0.69 | 0.691 | 0.689 | 0.381 | 0.687 | 367 | |
| C. glutamicum | All | 0.726 | 0.75 | 0.703 | 0.455 | 0.734 | 2730 |
| Optimal | 0.8 | 0.807 | 0.794 | 0.602 | 0.807 | 325 | |
| M. tuberculosis | All | 0.747 | 0.749 | 0.744 | 0.494 | 0.744 | 2730 |
| Optimal | 0.834 | 0.83 | 0.838 | 0.671 | 0.83 | 347 | |
| B. subtilis | All | 0.74 | 0.746 | 0.735 | 0.481 | 0.74 | 2730 |
| Optimal | 0.796 | 0.799 | 0.792 | 0.592 | 0.8 | 376 | |
| E. amylovora | All | 0.55 | 0.844 | 0.256 | NoN | NoN | 2728 |
| Optimal | 0.983 | 0.978 | 0.989 | 0.967 | 0.988 | 155 | |
| S. typhimurium | All | 0.512 | 0.606 | 0.418 | NoN | NoN | 2728 |
| Optimal | 0.816 | 0.895 | 0.737 | 0.64 | 0.778 | 274 | |
| G. kaustophilus | All | 0.567 | 0.644 | 0.489 | 0.134 | 0.577 | 2728 |
| Optimal | 0.897 | 0.917 | 0.878 | 0.801 | 0.902 | 294 |
Note: ‘All’ represents combined all eigenvector; ‘Optimal’ represents optimized feature vectors generated by elastic net; ‘dimension’ represents feature vectors dimension; ‘NoN’ represents non-entity. (Sn, sensitivity; Sp, specificity; Acc, accuracy; MCC, Matthew correlation coefficient).
3.2 Analysis of feature importance and contribution
As mentioned above, the seven different feature sets (AAC, BE, K-space, PWAA, EBGW, KNN and AASA) were used to predict acetylation sites. In the beginning, we do not know these seven features make how much contribution, and which features are more important than others. Therefore, we analyzed the relative importance and contribution of these different features by elastic net, and then evaluated which dimensions feature vectors have more valuable for prediction model. The ratios of selected dimension of feature vectors belonging to the seven feature groups are shown in Figure 1 (detailed feature vectors dimension of seven features in optimization model shown in Supplementary Table S5). We observed that the ratio of KNN feature is significantly higher than other six features. Especially for the Archaea, V. parahemolvticus, C. glutamicum and B. subtilis, KNN ratios reach up to 1 and the lowest KNN ratio is also higher than other features. From the elastic net score values, we found that the s values of KNN feature are lower than those of other features in nine species. Thus, it suggested that KNN feature played significant role in determining acetylation sites. Because substrate sites of same KATs or KATs family usually share similar patterns in local sequence fragments, local sequence clusters often exist around acetylation site (Weinert et al., 2011). As mentioned above, KNN just reflects cluster information of local sequence fragments for acetylation sites. We further compared the KNN values of acetylation sites and non-acetylation sites in nine species (shown in Fig. 2). A score greater than 0.5 means the query site is more similar to the acetylation samples; a score smaller than 0.5 means it is more similar to the non-acetylation samples. The larger the KNN score is, the more similar the site is to some known acetylation sites. For acetylation fragments, the average KNN scores with different sizes of nearest neighbors are within 0.53 to 0.85. Therefore, the local sequences surrounding known acetylation sites are more similar to their nearest neighbors in positive set (excluding self-matches) on average as expected. This result confirmed that acetylation related clusters exist in acetylation fragments. For non-acetylation fragments, the KNN scores are within 0.38 to 0.53, which means that the sequences in negative set are more similar to nearest neighbors in negative datasets. With the increasing of the value of K, the gap of KNN scores between acetylation and non-acetylation sites were getting smaller and smaller. Additionally, we found that KNN scores of different species were subtle differences, especially KNN scores of Archaea have relatively large difference and KNN scores of S. typhimurium have less difference among nine species. It suggested that contribution of KNN feature was different to each of species. In short, the KNN feature can capture evolutionary similarity information in the local sequence around acetylation sites and hence distinguish them from the background. Therefore, the KNN features are suitable to be used for predicting prokaryote acetylation site.
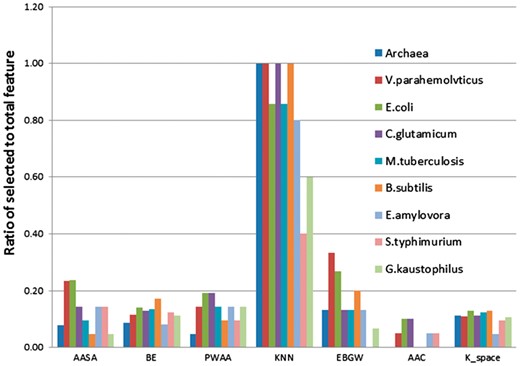
The ratios of selected dimension of feature vectors belonging to the seven feature groups. Abscissa represents each of feature set
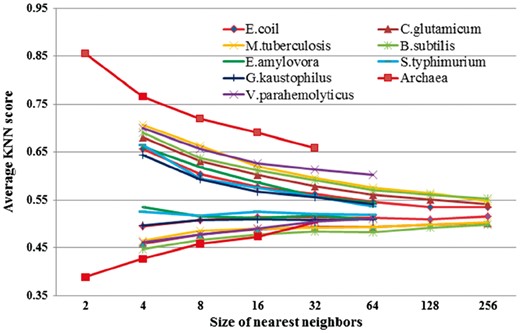
Comparison of KNN scores between acetylation sites and non-acetylation sites for nine species. The vertical axis represents the average KNN scores. The horizontal axis represents numbers of nearest neighbors
In contrast, as shown in Figure 1, the ratios of most of the K-space and AAC feature vectors are low, which suggested that most of dimension features were unwanted and these two features were not important for the model. In order to detect statistically significant differences about the compositional biases of sequences between acetylated and non-acetylated sites, we used Two Sample Logo tool (Vacic et al., 2006) to generate sequence logos for the lysine acetylation sequence in nine species based on the curated datasets. From Figure 3, we found that different species have different sequence information. For instance, for lysine acetylation sequence fragments, K, aspartic acid (D), arginine (R) and glutamic acid (E) enrich in upstream for E. coli and V. parahemolvticus, but leucine (L) enriches in downstream for E.coli, histidine (H) and tyrosine (Y) enrich in downstream for V. parahemolvticus; K enriches at positions –10, –8, –5, –3, –2 and 1 for E. amylovora, while K enriches at positions –4, –3, –1, 2 and 4 for S. typhimurium. However, the different species also have some common feature for acetylation sequence; we observed that K enriches in upstream for nine species. Indeed, Gu et al. (2017) found that the charge property of K in E. coli pyridoxine 5’-phosphate oxidase (EcPNPOx) may be crucial for its enzyme activity and lysine acetylation regulates the activity of EcPNPOx. This shows that the acetylation substrates which bind to KATs are much different from non-acetylation. In addition, we observed that the characteristics of the residues in the positions at –10∼–2, +1 and +6∼+10 have significant difference between acetylated and non-acetylated samples of E. coli, the content of K in upstream and R in downstream of acetylation sites are higher than those of non-acetylation sites and so on. These observations suggested that acetyl-lysine and non-acetyl-lysine have distinct location-specific differences, and the PWAA feature is helpful to predict acetylation sites in prokaryotes.
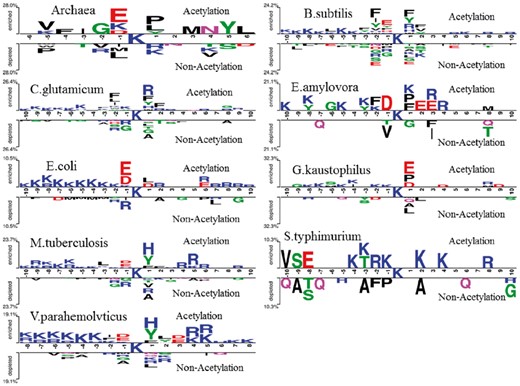
Sequence logo illustration generated by Two Sample Logo for acetylation sites sequence information of nine species (P-value < 0.05; t-test)
In addition, from Figure 1, we observed that each of feature groups have different contribution to different species. For example, the EBGW feature has better performance for eight species, but the ratio of EBGW was 0 for the S. typhimurium, suggesting that EBGW feature was low contribution to S. typhimurium; the AASA feature has better contribution to E. coli and V. parahemolvticus among nine species. The EBGW feature is mainly based on the hydrophobicity and charge character of amino acid residues. Based on the curated datasets, the number of sub-sequences was selected to be 5. And the EBGW values were represented by 15 dimension values (shown in Supplementary Fig. S2). The results showed that the ratios of EBGW values of H2 between acetylation sequence and non-acetylation ones were higher than 0 (except of archaea), implying more positive charge existed around acetylation sites than that around the non-acetylation ones. This is in agreement with the results of above feature analysis. A protein that has a surface that is composed mainly of negatively charged amino acids will bind to a protein with mainly positively charged molecules (Neuwirth et al., 2007). Supplementary Figure S2 also showed that the difference between acetylation and non-acetylation for G. kaustophilus (gray) and other eight species were bigger in H3, but for E. amylovora, the curves (wathet) showed bigger difference in H1, H2 and H3. The AASA formed from nine species acetylation sites in the constructed datasets (except of center position) is shown in Supplementary Figure S3. Most of the acetylation or non-acetylation sites (0 position) were located in the highly AASA value. The average AASA of neighborhood residues are 35 to 55 for all species acetylation sites. The fluctuant range of AASA of residues surrounding acetylation sites was bigger than that of non-acetylation sites. For example, the AASA of the E. coli that surrounds the acetylation sites exceeded that around non-acetylation sites, especially in the –10∼–4 positions. This implied that the acetylation processing might have occurred where the structural surroundings are relatively large variation range, which was consistent with previous knowledge on lysine acetylation (Pang et al., 2007).
From above results, we discovered that the AASA, BE, EBGW, PWAA and KNN features have large proportion in optimal feature vectors and the AAC and K-space have relatively few ratios.
3.3 Prokaryote acetylation sites prediction of ProAcePred
Based on optimal feature vectors generated by elastic net, nine models for prokaryotes lysine acetylation prediction were constructed respectively. To evaluate the performance of ProAcePred, we performed a 10-fold cross-validation for each species. We plotted receiver operating characteristic (ROC) curves of training set and calculated the AUC values as shown in Figure 4 (detailed training results shown in Supplementary Table S6 and ROC curves of independent test set shown in Supplementary Fig. S4). For training datasets of nine species, seven models of C. glutamicum, M. tuberculosis, B. subtilis, E. amylovora, S. typhimurium, G. kaustophilus and Archaea achieved AUC values of 0.807, 0.83, 0.8, 0.988, 0.882, 0.902 and 0.897, respectively. The AUC values of E. coli and V. parahemolvtius were below in 0.8. Based on the independent datasets, AUC values of ProAcePred were 0.855, 0.855, 0877, 0.861, 0.863, 0.942, 0.896, 0.778 and 0.854 in Archaea, V. parahemolvticus, E. coli, C. glutamicum, M. tuberculosis, B. subtilis, E. amylovora, S. typhimurium and G. kaustophilus models, respectively. The results of most independent test were better than those of training set, which justifies that our predictor ProAcePred has stabilization and good prediction performance.
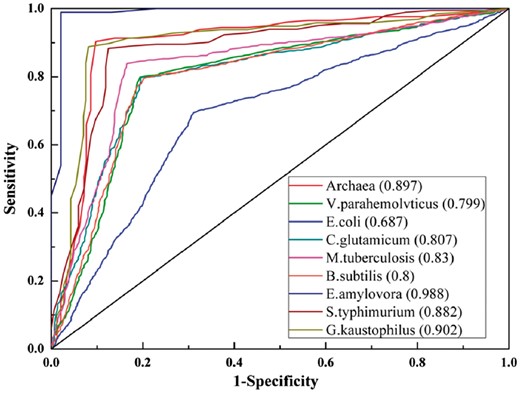
The ROC curves and AUC values of the training datasets for nine species
3.4 Comparison with other prediction tools
To further evaluate the performance of ProAcePred, we compared it with some widely existing lysine acetylation prediction tools. Although there have been reported many tools for predicting protein acetylation sites since 2009, and considering the web server tools whether do work or not, four general tools Ensemblepail (Xu et al., 2010), Phosida (Gnad et al., 2010), PLMLA (Shi et al., 2012), LAceP (Hou et al., 2014) and one species-specific predictor SSPKA (Li et al., 2014) were selected to compare lysine acetylation models, respectively. The PLMLA, Ensemblepail and LAceP incorporated prokaryotic and eukaryotic datasets into their training datasets and did not optimize the dimensionality of feature vectors. The tool Phosida was specifically designed for predicting H. sapiens acetylation. Therefore, we used these four tools to predict our nine species data, in order to investigate the difference of substrate specificity between prokaryote and eukaryote acetylation sites. The SSPKA divided the datasets into six types, H. sapiens, M. musculus, Saccharomyces cerevisiae (S. cerevisiae), Rattu norvegicus, E. coli and S. typhimurium, respectively. Thus, we used this tool to predict E. coli and S. typhimurium data. To avoid any bias, we submitted independent test data of each species to PLMLA, Ensemblepail, LAceP and Phosida tools and submitted independent test data of S. typhimurium and E. coli to SSPKA. The detailed comparison results are listed in Supplementary Table S7. From Figure 5 and Supplementary Table S7, the AUC and MCC values of ProAcePred were significantly higher than those of LAceP, PLMLA and Ensemblepail which were not species-specific predictors. For example, the AUC values of LAceP, PLMLA and Ensemblepail were 0.591, 0.677 and 0.539 for Archaea, respectively, and the AUC value of our model reached to 0.855; for B. subtilis, the AUC values of LAceP, PLMLA, Ensemblepail and our model were 0.509, 0.608, 0.522 and 0.942, respectively, and so on. This indicated that distinguishing different species could improve prediction performance. For S. typhimurium, the AUC values of LAceP, PLMLA, Ensemblepail, SSPKA and our model were 0.647, 0.55, 0.665, 0.893 and 0.778, respectively, and the prediction performance of SSPKA was higher than other tools. Because the SSPKA distinguished different species and used minimum-redundancy maximum-relevance approach to optimize the dimensionality of feature vectors, which once again showed that it was important to distinguish different species and optimize feature vectors. For S. typhimurium, although the prediction performance of our model has a bit lower than SSPKA, our method reached a high accuracy for other species. Meanwhile, from Figure 5, we also found that the prediction performance of Phosida in nine species were lower than our tool, which clearly showed the necessity of developing prokaryote-specific acetylation sites prediction tool.
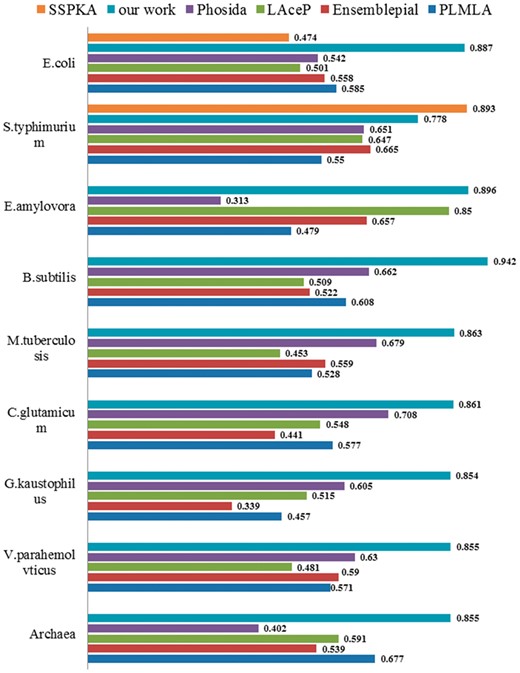
Comparison of AUC values between our method and other tools
4 Conclusion
In this study, we proposed a new method named as ProAcePred to predict prokaryote-specific lysine acetylation. Especially, we applied a kind of mathematical method elastic net to optimize the dimensionality of feature vectors which significantly improved prediction performance. We performed an in-depth analysis of feature importance and contribution for different species, and found that KNN features played significant roles in predicting prokaryote acetylation sites. The optimization feature vectors were different in different species models, indicating that distinguishing different species was important for acetylation site prediction in order to improve prediction quality. Our prediction model achieved a promising performance and outperformed other prediction tools. Finally, we have developed an online service system of ProAcePred by combining software MATLAB R2010a with Eclipse (Java EE) software, which is freely available to academic researchers. We expect that the ProAcePred could provide more instructive help for further experimental investigation of prokaryote acetylation. Furthermore, recent studies (Li et al., 2015a, b; Wang et al., 2015a, b) showed that protein–protein interaction (PPI) and network-based features have also been proved useful in predicting protein phosphorylation. Therefore, with more experimental annotation data available, we will try to introduce PPI functional information and network-based features to further improve prokaryote acetylation prediction in future work.
Funding
This work was supported by the National Natural Science Foundation of China (21665016 and 21305062), and the Natural Science Foundation of Jiangxi Province (20151BAB203022).
Conflict of Interest: none declared.
References

