


Abstract
Many studies have investigated the association between DNA methylation alterations and disease occurrences using two design paradigms, traditional case-control and disease-discordant twins. In the disease-discordant twin design, the affected twin serves as the case and the unaffected twin serves as the control. Theoretically the twin design takes advantage of controlling for the shared genetic make-up, but it is still highly debatable if and how much researchers may benefit from such a design over the traditional case-control design.
In this study, we investigate and compare the power of both designs with simulations. A liability threshold model was used assuming that identical twins share the same genetic contribution with respect to the liability of complex human diseases. Varying ranges of parameters have been used to ensure that the simulation is close to real-world scenarios. Our results reveal that the disease-discordant twin design implies greater statistical power over the traditional case-control design. For diseases with moderate and high heritability (>0.3), the disease-discordant twin design allows for large sample size reductions compared to the ordinary case-control design. Our simulation results indicate that the discordant twin design is indeed a powerful tool for epigenetic association studies.
Computer scripts are available at https://github.com/zickyls/EWAS-Twin-Simulation.
Supplementary data are available at Bioinformatics online.
1 Introduction
DNA methylation is an important epigenetic modification which is involved in regulating many cellular processes, such as transcription and X chromosome inactivation (Gopalakrishnan et al., 2008; Robertson, 2005). Epigenome-wide association studies (EWAS) are becoming popular among researchers in recent years and many associations between DNA methylation and human disease have been discovered (Oliver et al., 2015; Svendsen et al., 2016). Epigenetics studies allow researchers to understand more about the etiology of a complex disease, which is often influenced by both genetic and environmental factors, and allow development of intervention strategies that could improve the quality of life (Bediaga et al., 2010; Luczak and Jagodzinski, 2006).
The disease-discordant twin design uses monozygotic twin pairs discordant for a disease, the one with disease serving as case and the other as control (Tan et al., 2015). Theoretically, monozygotic twins share the same and dizygotic twins share half of their genetic material (Boomsma et al., 2002). In the currently popular disease-discordant twin design for epigenetic association studies, researchers collect monozygotic twin pairs that are discordant for a trait to investigate the association between disease and epigenetic regulation (e.g. DNA methylation). The nearly perfect control of covariates such as age, sex and genotype theoretically should empower the epigenetic association study (Bell and Saffery, 2012; Bell and Spector, 2011; Castillo-Fernandez et al., 2014).
Although statistical power plays a crucial role in EWAS, few studies have investigated it in detail. Tsai and Bell (2015) tried to estimate and compare the power for the ordinary case-control design and the twin design in DNA methylation studies, but failed to show a power advantage from the disease-discordant twin design. Their results show nearly similar power estimates for these two designs because the genetic background was neglected in the simulation. However, complex diseases are usually subject to both genetic and environmental influences. The use of disease-discordant twin design is to control for the confounding of genetic effects. The latter affects disease susceptibility both in twins and in unrelated individuals. Here, we use a liability threshold model (Haegert, 2004; Tenesa and Haley, 2013) to simulate both genetic and environmental (epigenetic) effects on disease, using different scenarios to estimate and compare the power of the two designs.
2 Materials and methods
2.1 Simulating phenotype, genetic contribution and environmental contribution
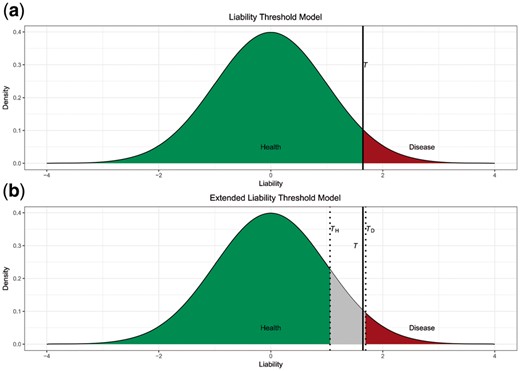
(a) Liability threshold model and (b) extended liability threshold model. Green area represents controls and red area represents cases. Gray area is the samples that should be excluded from the experiment (Color version of this figure is available at Bioinformatics online.)
For individual i in the ordinary case-control design, the genetic contribution gi is simulated by drawing a random number from a normal distribution with mean 0 and variance h2, and environmental contribution ei is simulated by drawing a random number from a normal distribution with mean 0 and variance 1 – h2. Then the liability is computed as li = gi + ei. As for liabilities of MZ twins, we use same parameters for random number generation of the genetic contributions for both twins, and then simulated the environmental contributions independently.
2.2 Simulating methylation
Then for individual i, we could simulate another random number εi, with same random number ei that we have before, we could compute M-value for this individual using Equation (3) and the computed b0 [(Equation (4)] and b1 [(Equation (6)].
2.3 Sample selection
A universal liability cutoff T is set based on disease prevalence π, which is the proportion of affected individuals in a population. Individuals with liability that exceed T are affected and others are unaffected, as shown in Figure 1a. The red area which is the probability that liability falls into interval T to ∞ is π, thus that 1– Ф(T) = π. Solve it and we have T = Ф−1(1− π). Ideally the cases and controls should have distinguishable liabilities (which could be indicated by phenotypic measurement), and it is preferable to choose discordant twins with larger liability difference since the difference in the environmental contribution will also be enlarged together with methylation levels at associated CpG sites. To achieve that, we set a new parameter PK, which is the percentage of cases and controls that have liabilities close to the cutoff T. Those samples are excluded from real-life studies, as illustrated in Figure 1b. For a given PK, controls should have a liability lower than TH = Ф−1(1−(1−PK)π) and cases a liability higher than TD = Ф−1((1−PK) (1−π)). In this simulation, we use the same liability cutoff for both the ordinary case-control design and the twin design as studies have shown no difference in disease susceptibility between twins and the general population (Andrew et al., 2001).
2.4 Statistical testing
In this model, MD and MH are methylation levels for the affected twin and the unaffected co-twin within a pair. We extract the significance level of the intercept α. Then at each significant CpG site, the disease is associated with hyper-methylation if α > 0 and hypo-methylation if α < 0.
2.5 Power calculation
In this equation, I(·) is an indicator function for the logical expression that asserts whether the P-value for α meets the threshold 1 × 10⁻⁶.
2.6 Parameter settings
To start the simulation, we first fixed the disease prevalence (π) to 0.05. Proportion that was excluded where individuals have a liability close to the cutoff (PK) was set from 0 to 0.4. We simulated diseases with a heritability ranging from 0 to 0.6, and ,E ranging from 0 to 1 to represent different degrees of environmental effect on DNA methylation. The Mean of the M-value was set from −3.78 to 3.36 while variance was set from 0.06 to 4. The twin correlation on methylation ρε was set to 0, 0.1, 0.3, 0.5 and 0.8 in twin samples. Equal number of cases and controls were used in our simulation, and in this paper, we refer to this number as sample size. The sample size started from 5, and increased 1 after each iteration until the power reaches 1. To compare the power, we used same parameter settings for both designs. All the simulations were performed using R software.
3 Results
To validate our simulation method and statistical testing methods, we simulated the type I error rate by fixing the R-square between environmental contribution to disease and methylation to 0. By setting ,E = 0, we created an artificial null effect, and the estimated power becomes type I error rate. We simulated 1000 cases and 1000 controls for all parameter settings with 2000 replications. The results are available in Supplementary Material S1. In Supplementary Material S1, boxplot (Supplementary Fig. A) shows that type I error rate estimates for the two designs are stable at 0.05 for both designs. Plot of joint distribution in Supplementary Figure B suggests that the type I error rate does not have bias toward either design since there is no systematic pattern between the distribution of the two designs. The results prove that our simulation and testing methods are unbiased and valid.
Power estimates for samples that have liability below TH = 0.43 and higher than TD = 1.81 (when PK = 0.3) are reported in Figure 2, with the red horizontal line marking power of 80%. The mean and variance of the M-value are set to 3.36 and 0.06, respectively. Other results (with different assumptions of PK) are provided in Supplementary Material S2. All the plots share the same pattern with power consistently increasing with larger sample size. For the parameters that are used in this plot, when disease has a high heritability (0.6) and there is a low correlation between environmental factors and DNA methylation (,E = 0.1), the sample size required for the power to exceed 0.8 in an ordinary case-control design reaches its maximum at 221. For the same parameter settings, sample size estimated for the disease-discordant twin design ranges from 22 (when ρε = 0.8) to 63 (when ρε = 0.1), which is an immense improvement over the ordinary case-control design.
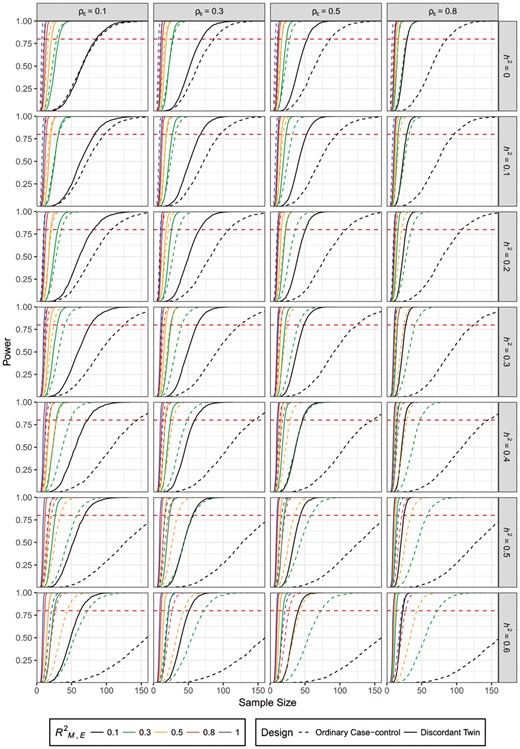
Power estimates using liability threshold model for different designs, ,E, h2 and ρε. Horizontal red line marks power = 80% (Color version of this figure is available at Bioinformatics online.)
Some general patterns are observed in how parameter change impacts the power, and for illustration, we use a baseline parameter set and change only one parameter at a time to investigate those patterns. The baseline parameters were set to PK = 0, ,E = 0.3, h2 = 0.3 and ρε = 0.3. The results are shown in Figure 3. From the figure, it is evident that when the heritability changed from 0.3 to 0.5, both the ordinary case-control design and the twin design have reduced power. Sample size required for power over 0.8 changes from 66 to 93 in the ordinary case-control design while in twin design it ranges from 48 to 50. Different from the twin design, the power of the ordinary case-control design is more sensitive to the genetic contribution to the disease under investigation because the uncontrolled genetic background serves as noise in the ordinary case-control design. When increasing PK from 0 to 0.2, both designs have better power estimates with sample size changing from 66 to 48 in the ordinary case-control design and from 48 to 31 in the twin design. This makes sense as cases and controls are selected from individuals with more distinguishable phenotypes. The power to detect a CpG site increases with the environmental effect on its methylation level. With ,E increasing from 0.3 to 0.8, the sample size for the ordinary case-control design reduces from 66 to 24 while for the twin design it decreases from 48 to 22. Lastly when ρε changes from 0.3 to 0.8, only power for the twin design increases and sample size for power over 0.8 changes from 48 to 39. For the ordinary case-control design, this number is unchanged as expected since cases and controls are unrelated individuals. In addition, we also show how the power changes with different P-value cutoff for the two designs. When P-value cutoffs are 1 × 10⁻⁵, 1 × 10⁻⁶ and 1 × 10⁻⁷, the minimum sample size required are 45, 66 and 76, respectively for ordinary case-control design. Those numbers are 39, 48 and 55 for disease-discordant twin design. From the numbers, we saw that P-value cut-off affects sample size requirement in both designs although it is more demanding for the ordinary case-control design.
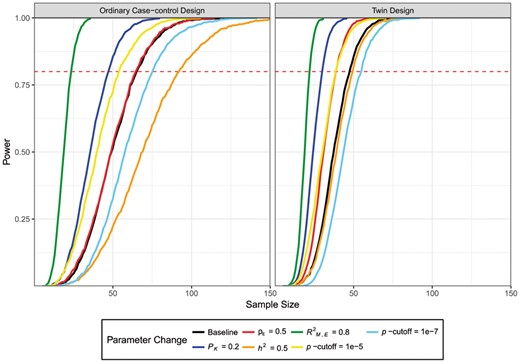
Example of how different parameter influence the power. Baseline parameters are set to PK = 0, ,E = 0.3, h2 = 0.3 and ρε = 0.3. Line colors indicate different changing of each parameter from the baseline. Changed parameters are shown in the legends (Color version of this figure is available at Bioinformatics online.)
To better visualize the change of sample size for power >80%, we also report the ratio of the minimum sample size in the twin design and ordinary case-control design for the power to reach 0.8 under the same parameter scheme (Fig. 4). From the figure, we could see that for diseases with heritability higher than 0.3, all the points fall below 1, which means that the sample size requirement for the twin design is smaller than for the ordinary case-control design. We also observed that the higher the heritability, the lower the sample size ratio, which suggests better sample size reduction with the disease-discordant twin design. From the first plot in Figure 4, which consists of results with all different settings for heritability, we could see that ordinary case-control design slightly overperforms twin design for large-effect CpGs. The maximum ratio is 1.44, where sample size required for the ordinary case-control design is 9 and 13 for the twin design. However, the situation of a lower power estimate for the twin design only occurs when the disease has a low heritability (<0.3) and CpG effect size is very large such that sample size requirement by the ordinary case-control design is already small (<50).
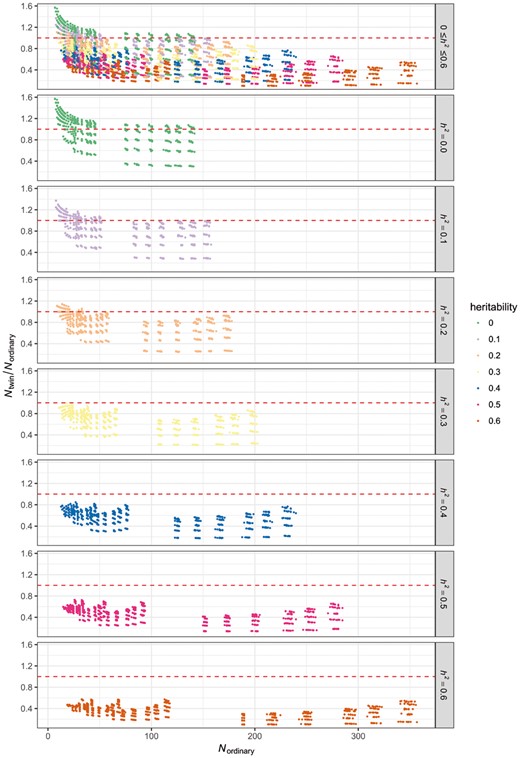
Sample size ratio of disease-discordant twin design and ordinary case-control design. Y-axis is the sample size ratio for twin design and ordinary case-control design. X-axis is the sample size for ordinary case-control design. Red dashed line marks ratio of 1 which means equal sample size for both design (Color version of this figure is available at Bioinformatics online.)
4 Discussion
The etiology of complex disease involves both genetic and environmental factors. The polygenic background serves as unneglectable confounding factors in epigenetic studies as epigenetics mediates environmental effects on disease development. The fundamental advantage of applying disease-discordant twin design residents in the fact that monozygotic twins have identical genetic make-ups which can be paired out. Under the framework of multifactorial diseases (with genetic and environmental influences), we used liability model to simulate both genetic and environmental (epigenetic) contributions to disease development. For each of the parameter set, both ordinary case-control design and twin design data were simulated to fairly compare the power difference.
Advantaged by the perfect match for age, sex and their genetic make-ups, twin design is preferred when the disease has been shown to have a genetic involvement usually indicated by a heritability estimate or family correlation. This simulation study showed that compared to the drastic change of power in ordinary case-control design, power of the disease-discordant twin design is less subjective to the change of heritability. This confirms that the disease-discordant twin design has much better power estimates over ordinary case-control designs when there is a moderate heritability (over 30%), and the power continue to improve for diseases with higher heritability. Our results thus substantiate that the twin design is a powerful tool for epigenetic association studies advantaged by controlling for genetic factors.
Sample collection also plays an important part in an EWAS experiment. In this simulation, we applied the same criterion to filtering out samples with liabilities close to the cutoff. From our results, we observed better power estimates for both the ordinary case-control design and the disease-discordant twin design after filtering. This also reflects a general real-world clinical situation as a larger difference in liability between case and control groups may mean that more severe patients as indicated by clinical variables are selected in ordinary case-control design or, likewise, more discordant twin pairs are selected in the discordant twin design. In our simulation, we used intra-pair correlation of residuals in methylation to represent twin correlation on methylation at a CpG site. The residual lowers the power estimates and reflects the larger sample size estimates for ordinary case-control designs. For the disease-discordant twin design, the correlated proportion from the residual of methylation (due to shared environmental and genetic factors) canceled out and results in better power estimates than case-control design under same parameter settings. This gives an additional aspect into how the twin design could improve the efficiency of EWAS.
Instead of a paired t-test, we used a simple linear regression for statistical testing in our simulation. While the simple regression model is equivalent to the paired t-test, the regression setup allows the possibility for including pair-specific variabilities like age and sex for adjustment. Although these variables were not considered in our simulation for simplicity, intra-pair differences in methylation can be larger in older pairs than in younger pairs, or larger in one sex than the other sex. These interactive effects can be easily assessed in a regression model (Tan et al., 2015).
As shown in Figure 4, in some cases, the ordinary case-control design has better power. This happens only when the heritability is relatively low (h2 ≤ 0.3) and the environmental contribution almost entirely determinates the DNA methylation level (,E ≥ 0.8). This is probably because the twin design uses pair-wise M-value difference as one observation which statistically halves the sample size, subsequently leading to disadvantage in estimating statistical power. The results suggest that the discordant twin design only benefits when the disease under study has a solid genetic background. For diseases with low or no significant heritability, the twin design is not recommended because there is no need for controlling the genetic effects. Another situation where the use of twins can lead to reduced power is the mapping of methylation quantitative loci or meQTL mapping. The latter is derived by mapping levels of DNA methylation in genetically different individuals when the use of genetically related individuals such as twins or siblings can be underpowered because of reduced genetic variation across samples.
Tissue heterogeneity such as cell composition difference across samples is an important issue when analyzing methylation data collected from a heterogeneous source (e.g. blood tissue). Our simulation model mainly focuses on the comparison of power in two experiment designs and, as a limitation, the simulated data represent the clean data (e.g. methylation profile after correcting for cell composition). Finally, our simulation showed that disease-discordant twin design gains power when the phenotype under investigation has relatively high heritability. Under this situation, the shared genetic contribution may add difficulties in collecting discordant twin pairs. The feasibility of an EWAS using the discordant twin design should be studied before power considerations.
Funding
This study was supported by the Lundbeck Foundation [grant number R170-2014-1353]; the DFF research project 1 from the Danish Council for Independent Research, Medical Sciences (DFF-FSS): DFF – 6110-00114; the Novo Nordisk Foundation Medical and Natural Sciences Research Grant [grant number NNF13OC0007493 and VILLUM Young Investigator [grant number 13154 to J.B.].
Conflict of Interest: none declared.
References

