


Abstract
Next-generation sequencing (NGS) generates large amounts of genomic data and reveals about 20 000 genetic coding variants per individual studied. Several mutation damage prediction scores are available to prioritize variants, but there is currently no application to help investigators to determine the relevance of the candidate genes and variants quickly and visually from population genetics data and deleteriousness scores. Here, we present PopViz, a user-friendly, rapid, interactive, mobile-compatible webserver providing a gene-centric visualization of the variants of any human gene, with (i) population-specific minor allele frequencies from the gnomAD population genetic database; (ii) mutation damage prediction scores from CADD, EIGEN and LINSIGHT and (iii) amino-acid positions and protein domains. This application will be particularly useful in investigations of NGS data for new disease-causing genes and variants, by reinforcing or rejecting the plausibility of the candidate genes, and by selecting and prioritizing, the candidate variants for experimental testing.
PopViz webserver is freely accessible from http://shiva.rockefeller.edu/PopViz/.
Supplementary data are available at Bioinformatics online.
1 Introduction
The assessment and prioritization of candidate pathogenic gene variants in next-generation sequencing (NGS) data from patients requires methods for predicting the deleteriousness of the variant and interpreting its minor allele frequencies (MAFs) in a large reference population (Casanova et al., 2014; MacArthur et al., 2014; Meyts et al., 2016). The Genome Aggregation Database (gnomAD) is a major resource for determining MAFs from the whole-exome sequencing (WES) data for 123 136 individuals from seven populations, and for obtaining variant annotations (Lek et al., 2016). The Combined Annotation-Dependent Depletion (CADD) method is widely used to estimate the deleteriousness of genetic variants for most categories of molecular consequences (Kircher et al., 2014), rather than just missense predictions as for PolyPhen-2 (Adzhubei et al., 2010) and scale-invariant feature transform (SIFT) (Kumar et al., 2009). CADD v1.3 uses logistic regression to model diverse annotations into a single score for each variant, to reflect its essentiality, without the use of population-based MAF information. In combination with gene-level approaches, such as the mutation significance cutoff (MSC) (Itan et al., 2016), MAF and CADD have been shown to distinguish effectively between benign and potentially damaging variants (Israel et al., 2017). Additional methods, such as EIGEN (Ionita-Laza et al., 2016) and LINSIGHT (Huang et al., 2017), have recently been developed to predict the deleteriousness of coding and non-coding variants, which may have some advantages over CADD. The location of the amino acids encoded by the variant may also have an influence on protein function, as different protein domains have different functions and tolerances to genetic variation, and the distribution of missense variants provides insight into the functional importance of protein regions (Gussow et al., 2016; Sivley et al., 2018). All these predictors therefore present useful information for identifying the variants most likely to be pathogenic.
However, there is currently no online tool for the straightforward visualization of these important predictors for the variants of specific genes. We, therefore, developed a user-friendly application for the rapid integration and visualization of population genetics, mutation damage prediction scores and amino-acid positions. This application should facilitate the assessment of candidate genes and variants for human diseases, and should be particularly useful in searches for new disease-causing genes and variants, by supporting or refuting the plausibility of the candidate genes, and by selecting and prioritizing the candidate variants for experimental test.
2 Materials and Methods
The PopViz webserver contains gnomAD.r2.0.2 WES genetic variants, with the following features: pre-calculated mutation damage prediction scores from CADD v1.3, EIGEN v1.1 and LINSIGHT; gene-level benign/damaging cutoff values from MSC; Ensembl_92 (Zerbino et al., 2017); UniProt_2018_01 (The UniProt, 2017); OMIM_2018_03 (Amberger et al., 2015) and UCSC liftOver for GRCh37/hg19 to GRCh38/hg38 coordinate conversion (Kent et al., 2002). The following inclusion/exclusion criteria were applied to the variants: (i) PASS in the FILTER field of the VCF file; (ii) in the canonical transcript; (iii) with gene symbol annotated; (iv) annotated as one of the 14 selected consequences (Supplementary Table S2) and (v) indels of up to 10 nucleotides. The webserver is hosted on an Apache HTTP server, the database is stored and queried by MySQL, the website is written in PHP and HTML, and the visualization is presented by Cascading Style Sheets and JavaScript.
3 Results and Discussion
The PopViz webserver provides a user-friendly integrative approach to the rapid extraction and visualization of population genetics data (global/maximum MAF), mutation damage prediction scores (CADD, EIGEN or LINSIGHT) and amino-acid positions, for variants of any human gene of interest (including variants supplied by the user). It currently includes 13 681 468 variants of 20 437 genes present in both the GRCh37/hg19 and GRCh38/hg38 human reference genomes, and supports seven populations and 14 consequences (Supplementary Section 1). It offers the flexibility of choosing different x/y-axis parameters for visualization. The options for the x-axis are: global MAF, maximum MAF and amino-acid position. The choices for the y-axis are: CADD, EIGEN, LINSIGHT, global MAF and maximum MAF. Visualization can be customized by multiple search options: MAF range, mode of inheritance, disease prevalence, population, consequences, MSC cutoff, impact prediction, loss-of-function prediction, heterozygosity and hemizygosity. Users can choose to submit their variants by providing the first five columns (CHROM, POS, ID, REF and ALT) from a VCF file. If amino-acid position is selected, PopViz automatically calculates the amino-acid positions corresponding to the user’s mutations on canonical transcripts, based on gene name and genomic position. Figure 1A illustrates the workflow for the development of PopViz.
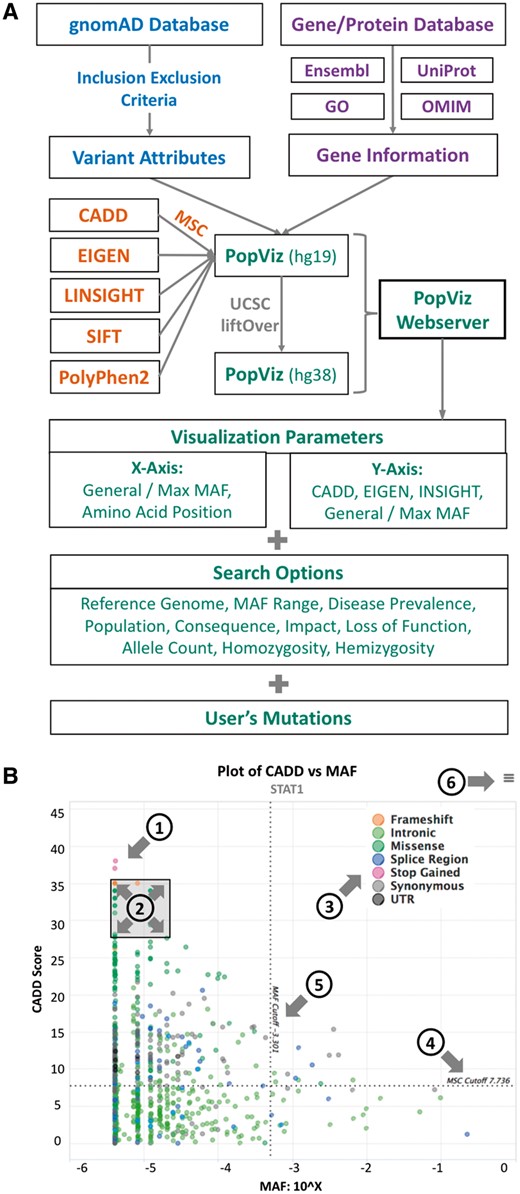
(A) The PopViz webserver workflow. (B) An example of a CADD versus MAF plot for the gene STAT1. The plot embeds the following interactive functions: (1) expansion of variant details at each point; (2) zoom in/out of a specific region; (3) show/hide specific consequences; (4) MSC cutoff; (5) MAF cutoff and (6) export plot as an image
Following submission of the query, PopViz returns an interactive map of the selected parameters for the variants of a given gene. Users can expand the details of the variant (including SIFT and PolyPhen2), show/hide any consequence, zoom in/out of any region and download/print the plot (Fig. 1B). The variants submitted by the user are integrated into the plot with the other variants of the gene concerned. Information about the gene/protein is provided in addition to the plot, including gene description, protein domains, gene ontology and cross-references to Ensembl, UniProt, OMIM and Human Protein Atlas (Uhlen et al., 2015) databases. The variants can be downloaded in a table with population genetics data and various deleteriousness scores. PopViz is mobile-compatible, offering rapid access to the variants in genes of interest. More details about PopViz (data, statistics, applications and user manual) are provided in the Supplementary Material.
4 Conclusion
The PopViz webserver is a freely accessible and user-friendly application for the rapid visualization of population genetics, damage prediction scores and amino-acid positions for genetic variants, and for displaying their variant/gene/protein characteristics. It facilitates the investigation of disease-causing candidate genes and variants in individuals with particular conditions, and the rapid selection of candidate variants for experimental validation. PopViz is a gene-centric approach to test individual genes for the clarity and consistency of visualization, as different human genes differ considerably in terms of their metrics (Itan et al., 2015). The usefulness of PopViz is illustrated by a schematic example and three recent studies (IRF4 mutations in Whipple’s disease (Guerin et al., 2018), IKZF1 mutations in common variable immunodeficiency (Kuehn et al., 2016) and DBR1 mutations in herpes simplex encephalitis (Zhang et al., 2018)] in the Supplementary Material. PopViz will be updated in line with the new releases of the resources used, and we also anticipate the integration of additional resources into PopViz.
Acknowledgements
We thank S. Boisson-Dupuis, Q. Zhang, L. Shang and R. Yang for discussions, Y. Nemirovskaya and D. Papandrea for administrative support. Z. Yang for artwork. We thank X. Zeng from National University of Singapore for technical assistance.
Funding
This study was supported in part by the National Institute of Allergy and Infectious Diseases (NIAID) of the National Institutes of Health (NIH) (grants R01AI088364 &P01AI061093), the Rockefeller University, and the Charles Bronfman Institute for Personalized Medicine, Icahn School of Medicine at Mount Sinai.
Conflict of Interest: none declared.
References
Author notes
The authors wish it to be known that, in their opinion, the Bertrand Boisson and Yuval Itan authors should be regarded as Joint Last Authors.

