


Abstract
Deciphering the functional roles of cis-regulatory variants is a critical challenge in genome analysis and interpretation. It has been hypothesized that altered transcription factor (TF) binding events are a central mechanism by which cis-regulatory variants impact gene expression levels. However, we lack a computational framework to understand and quantify such mechanistic contributions.
We present TF2Exp, a gene-based framework to predict the impact of altered TF-binding events on gene expression levels. Using data from lymphoblastoid cell lines, TF2Exp models were applied successfully to predict the expression levels of 3196 genes. Alterations within DNase I hypersensitive, CTCF-bound and tissue-specific TF-bound regions were the greatest contributing features to the models. TF2Exp models performed as well as models based on common variants, both in cross-validation and external validation. Combining TF alteration and common variant features can further improve model performance. Unlike variant-based models, TF2Exp models have the unique advantage to evaluate the functional impact of variants in linkage disequilibrium and uncommon variants. We find that adding TF-binding events altered only by uncommon variants could increase the number of predictable genes (R2 > 0.05). Taken together, TF2Exp represents a key step towards interpreting the functional roles of cis-regulatory variants in the human genome.
The code and model training results are publicly available at https://github.com/wqshi/TF2Exp.
Supplementary data are available at Bioinformatics online.
1 Introduction
Understanding the functional roles of genetic variants in human disease is a fundamental challenge in medical genetics. Whole genome sequencing (WGS) enables clinicians to systematically seek variants that contribute to disease phenotype. Current clinical approaches focus primarily on the ∼2% of the genome coding for proteins, yet up to 88% of disease-related variants in genome-wide association studies are located within noncoding regions (Hindorff et al., 2009). However, predicting the functional impact of noncoding variants remains a challenge. With the rapid accumulation of WGS data, there is a recognized need for bioinformatics methods that provide mechanistic insights into noncoding variants.
Gene expression is a key intermediate phenotype for genetic studies. Substantial progress has been made on detecting statistical relationships between variants (single-nucleotide variants and short indels) and gene expression levels. These expression quantitative trait loci (eQTL) are enriched in regulatory regions, including promoters, enhancers and transcription factor (TF) bound regions, revealing the potential functional mechanisms of these variants (Lappalainen et al., 2013; The Encode Project Consortium, 2012). Partially based on the success of eQTL analysis, regression-based models trained on common variants (minor allele frequency, MAF ≥ 0.05) proximal to genes have been developed to predict gene expression levels (Gamazon et al., 2015; Manor and Segal, 2013). Such correlative approaches are useful, yet they lack the resolution to direct researchers to specific functional variants for two reasons. First, functional variants are hard to infer in association studies due to linkage disequilibrium (LD) between variants (Farh et al., 2014). Second, uncommon variants (minor allele frequency, MAF < 0.05) are excluded from most association studies, yet, rare variants (MAF < 0.01) are often causal for familial genetic disorders (Gibson, 2012; Lappalainen, 2015) and have been hypothesized to contribute to human complex traits (Bomba et al., 2017). Both reasons can be considered from the perspective of model feature engineering (i.e. how to incorporate model features). Current models use genotypes as predictors and defer the annotation of variant function until a model is constructed. To focus upon function, an alternative choice is to introduce model features emphasizing regulatory regions, which should increase the biological insights of gene expression models.
It has been hypothesized that altered TF-binding events are a central mechanism by which cis-regulatory variants impact gene expression (Pai et al., 2015). TFs bind to specific locations in the genome, which can be identified experimentally by methods such as chromatin immunoprecipitation combined with sequencing (ChIP-seq). Machine learning approaches coupled to extensive TF ChIP-seq data have enabled predictions of TF-bound regions across the genome (Zhou and Troyanskaya, 2015). Altered or disrupted TF-binding events have been associated with various diseases, including osteoarthritis (Dodd et al., 2013), type-2 diabetes (Claussnitzer et al., 2015) and colorectal cancer (Wang et al., 2016). Recently, the compilation of altered TF-binding events has increased, and computational models have emerged to predict such events (Chen et al., 2016; Shi et al., 2016). However, bioinformatics approaches that quantify the relationship between altered TF-binding events and personalized gene expression levels remain elusive.
To bridge this gap, we have developed TF2Exp models to infer relationships between personalized gene expression and altered TF-binding events caused by cis-regulatory variants. We have explored the utility of TF2Exp in answering four important questions: (i) are alterations of TF-binding events predictive of personalized gene expression levels?; (ii) what are the characteristics of the functional altered TF-binding events?; (iii) do TF2Exp models perform as well as the state-of-the-art variant-based models?; and (iv) are TF2Exp models able to infer functional variants in LD and uncommon variants? Our results show that TF2Exp models successfully predict the alteration of gene expression for over three thousand genes, with an average performance comparable to that of models based on variants. Our framework systematically reveals the mechanism by which cis-regulatory variants impact gene expression, providing unique interpretive capacity for future human genetic studies.
2 Materials and methods
2.1 Quantifying gene expression from RNA-seq data
Lymphoblastoid cell line (LCL) RNA-seq and variant-calling data for 358 individuals from European populations were downloaded from the GEUVADIS project (Lappalainen et al., 2013) and the 1000 Genomes Project (1000 Genomes Project Consortium et al., 2015) (Supplementary Notes). Individuals covered 4 populations, including 89 Utah residents with Northern and Western European ancestry (CEU), 92 Finns (FIN), 86 British (GBR) and 91 Toscani (TSI). For each population, we built sex-specific transcriptomes in which SNP positions with MAF ≥ 0.05 were replaced by N (representing any of the four nucleotides A, C, G, T) using scripts from (Grubert et al., 2015). RNA-seq data were processed using Sailfish (version 0.6.3) (Patro et al., 2014), and expression levels of each gene were quantified as transcripts per million reads. The resulting expression data were normalized via multiple steps, including standardization, variation stabilization, quantile normalization and batch effects removal (i.e. population and gender, and 22 hidden covariates) by PEER (Stegle et al., 2012) (Supplementary Fig. S1). Any gene that was either on the sex chromosomes or showed near-zero variance in expression levels was removed, leaving 16 354 genes for model training.
2.2 Associating TF-binding events to genes using Hi-C data
We obtained Hi-C proximity scores measuring physical interactions between DNA regions (Hi-C fragments) in GM12878 cells (an LCL) from (Grubert et al., 2015). The average size of Hi-C fragments was 3.7 kb (Grubert et al., 2015). For each gene, the proximal region was defined as the ±2 kb region centered at the start position of that gene [outermost transcript start position annotated by Ensembl (Aken et al., 2016) in genome assembly GRCh37]. Proximal regions were extended to include any overlapping Hi-C fragments, and extended proximal regulatory regions have a median length of 11.3kb (Supplementary Fig. S2). Within 1 Mb of gene body (as delimited by the outermost transcript start and end), distal regulatory regions were defined as Hi-C fragments interacting with (proximity score > 0.4), but not overlapping, the proximal region of that gene. The median distance between distal regulatory regions and TSSs is 300.0kb (Supplementary Fig. S3). Uniformly processed GM12878 DNase I hypersensitivity sites (DHSs) and ChIP-seq peaks for 77 TFs were downloaded from the ENCODE project (The Encode Project Consortium, 2012). As DHS is a general indicator of TF binding (Neph et al., 2012), DHSs are referred to as part of the set of TF ChIP-seq peaks within this manuscript for editorial convenience. A TF-binding event was associated to a gene if the ChIP-seq peak overlapped the proximal or a distal regulatory region of the gene. The resulting associations between genes and TF-binding events derived from GM12878 cells were used as the reference for all studied individuals.
2.3 Predicting sequence variation impact on TF-binding events
Variant-calling data of each individual was downloaded from the 1000 Genomes Project (release 20130502) (1000 Genomes Project Consortium et al., 2015). We only considered single nucleotide variants and small indels (<100bp). For each individual, the impact of a variant within a TF-binding event was evaluated as the binding score difference between the altered and reference alleles, as determined by the corresponding DeepSEA (v0.93) TF-binding model trained on GM12878 data (Zhou and Troyanskaya, 2015). DeepSEA is a deep learning-based tool that accurately predicts the binding probability of a TF to any DNA sequence in certain cell types. To allow for the analysis of multiple variants within a TF-binding event, we modified DeepSEA to calculate the binding score of each allele using the 1100 bp region centered at the ChIP-seq peak-max position (the original code would center the 1100 bp region at each variant). Score differences of multiple variants within the same TF-binding event were aggregated to represent the overall alteration of that event. TF ChIP-seq peaks with multiple peak-max positions and overlapped peaks from the same experiment were split at the center of each pair of neighboring peak-max positions. At heterozygous positions, the binding score difference was divided by two. Lastly, we calculated the LD between variants across studies individuals using plink2 (Chang et al., 2015).
2.4 Quantitative models of gene expression
Defining TF-TF interactions: For TFs known to interact in the BioGrid database (Chatr-Aryamontri et al., 2015), we created interaction terms between pairs of TF-binding events (one from each TF) if they satisfied one of the following conditions: 1) two binding events overlapped by at least 200 bp; or 2) their regulatory regions were reported to interact in the Hi-C data.
2.5 External validation with expression data
For external validation of TF2Exp models on microarray data, we relied on expression levels of 15 997 Ensembl genes for LCLs of 80 CEU, 87 Chinese (CHB) and 89 Japanese (JPT) individuals (Stranger et al., 2012). For these individuals, variant data was retrieved from the 1000 Genomes Project. We applied TF2Exp models to predict gene expression levels from potentially altered TF-binding events based on the variant data, and compared these predictions with the gene expression levels reported from the microarray.
To test TF2Exp models on GTEx data (GTEx Consortium, 2017), called genotype variants and expression levels derived from GTEx project were obtained from dbGAP (release phs000424.v7.p2). For each tissue, expression data were normalized similarly to LCLs (see section ‘Quantifying gene expression from RNA-seq data’): standardization of the data, followed by quantile normalization and batch effects removal (i.e. gender and 20 hidden covariates) by PEER (Stegle et al., 2012). GTEx eQTLs data (version 6) were downloaded from https://gtexportal.org/home/datasets.
3 Results
3.1 TF2Exp: regression models to predict the impact of altered TF binding on gene expression levels
We developed TF2Exp, a gene-based computational framework to assess the impact of altered TF-binding events on gene expression levels (Fig. 1). As detailed in Section 2, variant-calling data (single nucleotide variants and small indels) and gene expression data for 358 lymphoblastoid cell lines (LCLs) were obtained from the 1000 Genomes (1000 Genomes Project Consortium et al., 2015) and GEUVADIS projects (Lappalainen et al., 2013). Moreover, TF-bound regions for 77 distinct TFs and DNase I hypersensitivity sites (DHSs) were obtained from the ENCODE project for the GM12878 LCL (The Encode Project Consortium, 2012). TF-binding events (inclusive of DHSs) were associated to a gene if they overlapped either the proximal or distal regulatory region of that gene (see Section 2). The impact of each single variant within a TF-binding event was scored using DeepSEA (Zhou and Troyanskaya, 2015), and multiple variants within the same TF-binding event were aggregated to generate an overall alteration score of that TF-binding event in each individual. On average, each gene had 420.0 altered TF-binding events within 36.6 regulatory regions (both proximal and distal) across the 358 individuals. Based on the computed alteration scores of TF-binding events in each individual, a regression model was trained by LASSO (Friedman et al., 2010) for each gene to predict expression levels and to identify the key contributing TF-binding events. For users seeking to apply the trained models, note that TF2Exp models only require genotype data as input and will output the predicted expression changes for the corresponding genes. The TF2Exp framework is publicly available at https://github.com/wqshi/TF2Exp.
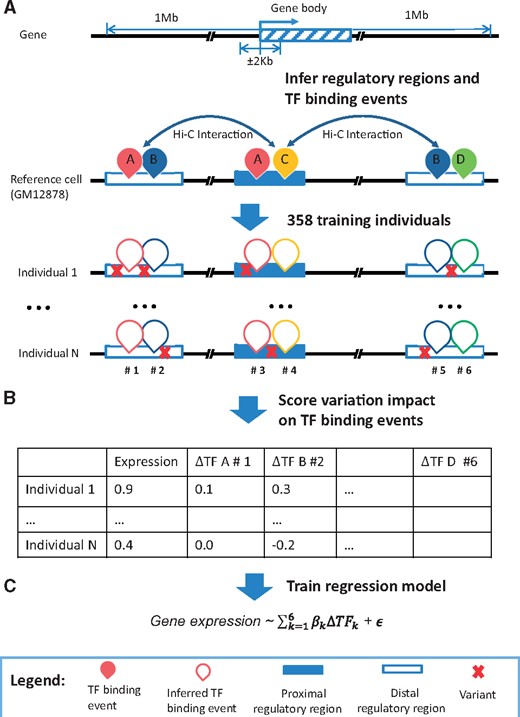
Overview of the TF2Exp framework. (A) Infer regulatory regions and TF-binding events of each gene based on the reference cell line (GM12878). Distal regulatory regions are associated to a gene according to Hi-C data. TF-binding events on the proximal or distal regulatory regions of a gene are assigned to that gene. (B) Score the alteration of TF-binding events based on the overlapped variants for each individual. (C) Train regression models for each gene across the collected individuals
3.2 TF2Exp predicts the expression levels for a subset of genes
We successfully trained TF2Exp models for 15 887 genes. Average model performance (R2) by 10-fold cross-validation was 0.049, with most models having low predictive power (Fig. 2). To assess the impact of random noise in the model training process, we set up control models in which gene expression levels were shuffled across individuals while preserving TF binding features. Control models achieved an average R2 of only 3.6 × 10⁻⁵ (Fig. 2), indicating that the signal captured by TF2Exp models is not random. Repeating the randomization process 20 times for the genes on chr1 showed mean performance of 4.0 × 10⁻⁵ and maximum performance of 0.048, respectively. To focus on predictive models, we applied an R2 threshold of 0.05 as in (Manor and Segal, 2013), resulting in models for 20.1% of genes (hereinafter referred to as predictable genes). As in the work of Manor et al. (Manor and Segal, 2013), we observed a significant correlation between model performance and variance of expression levels for the predictable genes (Spearman’s correlation = 0.21, P-value < 2.2 × 10⁻¹⁶; Supplementary Fig. S4). We performed gene ontology (GO) enrichment analysis using GREAT (McLean et al., 2010). The top 10% predictable genes were enriched in pathways including graft-versus-host disease and allograft rejection, terms which are relevant to the roles of B cells (i.e. the cell type before transforming to LCL) in the immune system. In contrast, we did not observe any enriched GO term for the top 10% of genes with the highest expression variance, highlighting the ability of TF2Exp to capture expression levels relevant to the sample of interest.
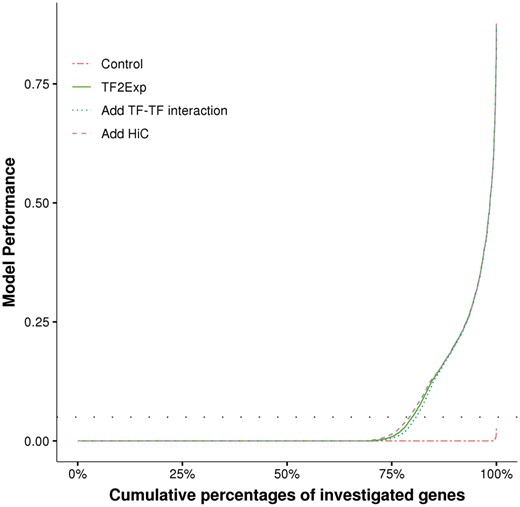
Performance comparison of alternative TF2Exp models. For each type of TF2Exp model, performances (R2) of investigated genes (y axis) are plotted in ascending order with respect to the cumulative percentage of genes (x axis). The horizontal dashed line indicates the defined performance threshold of 0.05 for predictable genes
We next assessed whether prior knowledge, such as Hi-C proximity scores and known TF-TF physical interactions, could improve TF2Exp models. We introduced the proximity scores of Hi-C interactions to guide model fitting, so that TF-binding events on highly-interacting regions would be less regularized by LASSO (Section 2). We observed that adding Hi-C proximity scores resulted in a slight R2 improvement of 1.6 × 10⁻³ (Wilcoxon signed-rank test, P-value = 1.5 × 10−41), suggesting that the original TF2Exp models had captured most of the signal from the Hi-C data. We also tested models including interaction terms for known TF-TF physical interactions (Section 2). Adding TF-TF interactions significantly reduced model performance by 2.2 × 10⁻³ (Wilcoxon signed-rank test, P-value = 4.6 × 10−152, Fig. 2), potentially due to our incomplete knowledge of TF-TF interactions and/or limited training samples. Taken together, models incorporating prior knowledge achieved similar performance to the original ones. Thus, we focused on the original (and simpler) TF2Exp models in the next stages of the analysis.
3.3 Alterations of DHS, CTCF and tissue-specific TF binding are the most frequently selected features
We next sought to identify TFs for which binding events were more frequently selected in TF2Exp models. For the predictable genes, models selected an average of 4.2 key features (where a feature was the alteration score of a single TF-binding event). Frequently selected TFs had more binding events across the genome (Pearson correlation 0.97, P-value < 2.2 × 10⁻¹⁶). The top 5 selected TF features were DHS, RUNX3, CTCF, EBF1 and PU.1, accounting for 33.6% of the selected features (Fig. 3). Particularly, 42.0% of the predictable genes had at least one DHS feature, which is in agreement with the well-known relationship between chromatin accessibility and gene expression (Natarajan et al., 2012). CTCF has diverse roles in gene regulation across multiple tissues (Ong and Corces, 2014), and the remaining three TFs perform important roles in LCL tissue-specific regulation: RUNX3 in immunity and inflammation (Lotem et al., 2015), EBF1 in B lymphocyte transcriptional network expression (Hagman et al., 2012) and PU.1 in lymphoid development (Iwafuchi-Doi and Zaret, 2014). Lastly, we observed that RAD21 and SMC3, despite being among the top 10 TFs with the highest number of peaks in the training set (Fig. 3), were selected less frequently than the other 8 TFs (<0.65%), in accordance with their nature of non-sequence specific DNA-binding.
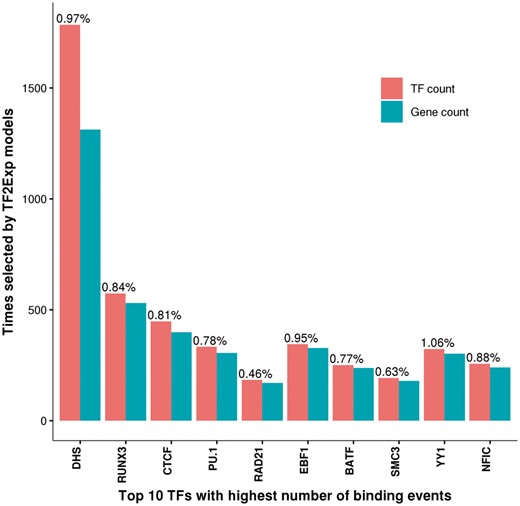
Top 10 TFs with the highest number of binding events and their selection frequency in predictable genes. Red bars indicate the total number of TF-binding events selected by TF2Exp models. Blue bars indicate the total number of genes that selected binding events of the indicated TF as key features. The percentage on top of each red bar indicates the ratio between the number of selected events in TF2Exp models and the total number of peaks for that TF
3.4 Selected TF-binding events correlate with gene expression levels in vivo
We next sought to assess whether in vivo TF binding of selected features correlated with gene expression levels. We obtained CTCF and PU.1 ChIP-seq LCL data for two independent sets of 45 originally-training individuals (see Supplementary Notes). TF-binding signals were extracted from the reference GM12878 TF-binding events (i.e. the ChIP-seq features used in the TF2Exp for model construction). In predictable genes, 83 CTCF and 72 PU.1 binding events were selected for testing based on their high variance of binding score change (see Section 2). Eight CTCF (9.7%) and seven PU.1 (9.6%) of the tested in vivo binding events significantly correlated with gene expression levels (Pearson correlation, FDR <0.05), and their correlation coefficients were consistent with the correlation estimated between the TF sequence alteration score and gene expression (P-value= 1.4 × 10⁻⁴, coefficient = 0.81). Due to limited size of test samples (n = 45), we did not have sufficient statistical power to detect weakly correlated TF-gene relationships (e.g. coefficient < 0.29, see Supplementary Notes), which accounted for most (89.7%) of the tested in vivo binding events. In summary, we observed that 9.7% of TF-binding events selected by TF2Exp displayed detectable correlation (correlation coefficient > 0.29) between in vivo binding and gene expression levels.
3.5 Selected TF-binding events within proximal regions have greater effect sizes
We next examined the locations and effect sizes of selected features. In proximal regions, selected features were mostly within 10 kb from gene start positions, while, in distal regulatory regions, they were distributed within ∼500 kb. We observed significant depletion of selected features in distal regulatory regions compared with proximal regions (Fisher’s exact test, odds ratio = 0.11, P-value < 2.2 × 10⁻¹⁶). Effect sizes of TF-binding events decreased rapidly with respect to the distance from gene start positions (Supplementary Fig. S5A). Such a trend has been reported for effect sizes of eQTLs (Battle et al., 2014). Selected features in proximal regions also exhibited significantly larger absolute effect sizes (Wilcoxon rank-sum test, P-value = 7.3 × 10−68, Supplementary Fig. S5B) and more positive effects (Wilcoxon rank-sum test, P-value = 4.22 × 10⁻⁵) than features in distal regulatory regions. Nevertheless, the selected distal features of a gene were significantly enriched in the enhancer regions associated to that gene, as specified in the FANTOM5 project (Andersson et al., 2014) (Fisher's exact test, odds ratio = 1.3, P-value = 0.002, see Supplementary Notes), supporting a functional role of the selected distal TF-binding events. Thus, TF2Exp models are identifying cis-regulatory sequence variants that bring functional insights into the mechanisms underlying gene expression levels.
3.6 Uncommon variants increase the number of predictable genes
As TF2Exp models can distinguish the impact of variants in TF-binding events, we investigated the contribution of uncommon (MAF < 0.05) variants to model performance. TF2Exp models trained only on uncommon variants achieved higher average performance (R2 = 0.004) than control models, indicating that the contribution of uncommon variants was not random. To further explore the predictive potential of uncommon variants, we divided TF-binding events into two classes: (i) events altered only by uncommon variants (i.e. do not include any common variants); and (ii) the rest of events overlapping at least one common variant. Note that, by definition, class-2 events can still contain uncommon variants. After adding class-1 events on top of class-2 events, there was a mean performance improvement of 3.8 × 10⁻⁴, and the number of predictable genes increased to 3177 compared with 3139 genes for models trained only on class-2 events. To test whether this observation was due to random effects, we shuffled class-1 events across individuals. For shuffled models, the number of predictable genes decreased to 3076, suggesting that the benefit of using TF-binding events altered only by uncommon variants was not random. Moreover, in pairwise comparison between the two models for the same gene (i.e. adding class-1 events or not), 31.4% of shared predictable genes gained performance increase (6.7×10⁻³ on average) after adding, while 37.2% of genes showed performance decrease but with smaller alteration (4.7×10⁻³ on average). Furthermore, the newly selected features in the improved models were enriched at proximal regulatory regions compared with those models with decreased performance (Fisher's exact test, P-value = 3.2 × 10⁻⁵, odd ratio = 1.8).
To avoid noisy uncommon variants, we next focused on TF-binding events altered only by uncommon variants (class-1 events) within proximal regions. After adding these events, the number of predictable genes increased to 3179. Although the two types of models performed similarly for most cases (Wilcoxon rank sum test, P-value = 0.51; Fig. 4), there was a significant mean performance improvement of 5.9 × 10⁻⁴ after adding class-1 events (Welch's t-test, P-value = 4 × 10⁻⁴). While 95% of the genes showed small absolute performance alteration (1.6 × 10⁻³ of R2 on average), for the remaining ∼5% of genes, adding class-1 events enabled significantly larger performance improvement (Fig. 4; Wilcoxon rank sum test, P-value = 4.6 × 10⁻⁵, estimated difference = 1.5 × 10⁻²).
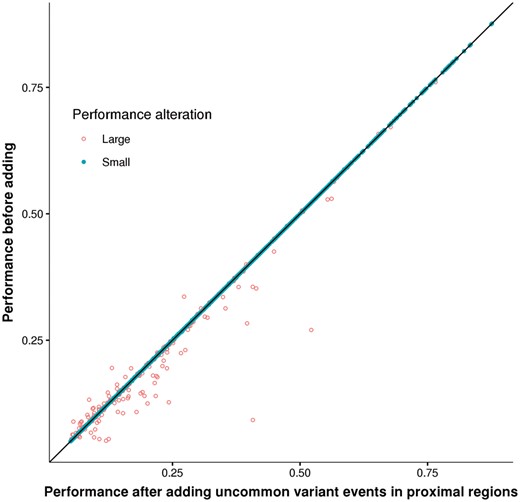
Performance comparison after adding uncommon-variant only events in proximal regulatory regions. Each dot represents an evaluated gene-model. Coordinates (x and y) indicate the cross-validation performances before or after adding TF-binding events altered only by uncommon variants in proximal regulatory regions, respectively. The dot shape indicates the magnitude of absolute performance alteration, solid for small alteration (<1.6 × 10⁻³, 95% quantile of the absolute performance alteration) and circle for the rest genes with larger alteration
3.7 Alteration of TF-binding events improve the performance of variant-based models
We compared our TF2Exp models with state-of-the-art models that predict alteration of gene expression levels based on proximal variants (Gamazon et al., 2015; Manor and Segal, 2013) (see Section 2). First, we trained TF2Exp and variant-based models on the same set of common variants (variants within TF-binding events, MAF ≥ 0.05) for each gene. Both models showed comparable performance across the shared predictable genes (Wilcoxon signed-rank test, P-value = 0.15; Supplementary Fig. S6). In addition, the default variant-based models using all the proximal common variants within 1 Mb of the gene body showed better performance than TF2Exp models trained on common variants (Wilcoxon signed-rank test, P-value = 0.06), potentially due to variants in unknown TF-binding events. As uncommon variants are informative for a subset of TF2Exp models, we trained models on combined features of the default variant-based model and the default TF2Exp model for each gene. Combined models achieved better performance than variant-based models (Wilcoxon signed-rank test, P-value = 0.02, estimated median difference = 1.8 × 10⁻⁴), in agreement with the positive contribution of proximal uncommon variants observed in the previous section.
We further explored whether introducing binding events of new TFs would improve model performance. We collected and added TF-binding events of 92 new TFs from other cell types (175 ENCODE ChIP-seq datasets) to TF2Exp models, and tested the model performance of genes in 5 chromosomes (chr1-2 and chr20-22). High performance genes (R2 > 0.25) in TF2Exp models gained significant improvement (Wilcoxon signed-rank test, P-value = 0.03, estimated median difference = 5.3 × 10⁻⁴) after the addition of binding events for new TFs, while the rest of the genes were better represented with the original models (Wilcoxon signed-rank test, P-value = 7.7 × 10⁻⁵, estimated median difference = 1.6 × 10⁻³). These findings suggest that additional TF sets are informative, but model performance is limited by the size of training samples.
3.8 TF2Exp models distinguish variants in LD compared with variant-based models
Unlike variant-based models, TF2Exp models are able to infer the functional roles of variants in linkage disequilibrium (LD) based on the predicted impact of variants on TF-bound regions. Comparing TF2Exp and variant models on the same set of common variants (variants within TF-binding events), most selected binding events in TF2Exp models (62.7%, n = 12 663) overlapped selected variants (59.8%, n = 9386) in variant-based models for the same gene. Of the total of overlapped variants, 18.4% were in high LD (r2 > 0.9) with other variants in the same TF-bound regions, hindering the inference of the causal variants by variant-based models. Using TF2Exp models, we found that 36.8% of the linked variants showed at least a two-fold impact on the overlapped TF-bound region compared with the selected variants (Supplementary Fig. S7), suggesting a more dominant contribution of the linked variants. In addition, a subset of selected variants (20.1%) overlapped with more than one selected TF-binding event, indicating that individual variant could alter multiple mechanisms of gene regulation. Overall, TF2Exp models provide a quantitative way to evaluate the impact of variants in LD, suggesting a broader utility for genomic studies than variant-based models.
3.9 TF2Exp models exhibit robust performance in external validation datasets
We finally sought to evaluate TF2Exp models of predictable genes on external datasets. We obtained microarray expression data from LCLs of 256 individuals (Stranger et al., 2012), including 80 Utah residents with Northern and Western European ancestry (CEU), 87 Chinese (CHB) and 89 Japanese (JPT) (Section 2). As 79 of the CEU individuals overlapped with the training individuals of TF2Exp models, we first evaluated the agreement between the microarray and RNA-seq data on these individuals. Relative expression levels across all genes within each individual were concordant between microarray and RNA-seq experiments (average Spearman’s correlation = 0.76), supporting an overall consistency between the two datasets. However, when we considered a single gene across the 79 individuals, the correlation between the two platforms was low (average Spearman correlation = 0.19). Therefore, we expected models trained on RNA-seq data to have an upper limit performance when applied to microarray data. We used TF2Exp models (trained on CEU individuals) to predict gene expression levels on the CHB and JPT individuals. Predictable TF2Exp models achieved an average correlation of 0.16 for both populations. Similarly, predictable variant-based models achieved an average correlation of 0.17 for both populations.
An example of a high performing gene (FAM105A) in the external validation is illustrated in Figure 5. FAM105A is associated with pancreatic islet function and type 2 diabetes (Pedersen et al., 2017; Taneera et al., 2015). For this gene, TF2Exp identified 4 contributing TF-binding events (Fig. 5), of which two of them had greater weights: DHS (chr22: 45711760-45711910, effect size: −0.325) and MEF2A (chr22: 45771822-45772122, effect size: 0.334). Alterations of these key events largely explained the changes of gene expression across the different individuals. For example, NA18640 had the lowest observed expression level in CHB individuals, as variant rs104664 of this individual was predicted by TF2Exp to increase the score of DHS; while rs5765304 in NA18573 increased MEF2A binding scores, resulting in the highest predicted expression across all individuals.
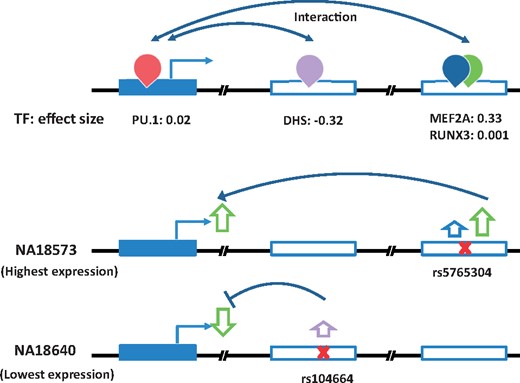
Key features of TF2Exp for FAM105A gene in the external validation set. The top panel illustrates the key TF-binding events learned from the training datasets. The figure legend is the same as for Figure 1. The middle and bottom panel show the variants within the key TF -binding events and their inferred roles on gene expression for the two individuals
To test model performance on tissues other than LCLs, we applied TF2Exp models of predictable genes on chromosome 1 to ten tissues with the largest sample sizes from the GTEx project (GTEx Consortium, 2017). Average Pearson correlations between predicted and observed expression levels ranged from 0.11 to 0.08 across the 10 tissues (Supplementary Table S1). Despite the expected performance loss in non-LCL tissues, TF2Exp models displayed robust performance, highlighting their potential application to other (non LCL) cells or tissues. Moreover, for eQTLs identified by GTEx project in these tissues on chromosome 1, TF2Exp correctly predicts the direction of expression change for 79% of the variants within key TF-bound regions and, akin to the assessment used in the recently published ExPecto paper (Zhou et al., 2018), for 91% of top 500 variants with strongest predicted expression impact overlapping key TF-bound regions within 20 kb of the TSS.
4 Discussion
Deciphering the functional roles of regulatory variants is a critical challenge in the post-sequencing era. To address this challenge, we have introduced a novel framework, TF2Exp, which uses alterations of TF binding as key features to elucidate the functional impact of regulatory variants and predict personalized gene expression levels. TF2Exp models based on lymphoblastoid cell line data showed predictive capacity for 3196 genes, incorporating an average of 4.2 altered TF-binding events per gene model. The most frequently selected TF-binding events included both general properties (e.g. alterations within DNase I hypersensitive regions) and tissue-specific properties (e.g. alterations in TF-bound regions for TFs relevant to the studied lymphoblastoid samples). TF2Exp models could incorporate uncommon variants to improve model performance, and provide mechanistic insights into cis-regulatory variants.
TF2Exp models have the potential to address two challenges left unresolved by variant-based models and classical eQTL studies. For these approaches, it is difficult to: (i) infer variant function (the studied variants can be in high linkage disequilibrium with many others); and (ii) evaluate the impact of uncommon variants (which are excluded from such analyses). By treating TF-binding events as functional units, TF2Exp models can evaluate the relative impact of any variant (single nucleotide variants or small indels) within a TF-bound region. As in the example presented in Figure 5, for individual variants, the derived impact within the model is independent of linkage disequilibrium or allele frequency. Moreover, even though the inclusion of uncommon (and rare) variants only improved model performance for a small portion of genes, the resulting TF2Exp models offer a unique advantage for the inference of functional cis-regulatory variants, compared with previous variant-based methods (Gamazon et al., 2015; Manor and Segal, 2013).
Similarly to variant-based methods, the predictive performance of TF2Exp models is limited, showing utility only for a subset of genes (20.1%), and even within these genes, model performance was modest (R2 = 0.21). Such a limited performance is likely attributable to multiple causes. First, variance of gene expression due to common variants is quite low [e.g. 15.3% as estimated by Gamazon et al. (2015)], suggesting that models restricted to DNA sequence features alone can only account for a portion of the observed variance in gene expression levels. Second, TF2Exp models are limited by the availability of ChIP-seq data (78 TFs in LCLs), while transcriptome studies have revealed that human cells express an average of 430 TFs (The Fantom Consortium, 2014). Though we anticipate an increasing amount of available ChIP-seq data in the future, a practical and more immediate solution would be to computationally predict TF-bound regions. To improve TF-binding prediction, multiple tools combine DNA sequence and chromatin properties (e.g. ATAC-seq, DHS or histone modifications) of the target tissue (Pique-Regi et al., 2011); these types of data are currently available for >100 primary tissues and cells (Roadmap Epigenomics Consortium et al., 2015). Third, TF2Exp models focus on TF-binding events potentially involved in transcriptional regulation, but other regulatory mechanisms (e.g. post-transcriptional regulation) or genomic features (e.g. DNA methylation or sequence conservation) might explain an additional portion of the observed variance of gene expression. Fourth, TF2Exp models are likely constrained by the small number of available training samples, as including additional features (e.g. TF-TF interactions and uncommon variants) decreased model performance. We expect that the expansion of reference transcriptome datasets will provide more samples for exploring more complex relationships between genes and TF-binding events, thereby improving model performance.
During the review process of this manuscript, a new related tool named ExPecto was published (Zhou et al., 2018). Though both TF2Exp and ExPecto take DNA sequences as input to predict gene expression levels, the tools differ significantly from each other as they focus on distinct types of variance of gene expression. ExPecto uses a single regression model per tissue to predict the variance of gene expression levels across all the genes (i.e. ‘intra-individual’ variance). In contrast, TF2Exp uses one model per gene per tissue to predict the variance of gene expression levels of that gene across the different individuals (i.e. ‘inter-individual’ variance). Past studies have shown that intra-individual variance is easier to predict than inter-individual variance based on regulatory features. For instance, H3K27ac levels correlate well with broad gene expression in CD4+ T cells (intra-individual variance; Pearson’s correlation coefficient = 0.72) (Karlic et al., 2010), while in lymphoblastoid cells from 47 individuals, they only correlate with the expression levels of 22% of genes (inter-individual variance) (Waszak et al., 2015). While the reported model performance measures for TF2Exp and ExPecto are not directly comparable, emerging independent datasets should enable benchmarking of the two tools in the future. It should also be noted that while the performance of ExPecto did not increase with the inclusion of distal regions (more than 20 kb distal from the TSS), the inclusion of distal features in TF2Exp was beneficial (as shown in Supplementary Fig. S5). We suspect that such difference lies in the TF2Exp focus on candidate distal regulatory regions supported by Hi-C and TF binding data.
In conclusion, identifying the impact of cis-regulatory variants on gene expression is a critical step towards understanding the genetic mechanisms contributing to diseases. TF2Exp models are able to predict the impact of TF-binding on gene expression levels and provide mechanistic insights into the roles of selected TF-binding events and cis-regulatory variants. We anticipate that future enlarged omics data, in LCLs and other cell types, will greatly expand the application scope of TF2Exp models.
Acknowledgements
The authors thank the Wasserman lab members for helpful discussions, Miroslav Hatas for systems support and Dora Pak for management support. In particular, the authors thank Rachelle Farkas, Alice M. Kaye and David Arenillas for thorough proof-reading of this manuscript. We thank Dr. Sara Mostafavi for the guidance to apply and access the GTEx data.
Funding
This work was supported by Genome Canada/CIHR/Genome BC [174DE], the Natural Sciences and Engineering Research Council of Canada [RGPIN355532-10], the National Institutes of Health (USA) [1R01GM084875] and PhD fellowship from China Scholarship Council [201206110038] [to WS]. Funding has been provided by the BC Children’s Hospital Foundation to WWW. Funding for open access charge: Genome Canada Bioinformatics and Computational Biology (255ONT), Canadian Institutes of Health Research (CIHR): Bioinformatics and Computational Biology (BOP-149430).
Conflict of Interest: none declared.
References

