-
PDF
- Split View
-
Views
-
Cite
Cite
Swaine L Chen, Implementation of a Stirling number estimator enables direct calculation of population genetics tests for large sequence datasets, Bioinformatics, Volume 35, Issue 15, August 2019, Pages 2668–2670, https://doi.org/10.1093/bioinformatics/bty1012
Close - Share Icon Share
Abstract
Stirling numbers enter into the calculation of several population genetics statistics, including Fu’s Fs. However, as alignments become large (≥50 sequences), the Stirling numbers required rapidly exceed the standard floating point range. Another recursive method for calculating Fu’s Fs suffers from floating point underflow issues.
I implemented an estimator for Stirling numbers that has the advantage of being uniformly applicable to the full parameter range for Stirling numbers. I used this to create a hybrid Fu’s Fs calculator that accounts for floating point underflow. My new algorithm is hundreds of times faster than the recursive method. This algorithm now enables accurate calculation of statistics such as Fu’s Fs for very large alignments.
An R implementation is available at http://github.com/swainechen/hfufs.
Supplementary data are available at Bioinformatics online.
1 Introduction
Population genetics statistics are commonly used to test for evolutionary inference from sequence alignments. Well-known statistics include Tajima’s D (Tajima, 1989), Fay and Wu’s H (Fay and Wu, 2000) and Fu’s D and F (Fu and Li, 1993). Another statistic, Fu’s Fs (Fu, 1997), was recently shown to be potentially useful for identifying the causative mutation leading to a recent population expansion in the bacterium Campylobacter jejuni (Wu et al., 2016). There are several existing software packages that can calculate Fu’s Fs. However, some of these programs fail to calculate Fu’s Fs when alignments become too large, and others disagree on the value. I show that these issues are due to floating point overflow and underflow, respectively. I developed a hybrid algorithm to circumvent these computational issues. I demonstrate that this algorithm is hundreds of times faster than another recursive algorithm that is usable on large alignments. My algorithm may be useful for further testing the utility of Fu’s Fs on contemporary datasets, which can easily be in the hundreds to thousands of sequences.
2 Materials and methods
Stirling numbers can grow large very quickly, leading to floating point overflow. To circumvent this, I used the Stirling number estimator developed by Temme (1993) [Equation (3.5) therein]. The use of the logit transformation leads to floating point underflow when is close to 1. Further details of the theory and program details can be found in the Supplementary Material, including Equations (A1)–(A10).
3 Results
I used several software programs to calculate Fu’s Fs using the fimH dataset (Table 1). PopGenome and PGEToolbox gave the same results for all tests; only results for PopGenome are shown. PopGenome and PGEToolbox explicitly calculate Stirling numbers as part of the Fu’s Fs calculation; neither provides an answer when the Stirling numbers overflow the floating point range in R or Matlab (1.8e + 308). In contrast, DnaSP uses a recursive algorithm based on Equations (19)–(23) from Ewens (1972), avoiding calculation of Stirling numbers. However, the other programs disagreed at some values (bold in Table 1).
Fu’s Fs values calculated on subsets of fimH sequences
| . | . | Pop genome . | DnaSP v5 . | DnaSP v6 . | Arlequin . | hfufs . | Bignum . |
|---|---|---|---|---|---|---|---|
| 5/5 | 7.80 | −0.678 | −0.678 | −0.678 | −0.678 | −0.678 | −0.678 |
| 10/9 | 7.69 | −2.294 | −2.294 | −2.294 | −2.294 | −2.294 | −2.294 |
| 25/20 | 9.39 | −6.832 | −6.832 | −6.832 | −6.832 | −6.832 | −6.832 |
| 50/31 | 9.61 | −10.129 | −10.129 | −10.129 | −10.129 | −10.130 | −10.129 |
| 100/40 | 9.37 | −10.230 | −10.230 | −10.230 | −10.230 | −10.231 | −10.230 |
| 250/67 | 8.96 | NaN | −26.409 | −26.410 | −24.115 | −26.409 | −26.409 |
| 500/95 | 9.04 | NaN | −47.06 | −31.781 | −23.964 | −46.763 | −46.763 |
| 1000/152 | 9.07 | NaN | −112.627 | −112.627 | −23.718 | −112.427 | −112.427 |
| 2001/213 | 9.03 | NaN | −192.343 | −30.617 | −23.596 | −192.181 | −192.181 |
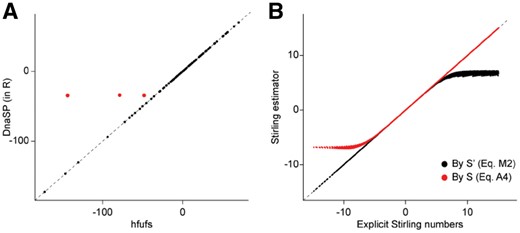
To reconcile the results, I implemented a Fu’s Fs calculator in R using the logarithmic Stirling number estimator (Temme, 1993). I also ported the Stirling number calculator from PGEToolbox and the recursive Fu’s Fs calculator from DnaSP v6. The limited range at low values of Fu’s Fs for DnaSP v6 is due to floating point underflow; because Fu’s Fs is calculated by Equation (A4), when the numerator is close to zero, two numbers close to 1 are subtracted, leading to a lower bound determined by machine precision (Fig. 1A). It occurs occasionally because the underflow test does not catch all cases (Table 1, bold underlined values for real data; Fig. 1A, red for simulated data). Arlequin suffers from a similar issue.
Validation of Fu’s Fs calculations. (A) Plot of Fu’s Fs calculated by the DnaSP V6 algorithm reimplemented in R versus the hfufs algorithm. Red dots indicate where underflow is not detected by the DnaSP code. (B) Plot of Fu’s Fs calculated using the Stirling number estimator versus using explicit Stirling numbers. Black dots calculated using Equation (2), red dots using Equation (A4). Dotted black lines are drawn at y=x
There are minor differences in Fu’s Fs values calculated by the different programs for ≥500 sequences (Table 1, bold bold values with no underlining). DnaSP v6 performs a second test for floating point underflow, in which case is estimated as [Equation (A4)], leading to this discrepancy. To further confirm which values were correct, I reimplemented the PGEToolbox algorithm in perl using the bignum package for arbitrary precision mathematics; these explicit values agree with those obtained using the logarithmic Stirling number estimator.
For Fu’s Fs values <0, those calculated using a Stirling number estimator agree well with those calculated using explicit Stirling numbers (Fig. 1B, black dots). For high values of Fu’s Fs (where is close to 1), the range is limited again because of floating point underflow ( is limited by machine precision). This can be rectified by using Equation (A4) with the Stirling number estimator, which now agrees with values calculated using explicit Stirling numbers (Fig. 1B, red dots).
Therefore, the final algorithm (termed hfufs for hybrid Fu’s Fs) is:
Direct calculation of Fu’s Fs using Stirling numbers if the number of alleles is relatively small ().
If n > 30, or there is overflow from direct calculation, then calculate Fu’s Fs using a Stirling number estimator.
If the value obtained is >0, then calculate Fu’s Fs using a Stirling number estimator by Equation (A4).
The DnaSP algorithm generally works well, but is recursive. I benchmarked my algorithm against the reimplemented DnaSP algorithm in R. R is notoriously slow for recursion, though caching of function results can help. I found that my algorithm was several hundred times faster [0.35 ± 0.09 s (for hfufs) compared with 162.65 ± 13.20 s for 100 calculations]. As expected, the recursive algorithm was far faster when rerun on the same parameter set (taking advantage of function caching for the recursive step; 0.89 ± 0.09 s for 100 calculations), but hfufs (which did not use caching) remained 2.5 times faster.
4 Conclusion
The hfufs algorithm solves issues with data size, floating point underflow and overflow, and accuracy in calculating Fu’s Fs. By avoiding recursion, it also improves speed. A software implementation in R is available at http://github.com/swainechen/hfufs.
Acknowledgements
I thank Shyam Prabhakar, Niranjan Nagarajan, Weiwei Zhai and the members of the Chen lab for useful discussions.
Funding
This work was supported by the National Medical Research Council, Ministry of Health, Singapore [grant numbers NMRC/CIRG/1357/2013, NMRC/CIRG/1467/2017]; and the Genome Institute of Singapore (GIS)/Agency for Science, Technology and Research (A*STAR).
Conflict of Interest: none declared.
References


