


Abstract
Chromosomal copy number aberrations can be efficiently detected and quantified using low-coverage whole-genome sequencing, but analysis is hampered by the lack of knowledge on absolute DNA copy numbers and tumor purity. Here, we describe an analytical tool for Absolute Copy number Estimation, ACE, which scales relative copy number signals from chromosomal segments to optimally fit absolute copy numbers, without the need for additional genetic information, such as SNP data. In doing so, ACE derives an estimate of tumor purity as well. ACE facilitates analysis of large numbers of samples, while maintaining the flexibility to customize models and generate output of single samples.
ACE is freely available via www.bioconductor.org and at www.github.com/tgac-vumc/ACE.
Supplementary data are available at Bioinformatics online.
1 Introduction
Cancer arises through accumulation of genetic and epigenetic changes. The genetic changes encompass small somatic mutations and gross chromosomal alterations, including translocation and copy number aberrations (CNAs). CNAs are a common trait of most cancers (Beroukhim et al., 2010) and are used as biomarkers in prognostic and predictive patient stratification (Macintyre et al., 2016).
Low-coverage whole-genome sequencing (lcWGS, ∼0.1X coverage of the genome) is an efficient and cost-effective method to detect CNAs. The data yield relative sequence depth signals at each genomic location, but does not enumerate chromosomal copies. Determining absolute copy numbers would add valuable information on tumor content (cellularity) and intratumoral heterogeneity of the samples. Currently available tools that provide estimates of absolute copy numbers are mostly limited to data generated by SNP arrays (Van Loo et al., 2010), whole exome sequencing or high-coverage WGS (Favero et al., 2015; Riester et al., 2016) or require matched normal samples (Gusnanto et al., 2012; Oesper et al., 2014). ABSOLUTE (Carter et al., 2012) and ichorCNA (Adalsteinsson et al., 2017) provide cellularity and ploidy estimates from lcWGS data, but lack dynamic functionality to visually inspect the absolute copy number estimations and select the best fits. We therefore developed a tool for Absolute Copy number Estimation, ACE, which includes dynamic data visualization. Using simulation data and a published dataset, we demonstrate that its estimates are generally more accurate than other software tools. Additionally, it offers an interactive environment to evaluate the optimal predicted model besides alternative models.
2 Materials and methods
ACE is an R package. Complete software availability, dependencies and version information is available in the Supplementary Material, via www.bioconductor.org and at www.github.com/tgac-vumc/ACE.
Segment data are obtained from lcWGS reads through the QDNAseq pipeline, which bins the mapped sequencing reads, corrects for mappabilty and GC-content (Scheinin et al., 2014) and segments the data by incorporating DNAcopy (Venkatraman and Olshen, 2007). For model fitting in ACE, errors per segment are calculated based on the difference between the segment value and the closest value of an integer copy number, as a function of ploidy and cellularity. ACE calculates the error of the fit as the root mean square error (default) or mean absolute error (optional) of all segments. To account for segment length, segment errors are repeated as many times as the number of bins the segment comprises. To balance sensitivity, specificity and accuracy, ACE features customizable penalty factors for low cellularity and divergent ploidies. See Supplementary Material for formulae and further details.
A fitting procedure is executed over a range of ploidies (Fig. 1A) or one fixed ploidy (Fig. 1B). Ploidy represents the number of copies associated with the median segment value. Error of fits are calculated for each cellularity and the indicated ploidy. Cellularities (and ploidies when variable) are reported when the error of the fit reaches a minimum. Inversely, absolute copy numbers of segments and bins are calculated using the derived cellularity and ploidy (Fig. 1C).
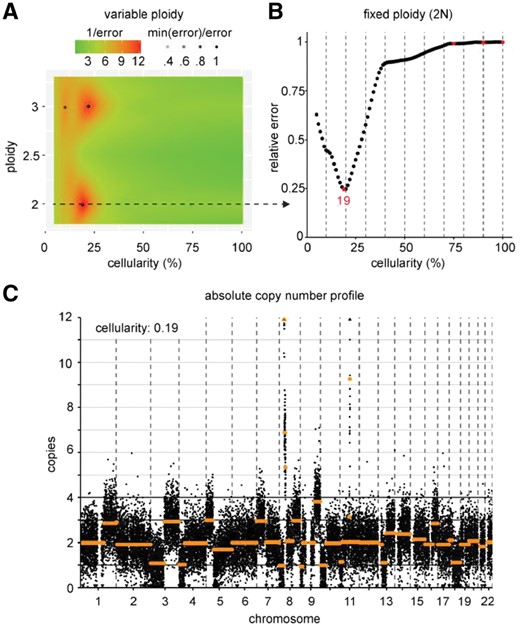
Results of ACE on a permutation sample with 20% of sequencing reads derived from cell line UM-SCC-22A. ACE performs model fitting as a function of both cellularity and ploidy (A) or cellularity at a fixed ploidy (B). In (A), the relative error is color-coded and minima are indicated with a black dot. The cellularity (and ploidy, 2N in this example) corresponding to the top prediction is used to produce an absolute copy number profile with number of copies on the Y-axis and bins ordered by chromosomal location on the X-axis (C)
3 Results
We applied ACE to lcWGS data of DNA from a near-diploid cell line with many CNAs (UM-SCC-22A), a diploid cell line with few and only single copy CNAs (HCT116), a triploid cell line (HT29) and a tetraploid cell line (MOLT-4), using lcWGS data of DNA from exfoliated oral cells of a healthy individual as negative control. To assess ACE performance at all ranges of tumor cell percentages, we generated in silico admixtures of sequencing reads derived from tumor and normal cells, and analyzed these with varying bin sizes, penalty and error methods (Supplementary Material). We also estimated tumor cell percentage of these admixture permutations using ABSOLUTE and ichorCNA (Table 1). The three methods have comparable accuracies between ∼30% and 80% tumor-derived reads (Supplementary Fig. S1). For all three algorithms, we determined the range of tumor DNA percentage at which the algorithm was able to produce an accurate top prediction. Overall, ACE performed very well both at low and high cellularity (Table 1), and showed the largest range of accurate predictions for the triploid and tetraploid cell lines. More details are available in the Supplementary Material.
Prediction accuracy of ACE, ABSOLUTE and ichorCNA on simulated data of three cell lines with varying copy number profiles
| UM-SCC-22A | HCT116 | HT29 | MOLT-4 | |
|---|---|---|---|---|
| (2N) | (2N) | (3N) | (4N) | |
| ACE | 12–100 | 20–100 | 14–100 | 15a–100 |
| ABSOLUTE | 21–100 | 19–100b | 28–100 | 36–100 |
| ichorCNA | 10–100 | 16–81 | 31–91 | 26–100 |
| UM-SCC-22A | HCT116 | HT29 | MOLT-4 | |
|---|---|---|---|---|
| (2N) | (2N) | (3N) | (4N) | |
| ACE | 12–100 | 20–100 | 14–100 | 15a–100 |
| ABSOLUTE | 21–100 | 19–100b | 28–100 | 36–100 |
| ichorCNA | 10–100 | 16–81 | 31–91 | 26–100 |
Notes: Numbers indicate the range of tumor DNA percentages at which the specified algorithm estimates the correct tumor cell percentage (less than 25% deviation) in at least 9 out of 10 permutations.
Only 8 out of 10 at 17% and 20% tumor DNA percentage.
Only 8 out of 10 at 95% tumor DNA percentage.
Increasing the penalty factor for low cellularities improves specificity (no false positive estimates) and accuracy of models, but at the cost of decreased sensitivity. To determine the lowest penalty at which ACE is still highly specific, we analyzed all permutation samples without any tumor DNA for false positive fits. A penalty of 0.1 proved sufficient to prevent false positive fits in all healthy control permutations with 10 million sequencing reads (Supplementary Fig. S2) and is thus the optimal penalty for high sensitivity in this dataset, whereas a penalty between 0.25 and 0.5 is better-suited for optimizing accuracy of predictions (Supplementary Fig. S3).
Finally, we analyzed a recently published dataset of 253 ovarian carcinoma samples (Macintyre et al., 2018). Importantly, the samples varied in tumor purity and were selected for their clonal TP53 mutations, of which the frequency was accurately determined. This allowed the authors to estimate tumor purity accurately based on both clonal mutation data and copy number data. We used their tumor purity determination as gold standard and compared it with the estimates corresponding to the best fits of ACE and ABSOLUTE based solely on copy number data (see Supplementary Material for details). The estimates of ACE are in good concordance with the gold standard over the entire range of tumor purity (Fig. 2). The median difference between the gold standard and ACE was 0.07, compared to 0.28 for ABSOLUTE. In relative terms, estimates of ACE deviated from the gold standard by a median factor of 1.15 compared to a median factor of 1.94 for ABSOLUTE. Because of ABSOLUTE’s high deviation from the gold standard when considering only its highest ranked model, we also tested at which fit ACE and ABSOLUTE approximate the gold standard model. Generally, ACE arrives at the correct model with fewer fits than ABSOLUTE, illustrating its efficacy in model prioritization (Supplementary Fig. S5).
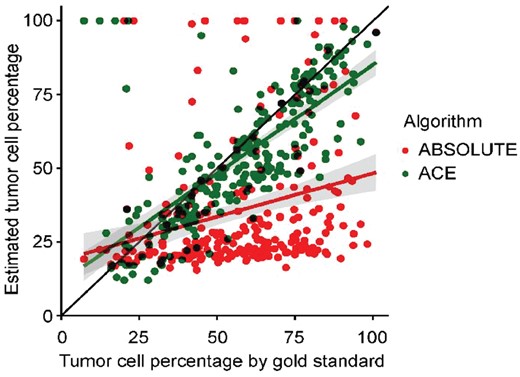
Tumor purity estimates of an ovarian carcinoma dataset. Segmented copy number data from lcWGS was used to derive tumor purity estimates using ABSOLUTE (red) and ACE (green). The results of the algorithms (on the Y-axis) are plotted against a manually curated tumor purity estimate based on both copy number data and high-depth mutation data (X-axis, gold standard)
4 Discussion
ACE is a comprehensive tool to produce absolute copy number profiles and arrive at estimates of tumor purity and ploidy based on lcWGS data only. ACE’s model fitting accuracy performs better than currently available algorithms ABSOLUTE and ichorCNA largely irrespective of tumor purity and ploidy, on both simulated data and an ovarian carcinoma dataset. On the one hand, ACE facilitates analysis of multiple samples directly from mapped reads; on the other hand, it accommodates extensive evaluation of single samples. ACE is therefore a well-suited bioinformatics tool to maximize interpretable outcome of lcWGS experiments.
Acknowledgements
The authors thank Tom Carey, University of Michigan, for cell line UM-SCC-22A. They also thank Geoff Macintyre and James Brenton, Cancer Research UK Cambridge Institute, for assistance and discussion on analysis of the ovarian carcinoma dataset.
Funding
This work was supported by a Cancer Center Amsterdam institutional grant.
Conflict of Interest: none declared.
References

