


Abstract
Complexity is a fundamental attribute of life. Complex systems are made of parts that together perform functions that a single component, or subsets of components, cannot. Examples of complex molecular systems include protein structures such as the -ATPase, the ribosome, or the flagellar motor: each one of these structures requires most or all of its components to function properly. Given the ubiquity of complex systems in the biosphere, understanding the evolution of complexity is central to biology. At the molecular level, operons are classic examples of a complex system. An operon’s genes are co-transcribed under the control of a single promoter to a polycistronic mRNA molecule, and the operon’s gene products often form molecular complexes or metabolic pathways. With the large number of complete bacterial genomes available, we now have the opportunity to explore the evolution of these complex entities, by identifying possible intermediate states of operons.
In this work, we developed a maximum parsimony algorithm to reconstruct ancestral operon states, and show a simple vertical evolution model of how operons may evolve from the individual component genes. We describe several ancestral states that are plausible functional intermediate forms leading to the full operon. We also offer Reconstruction of Ancestral Gene blocks Using Events or ROAGUE as a software tool for those interested in exploring gene block and operon evolution.
The software accompanying this paper is available under GPLv3 license on: https://github.com/nguyenngochuy91/Ancestral-Blocks-Reconstruction.
Supplementary data are available at Bioinformatics online.
1 Introduction
The evolution of complex systems is an open problem in biology (Bonner, 1988; Pál and Papp, 2017; Wagner and Altenberg, 1996), and has also been studied intensively in genomes (Adami et al., 2000; Koonin and Dolja, 2006; Lynch and Conery, 2003). To better understand how complex systems evolve, we focus on the problem of the evolution of orthologous gene blocks and operons in bacteria. Orthologous gene blocks or orthoblocks are sequences of genes co-located on the chromosomes of several species, whose evolutionary conservation is apparent. Operons can be viewed as a special case of gene blocks where the genes are co-transcribed to polycistronic mRNA and are often associated with a coherent function, such as a metabolic pathway or a protein complex. Several models have been proposed to explain gene block and operon evolution. It may very well be that the models are not mutually exclusive, and different operons may evolve by different models, or indeed a single operon may be the result of the combination of several models (Alm et al., 2006; Bush et al., 2018; Fani et al., 2005; Goldberg et al., 2016; Horowitz, 1945; Hsiao et al., 2005; Koonin, 2009; Lawrence and Roth, 1996; Omelchenko et al., 2003; Price et al., 2006; Stahl and Murray, 1966).
Previously, we proposed a method that explains the evolution of orthoblocks and operons as a combination of events that take place in vertical evolution from common ancestors. In the evolution of an orthoblock, the different gene blocks may gain or lose genes, have genes duplicated, or have them split off (Fig. 1 and Table 1). By determining the frequency of the events for any orthoblock in a studied clade, we can determine a cost for each event, and thus create a cost function to determine an optimal vertical path for the evolution of orthoblocks. We used the cost function to determine the conservation of some operons and orthoblocks in proteobacteria, and we have shown a relationship between the functions that operons perform, and their level of conservation across species. For example, orthoblocks that code for genes that perform cellular information processing (such as mRNA translation) are more conserved than those that are associated with adaptation to specific environments (Ream et al., 2015).
![Orthoblocks from species A–E are arranged in a species phylogenetic tree. Species C has an experimentally determined operon (Black arrows), and serves as the reference taxon. The orthologs in species A, B, D and E were determined as explained in the text. The events between C and all other species for this orthoblock are: A–C: deletion (of gene c); B–C: split (of gene c), C–D: duplication (of b) and split (jagged line); C–E: duplication (of b). The full list of the pairwise events between all species is in Table 1. The tree’s inner nodes show proposed intermediate states in the operon’s evolution. The numbers in the brackets are a 3-tuple showing the cumulative count of events going from the leaf nodes to the tree root: [deletions, duplications, splits]. The way these ancestral states are determined is elaborated below](https://oup.silverchair-cdn.com/oup/backfile/Content_public/Journal/bioinformatics/35/17/10.1093_bioinformatics_btz053/2/m_bioinformatics_35_17_2998_f1.jpeg?Expires=1716356005&Signature=z6Z1c3J6eZR7oDOvRDoHTbIMHxl5~~nhrPjxCNtYpS4yiZb4W-U86~D1373jLt~jgNZYzXYT-bj2vHRblHE5GcU6wC4n789j1N4JHGLY-KdlnnX6rhbmjLKgvkwp2WtGFxR7-JVVnT9uxM291W2UEHpdH9GjlsBqQdsyLOho0uAh-SS1JJEG8G~WkVsaQOzv6pPWjg5r~0jp5HuPjKIN6Rj4dIRLOjkuYxRwUo8HPsCAjbqLiGQ21SGgQ0xhAD2xJKm4vkMrP0~0AFJbj87IfuACgNNlj4Kb~hEo1uczi7i0rbLZr51eqnkt7XHGucm-xoLYwAXREVLfkgCVHGjBeQ__&Key-Pair-Id=APKAIE5G5CRDK6RD3PGA)
Orthoblocks from species A–E are arranged in a species phylogenetic tree. Species C has an experimentally determined operon (Black arrows), and serves as the reference taxon. The orthologs in species A, B, D and E were determined as explained in the text. The events between C and all other species for this orthoblock are: A–C: deletion (of gene c); B–C: split (of gene c), C–D: duplication (of b) and split (jagged line); C–E: duplication (of b). The full list of the pairwise events between all species is in Table 1. The tree’s inner nodes show proposed intermediate states in the operon’s evolution. The numbers in the brackets are a 3-tuple showing the cumulative count of events going from the leaf nodes to the tree root: [deletions, duplications, splits]. The way these ancestral states are determined is elaborated below
All pairwise events for the orthoblocks shown in Figure 1
| A | B | C | D | E | |
|---|---|---|---|---|---|
| A | |||||
| B | Split, deletion | ||||
| C | Deletion | Split | |||
| D | Duplication, deletion, split | Duplication, split, | Duplication, split | ||
| E | Duplication, deletion | Duplication, split | Duplication | Split |
| A | B | C | D | E | |
|---|---|---|---|---|---|
| A | |||||
| B | Split, deletion | ||||
| C | Deletion | Split | |||
| D | Duplication, deletion, split | Duplication, split, | Duplication, split | ||
| E | Duplication, deletion | Duplication, split | Duplication | Split |
In this study we use the orthoblock evolution distance function to reconstruct ancestral gene blocks. Reconstructing plausible ancestral states of extant gene blocks and operons can help us understand how they evolve, identify possible functional intermediate states, and determine which forces might affect their evolution. The rest of this paper is structured as follows: first, we describe our approach, introducing two novel algorithms for ancestral reconstruction of operons. We then use the algorithms to reconstruct the ancestral states of orthoblocks in a clade of Gram-negative bacteria and a clade of Gram-positive bacteria. This reconstruction involves orthoblocks comprising genes orthologous to those found in operons in Escherichia coli and in Bacillus subtilis, respectively. Our reconstructions of ancestral states show that: (i) some operons can rapidly evolve independently in several branches in their respective clades, suggesting that positive selection plays a major role in the evolution of gene blocks in bacteria; (ii) other operons are highly conserved, their evolution predating the last common ancestor of the clades we chose, (iii) some ancestral states can plausibly be described as intermediate functional forms and (iv) some operon conservation is sporadic and cannot be explained solely by vertical transmission suggesting horizontal gene transfer.
2 Systems and methods
2.1 Gene block-based evolutionary events, and event-based distances
A reference taxon is a taxon where operons have been identified by experimental means. Here we use E.coli K-12 MG1655 (NC_000913) and B.subtilis str. 168 (NC_000964) as reference taxa. The reference taxon serves as a standard of truth to determine if the genes on a suspected orthoblock do indeed reside, at least in one species, in an operon or a similar co-regulated gene block. Neighboring genes: two genes are considered neighboring if they are bp apart and on the same strand, variations in threshold between 300 and 700 bp showed little difference in previous studies by us (Ream et al., 2015). A gene block comprises no less than two neighboring open reading frames (ORFs). Orthoblocks, gene blocks that are orthologous, are defined as follows: two organisms have orthoblocks when each organism must have at least two neighboring genes that are homologous to genes in a gene block in the reference taxon’s genome. An event is a change in the gene block between any two species with homologous gene blocks.
We identify three types of pairwise events between orthoblocks in different taxa: splits, deletions and duplications. The event-based distance between any two orthoblocks is the sum of the minimized count of splits, duplications and deletions, which is elaborated upon in Orthoblock Distance Functions, below; see also Figure 1. Orthologous genes, the components of orthoblocks, are not determined using best reciprocal hits. When selecting a single ortholog among all possible homologs in a given genome, we use synteny and sequence similarity to determine which of the genes in an examined genome is the correct ortholog. Reference taxa, neighboring genes, gene blocks, events, choice of orthologs and orthoblocks are elaborated upon in (Ream et al., 2015).
2.2 Choosing species
The species tree for each clade was built using gene marker rpoB as the species marker. For the study of Gram negatives with E.coli as a reference species, we use the group of taxa from (Fani et al., 2005). For the study of Gram positives with B.subtilis as the reference species, we use the Phylogenetic Diversity Analysis program (PDA) (Chernomor et al., 2015; Faith, 1992) to select 33 equidistant species. Note that other species markers can be used, and the choice for those may vary depending on the number of species analyzed and the phylogenetic distances. While in this study we used rpoB, ROAGUE can use the input from any species tree provided.
2.3 Orthoblocks in phylogenetic trees
Here we define the representations of orthoblocks in the leaves and nodes of a given phylogenetic tree. The terminology defined in this section will be used to define the orthoblock distance function. For each orthoblock studied, we use a phylogenetic species tree T comprising a set of extant species related to a reference taxon. Each leaf node v in T contains the orthologs to the genes in an operon in the reference species. For any two genes a and b, if the chromosomal distance is less than 500 bp, the genes will be written as ab. If the distance is greater than 500 bp, they are written with the separator character ‘|.’ thus: . For a species tree T, we define as the set of nodes, edges and leaves of T, respectively. In addition, we denote Tv to be a subtree of T rooted at .
Given a reference operon , we define be the set of genes of . We denote a gene block over is a non-empty multiset of where . We define the set of genes in gene block as Gene() . We also define duplication gene set of a gene block as Dup() . An orthoblock O is a set of blocks that is either empty, or contains at least one gene block of size . Given a gene block and a gene set G over , we define
Given a species tree T and a reference operon , for node , let O be the orthoblock assigned to v, we define:
: the identity function of gene g in O.
: the set that represents whether to include gene g in O. There are only 3 possible cases.
: this means that gene g has to be in O.
: this means that gene g cannot be in O.
: this means that gene g is either in O or not in v.
: the set that represents the duplication status of gene g in O. There are only 3 possible cases.
: this means that gene g has to be duplicated in O.
: this means that gene g cannot be duplicated in O.
: this means that gene g can either be duplicated or not in O.
Gene(O): the set of genes of O. Gene()
Dup(O): the set of gene that is duplicated in some gene blocks of O. Dup()
: The proportion of that contains gene g.
: The proportion of that contains a duplication of gene g.
2.4 Orthoblock distance functions
Here we define the pairwise distance between orthoblocks. The distance function will be used in the maximum parsimony algorithms presented next.
The distances between any two orthoblocks are defined as follows:
- Split distance (ds) is the absolute difference in the number of relevant gene blocks between the two taxa. Example: in Figure 1, the split distance between the gene block in genome D and the gene block in genome E is 1. We define is the set of gene block from O where each gene in each gene block has to appear in at least once. Formally, . The split distance can be formalized as:(1)Example: for the reference gene block with genes (abcdefg), genome A has blocks and genome B has . We then compute the relevant gene blocks and (removing genes c, g). Therefore, .(2)
- Duplication distance (du) is the pairwise count of duplications between two gene blocks. We define as the set of duplicated genes of gene block O, so that these genes also appear in but are not duplicated in . Formally, . Here, our gene blocks are guaranteed to have at most one duplication of each gene for each block. We formalize the duplication distance as:(3)Example: For a reference gene block (abcde), genome A has gene block and genome B has gene block , respectively. The ortholog of gene Ob is duplicated in genome B, creating a duplication distance of 1. However, since gene c does not exist in O, it has no bearing on the duplication distance between the homologous gene blocks O and . We then compute and . Therefore, .(4)
- Deletion distance (dd) is the difference in the number of orthologs that are in the homologous gene blocks of the genome of one organism, or the other, but not in both. In short, it is the symmetric difference between the set of orthologous genes of the two gene blocks . We formalize the deletion distance as:
Example: For a reference gene block (abcde), genome A has gene block and genome B has gene block , respectively. Since there are only genes a, b that appear in both genomes,
3 Implementation
3.1 Problem definition
Let T be a tree, and G be the set of genes in a reference operon. We define Ω as the set of all possible orthoblocks over gene set G. Let be the labeling of (assign orthoblocks from Ω to the leaf nodes of T, this can include empty orthoblocks). We define the function to be an extension of λ on T if it coincides with λ on the leaves of T (assign an orthoblock to each node of T). If , we say that vertex v is labelled with orthoblock O. Given a labelling and an edge , we define the distance between the two labellings of the endpoints u, v as and the total distance function as .
The Maximum Parsimony problem is now defined as follows: given a tree T, an operon gene set G, the orthoblock set Ω and a leaf labeling λ, find a labeling that minimizes
Here we explore two related maximum parsimony heuristic approaches, local and global, to reconstruct ancestral gene blocks. Proof of hardness and a full formal description are available in the Supplementary Materials.
3.2 Local maximum parsimony
We provide a local heuristic approach that guaranteed minimum deletion and duplication distances, but not split distances. Briefly, the local approach focuses on finding the optimal parent ancestral gene block given its children gene blocks. For each internal node u, let u1 and u2 be its two children. The intuition is that we have to include a gene in the parent if both of the children have it. However, greedily propagating an included gene up a tree may cause predicting its ancestral existence into deeper internal node than is warranted. To check this problem, at each tree vertex v, for each gene g, we introduce a correction by checking the fraction of the leaf nodes that contain g. Since gene loss tends to happen more often than gene gain, we use a threshold of 0.5 to indicate whether v contains gene g or not. To that end, we developed a greedy local optimization algorithm: Figure 2 provides an intuitive visualization, and the algorithm is in the Supplementary Material. The Supplementary Material further elaborates upon the hardness of the problem, justifying our use of heuristics.
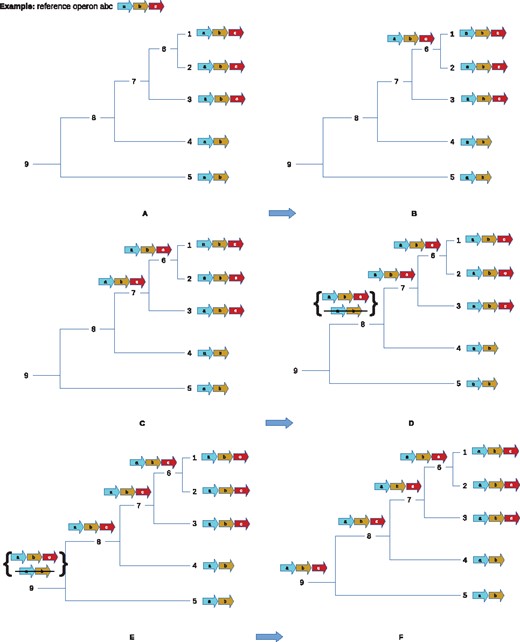
A simplified example of ancestral reconstruction using local maximum parsimony. Three genes are shown: a (cyan), b (brown) and c (red). Consider a tree with structure as in panel A. 1, 2, 3, 4, 5 are the extant species that are assigned with gene blocks abc, abc, abc, ab, ab, respectively, and 6, 7, 8, 9 are the inner nodes. The local algorithm traverses the tree bottom-up. In panels A, B and C, the gene block reconstruction of nodes 6 and 7 is abc (1, 2, 3 all have the gene block abc). In panel D, node 8, there are 2 best candidates for the gene block reconstruction. However, we chose to include gene c since . Hence, node 4 is assigned with gene block abc. In panel E, node 9, there are three best candidates. We chose to assign gene block abc. The reason is that as shown in F (Color version of this figure is available at Bioinformatics online.)
3.3 Global maximum parsimony
Here we try to achieve minimal deletion and duplication distances globally. Intuitively, for each node v and for each gene g in the reference operon, we decide whether gene g could appear in the orthoblock that we will assign to v. To do this, we use dynamic programming. By traversing the phylogenetic tree bottom-up and top-down, we determine the occurrence of each gene in the reference operon for each node v. We also determine whether a gene should be duplicated in the same manner. For split distances, we generate the relevant gene blocks of the two children given the set of genes to be included. See Figure 3 for a simplified example of the global algorithm. The algorithm itself is further elaborated upon in Supplementary Materials.
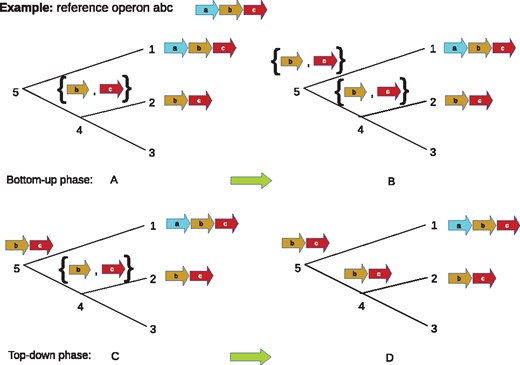
A simplified example of ancestral reconstruction using the global maximum parsimony algorithm. In each panel, 1, 2, 3 are the extant nodes that are assigned with gene blocks abc, bc and Ø, respectively. The global algorithm traverses the tree bottom-up and top-down. In bottom-up phase, the algorithm constructs the set of genes for the inner nodes (4, 5). In panel A, at node 4, the set of genes is {b, c}. Although node 3 does not contain genes b, c, setting gene set at node 4 as {b, c} allows us to compare to other leaf nodes when traverse up the tree. In panel B, at node 5, the set of genes is {b, c} because 1, 4 share genes b, c. In the top-down phase (panels C, D), the gene block is constructed for each inner node. In panel B, the gene block bc is assigned to node 5 using the set of genes of node 5 and the gene block of node 1. We assign gene block bc to node 4 because of its set of genes and gene blocks in node 2
4 Results and discussion
We used experimentally identified operons from E.coli K-12 and B.subtilis str. 168 genomes as gold standards for deriving operons from Gram-negative and Gram-positive bacteria, respectively. The reason we chose these two species is that they both have well-annotated genomes, including experimentally verified and functionally annotated operons.
4.1 Operons using Escherichia coli as a reference taxon
We chose E.coli as the reference species for proteobacteria, a major group of Gram-negative bacteria. Our selection resulted in a set of proteobacteria species comprising three ϵ-proteobacteria, six α-proteobacteria, seven β-proteobacteria and 17 γ-proteobacteria, including E.coli. These taxa include two γ-proteobacteria insect endosymbionts: Buchnera aphidicola and Candidatus Blochmania. These two species have unusually small genomes due to their endosymbiotic nature, and display massive gene loss. We reconstructed ancestors for the following operons from E.coli (described below): atpIBEFHAGD and paaABCDEFGHIJK.
atpIBEFHAGDC. The atpIBEFHAGDC operon codes for -ATPase, which catalyzes the synthesis of ATP from ADP and inorganic phosphate (Kasimoglu et al., 1996). ATP synthase is composed of two fractions: F1 and Fo (Senior, 1990). The F1 fraction contains the catalytic sites and its proteins are coded by five genes (atpA, atpC, atpD, atpG, atphH) (Senior, 1990). The Fo complex constitutes the proton channel and its proteins are coded by three genes atpF, atpE, atpB. atpI is a non-essential regulatory gene. Supplementary Figure S3 shows the high degree of conservation of this operon.
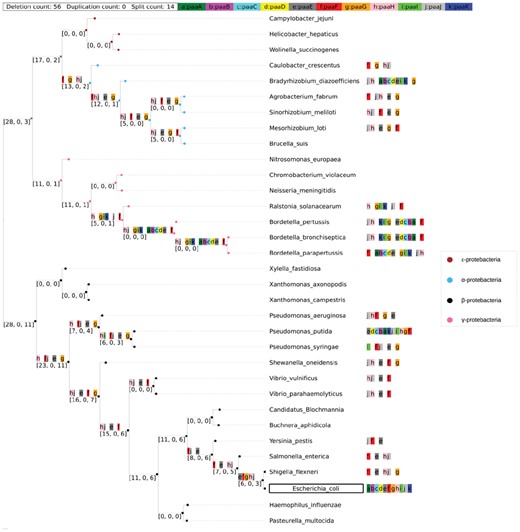
Figure 4 shows ancestral reconstruction using the global maximum parsimony algorithm. Both local (Supplementary Fig. S1) and global reconstructions show a consistency of having orthoblocks atpACDGH and atpBF in the most common ancestors for different Gram negative bacteria. This finding agrees with the long-standing hypothesis that the Fo and the F1 fractions have evolved separately, with the two fractions having homologs in the hexameric DNA helicases and with flagellar motor complexes. Although we find the gene atpI in several species, the reconstruction predicts that atpI is not in the same cluster with other genes. As stated, atpI is probably not an essential component of the ATPase (Gay, 1984). Another interesting finding is the duplication of atpF in ϵ-proteobacteria which appears to predate their common ancestor. Note that all genes exist as a gene block even in the endosymbionts Blochmannia and B. aphidicola.
![Ancestral reconstruction of operon atpIBEFHAGDC using the global optimization approach.The lower-case letters in each tree node represent the genes in the orthoblock (e.g. ‘a’ represents ‘atpA’, see legend in blue bar, top). A ‘|’ designates a split (i.e. a distance ≥500 bp between the genes to either side of the ‘|’). The green bar on top shows the total number of events that took place in this reconstruction. The numbers in the brackets in the inner nodes are a 3-tuple showing the cumulative count of events going from the leafnodes to the tree root in the following order: [deletions, duplications, splits]. No orthologus gene blocks were found in species labeled with an asterisk (*). The reference genome E.coli is marked with a box. These naming and color conventions persist through this study (Color version of this figure is available at Bioinformatics online.)](https://oup.silverchair-cdn.com/oup/backfile/Content_public/Journal/bioinformatics/35/17/10.1093_bioinformatics_btz053/2/m_bioinformatics_35_17_2998_f4.jpeg?Expires=1716356005&Signature=YFHh2ZXTp6LrLAJy~uIXs-0rCCVQ4YmuCRRK9LdQLmX9CuF7JrRv~L04IsN-H13Qh6GoO1bfAkBVCv41oo0Lk1CCuh9jO9A3wKtioCoYwLBGC1Ac8MDfYZ7PYn2GRt931YSYDb7ekvurUsjAOf-hWUrUFtI9yg72csMlJcCW4vpwlhdLyQiN3QMrRo20LEOFsvh3DVYAKsLnYD-LoGrXZqy2wsVO4avsOcLqoEFvxFmgym~DFD4l5ygVQA4xQ6xbge8FutUXpWB51N9x-jauMwXoM6zetYVsOK4tuzMNzKFYfYWJIOI5v2VELov0DZOasZuz6hABLBA2ExdqpaXGRg__&Key-Pair-Id=APKAIE5G5CRDK6RD3PGA)
Ancestral reconstruction of operon atpIBEFHAGDC using the global optimization approach.The lower-case letters in each tree node represent the genes in the orthoblock (e.g. ‘a’ represents ‘atpA’, see legend in blue bar, top). A ‘’ designates a split (i.e. a distance 500 bp between the genes to either side of the ‘’). The green bar on top shows the total number of events that took place in this reconstruction. The numbers in the brackets in the inner nodes are a 3-tuple showing the cumulative count of events going from the leafnodes to the tree root in the following order: [deletions, duplications, splits]. No orthologus gene blocks were found in species labeled with an asterisk (*). The reference genome E.coli is marked with a box. These naming and color conventions persist through this study (Color version of this figure is available at Bioinformatics online.)
The and γ-proteobacteria species all have a conserved intact F1 complex (coded by the atpACDGH cluster), which predates their common ancestor. The genes included in the Fo complex in epsilon-proteobacteria (gene products atpB, atpE, atpF) not in the same cluster as the genes making up F1. Furthermore, it is unclear whether the gene split that is only found in ϵ-proteobacteria is a split that predates the least common ancestor with the other proteobacteria clades, or whether it is a split introduced in the ϵ-proteobacteria. From the reconstructions provided, the scenario appears to be the latter. Conversely, this observation may also be a result of the small number of species studied here. The species in the ϵ and α-proteobacteria display a known duplication of gene atpF. atpF appears as a sister group to atpF (Koumandou and Kossida, 2014).
paaABCDEFGHIJK. The operon paaABCDEFGHIJK codes for genes involved in the catabolism of phenylacetate (Martin and McInerney, 2009). The ability to catabolize phenylacetate varies greatly between proteobacterial species, and even among different E.coli K-12 strains. In contrast with atpABCDEFG operon which is conserved through many species, the operon paaABCDEFGHIJK is only found in full complement as an operon in some E.coli K-12 strains and some Pseudomonas putida strains. While obviously less conserved than the atpABCDEFG operon, certain orthoblocks appear to be conserved, providing possible partial functionality. The orthoblock paaABCDE is found in three Bordetella species and also in Bradyrhizobium diazoefficiens. The products of paaA, paaB, paaC and paaE make up the subunits of the 1,2-phenylacetyl-CoA epoxidase, and paaD is hypothesized to form an iron-sulfur cluster with the product of paaE (Grishin et al., 2011). We did not find orthologs in the endosymbionts B. aphidicola and Blochmannia.
In both the local and global reconstructions (Supplementary Fig. S2 and Fig. 5, respectively), only the ancestor of the Bordetella species have a combination of paaABC complex with paaE. It appears that only this combination has full activity (Grishin et al., 2011). In addition, the global approach only predicts gene blocks for the ancestors of α and most of γ-proteobacteria. Only the common ancestor of the Bordetella genus contains the cluster paaABCE. It has been confirmed that this cluster of genes is identical to those of E.coli (Luengo et al., 2001). In both approaches, gene paaF and paaG are not found to be in the same gene blocks, hence the ancestors are most likely missing the hydratase-isomerase complex. The paaJ thiolase catalyzes two steps in the phenylacetate catabolism (Ismail et al., 2003; Nogales et al., 2007; Teufel et al., 2010). In addition, paaH is the NAD+-dependent 3-hydroxyadipyl-CoA dehydrogenase involved in phenylacetate catabolism (Ismail et al., 2003). Therefore, it makes sense that paaJ and paaH appear in most of the ancestral nodes that have gene blocks.
Ancestral gene block reconstruction of operon paaABCDEFGHIJK using the global reconstruction approach
It is interesting to note that we see the formation of functional intermediate forms both in a highly conserved gene block atpIBEFHAGDC and the less conserved gene block based on the operon paaABCDEFGHIJK. Also, in both cases, the global approach performs better in term of minimizing events. For brevity, we only provide the global ancestral reconstruction henceforth.
4.2 Operons using Bacillus subtilis as a reference taxon
Bacillus subtilis is a Gram-positive, spore forming bacterium commonly found in soil, and is also a normal gut commensal in humans. It is a model organism for Gram-positive spore forming bacteria, and as such its genome of about 4450 genes is well annotated. Here we used ROAGUE to reconstruct the ancestors of two B.subtilis operons across 33 species. We selected species from the order Bacillales using PDA. Species from the following families were selected: Bacillaceae (including the reference organism B.subtilis), Staphylococcae: macrococcus and staphylococcus, Alicyclobacilla ceae, Listeriaceae and Planococcaceae.
lepA-hemN-hrcA-grpE-dnaK-dnaJ-prmA-yqeU-rimO. Gene block lepA-hemN-hrcA-grpE-dnaK-dnaJ-prmA-yqeU-rimO facilitates the heat shock response in B.subtilis and the gene block hrcA-grpE-dnaK-dnaJ was the first identified heat shock operon within Bacillus spp (Wetzstein et al., 1992). The four genes hrcA, grpE, dnaK, dnaJ (e, c, b, a in Fig. 6) form a tetracistronic structure, which is essential to the heat shock response role (Homuth et al., 1997). The four genes are proximal (they never separated in the course of evolution) in all the species examined, and form the core of the orthoblock. Overall, this operon is quite conserved, and the ancestral reconstructions are highly similar to the reference operon.
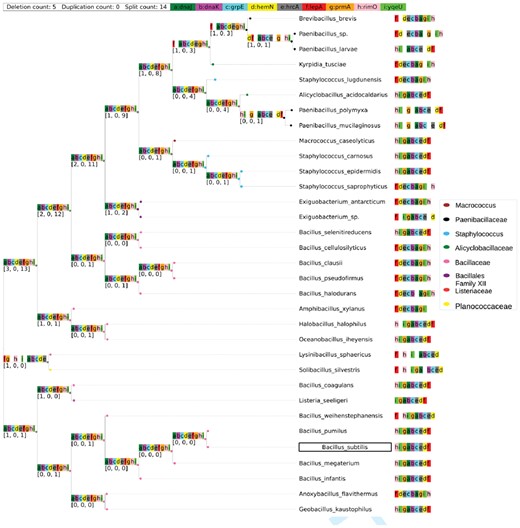
Ancestral reconstruction of lepA-hemN-hrcA-grpE-dnaK-dnaJ-prmA-yqeU-rimO
mmgABCDE-prpB. The operon mmgABCDE-prpB is expressed during endosporulation (Acharya, 2009). Subunit mmgABC’s breakdown of fatty acids is a mean for attaining energy to drive the cell’s preparation for dormancy (Quattlebaum, 2009). Hence, it is reasonable to see that the common ancestor has this subunit. In addition, gene mmgD and gene prpB/yqiQ are predicted to be proximal. Several studies predicted that gene mmgD, prpB and prpD encode the proteins of the putative methylcitrate shunt (Voigt et al., 2007). However, they did not specify if deletion mutations might contribute to a defect of the functionality. See Figure 7.
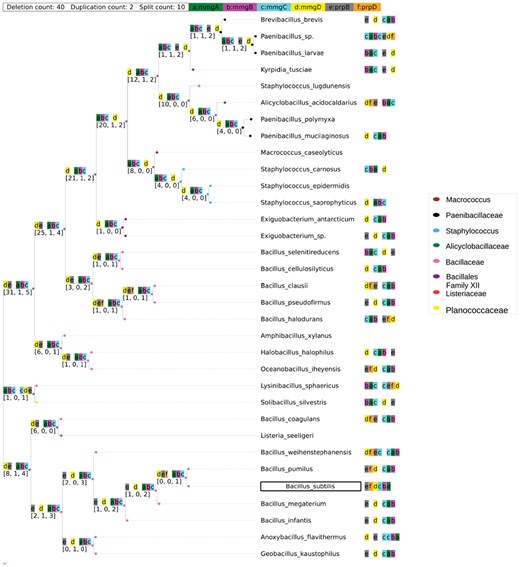
Ancestral reconstruction of mmgABCDE-prpB
5 Conclusions
Operons offer a tractable model for the evolution of complexity. Understanding how simple units of genes may converge into an operon can lead us to a better understanding of how a complex molecular systems evolve. Here we developed a method for to reconstruct ancestral gene blocks using maximum parsimony. Using this method we provide several examples of ancestral gene block reconstructions based on reference operons in E.coli and B.subtilis. Some interesting observations emerge regarding conservation and ancestry of operons. From our examples it appears that essentiality (the trait of being essential to life) and the formation of a protein complex are two drivers for gene block conservation. This is most apparent in the atpABCDEFG operon coding for -atpase in proteobacteria. There are few evolutionary events identified in the atpABCDEFG operon ancestry. In the Supplementary Materials, we provide a brief study of two more gene blocks. We observed that the ribose transporter block also seems to preserve the core ribose transporter (rbsABC), while not the ribose phosphorylation genes rbsD and rbsK. ROAGUE also highlights intermediate functional forms of the orthoblocks, as we see in the pattern of conservation in paaABCDEFGHIJK.
It did not escape our notice that our model does not account for horizontal gene transfer, which has been shown to be a driver of operon dispersal in some cases species (Koonin, 2009; Omelchenko et al., 2003). However, our model does set the stage for a new method for doing so. Typically, detecting horizontal gene transfer is done by looking for conservation of genes and gene structures between distant OTUs, and for anomalous codon usage (Koonin et al., 2001). Our method opens up a new way of HGT detection, by reconciling a species tree with an operon tree, in the same way that phylogenomic analyses do for gene trees and species trees (Eisen, 1998), which would be an interesting future development of this study. In addition, we ignore the gene order in the gene block. While the relationship between gene organization and expression in operons is not well understood, it is clear from several studies that gene order has an effect in some cases on the expression and functionality of the operon in general (e.g. Hiroe et al., 2012; Lim et al., 2011; Wells et al., 2016). Adding the parameters of horizontal gene transfer, gene order preservation, or both to ROAGUE would be highly valuable. We invite the community to contribute to ROAGUE, as well as use the tool for identifying orthologous gene blocks, and reconstructing their ancestry.
Funding
This work was funded, in part, by National Science Foundation grants ABI-1551363 and ABI-1458359 awarded to IF, and National Science Foundation grant ECC-1617626 awarded to OE.
Conflict of Interest: none declared.
References

