


Abstract
The visualization and interpretation of evolutionary spatiotemporal scenarios is broadly and increasingly used in infectious disease research, ecology or agronomy. Using probabilistic frameworks, well-known tools can infer from molecular data ancestral traits for internal nodes in a phylogeny, and numerous phylogenetic rendering tools can display such evolutionary trees. However, visualizing such ancestral information and its uncertainty on the tree remains tedious. For instance, ancestral nodes can be associated to several geographical annotations with close probabilities and thus, several migration or transmission scenarios exist.
We expose a web-based tool, named AQUAPONY, that facilitates such operations. Given an evolutionary tree with ancestral (e.g. geographical) annotations, the user can easily control the display of ancestral information on the entire tree or a subtree, and can view alternative phylogeographic scenarios along a branch according to a chosen uncertainty threshold. AQUAPONY interactively visualizes the tree and eases the objective interpretation of evolutionary scenarios. AQUAPONY’s implementation makes it highly responsive to user interaction, and instantaneously updates the tree visualizations even for large trees (which can be exported as image files).
AQUAPONY is coded in JavaScript/HTML, available under Cecill license, and can be freely used at http://www.atgc-montpellier.fr/aquapony/.
1 Introduction
Phylogeography seeks to infer jointly the spatial and temporal dynamics of species evolution. From genomic data and the current geographical location of extant species, software like BEAST (Drummond et al., 2005) can infer the relationships between these species, in the form of a phylogenetic tree, and probable locations of ancestral species. Other discrete or continuous phenotypic traits are also amenable to ancestral inference using probabilistic methods, e.g. MrBayes (Ronquist and Huelsenbeck, 2003), Lamarc (Kuhner, 2006), etc. For a discrete trait, one gets for each internal node the probability of each possible state. The evolution of a discrete trait along time, along a branch of the tree, makes up a scenario. Considering the geographical location as example trait, its evolution indicates a migration scenario (e.g. for plants or animals) or a dissemination scenario (e.g. for viruses and other parasites).
The visualization and interpretation of spatiotemporal scenarios is widely used in infectious disease research, in ecology, for biodiversity conservation policy or in agronomy. Despite numerous methods for inferring ancestral traits in phylogenies, development of interfaces that help the interpretation of trait-annotated phylogenies is still needed (Bielejec et al., 2011; Chevenet et al., 2006, 2010), since some tasks remain difficult. Notably, the interpretation of evolutionary scenarios must account for the uncertainty of possible alternative scenarios. Often, only the optimal scenario is considered and displayed, even if sub-optimal scenarios may have a probability that is very close to that of the optimal scenario. It is thus risky to base the interpretation solely on the most probable location. Currently, this information on the uncertainty of ancestral traits is difficult to manipulate and to display with most currently available graphical user interfaces, especially on large phylogenetic trees. Comparing alternative scenarios with several probable locations at several ancestral nodes is even more complicated.
Here, we present a tool, named AQUAPONY (Annotations QUick Analysis for PhylOgeNY—here AP for short), which eases such manipulations, visualizations and the interpretation of evolutionary scenarios. It permits an easy selection and display of uncertain trait information at ancestral nodes in the phylogeny, and allows comparing alternative scenarios of distinct probabilities on ancestral traits, leading to the current state of a leaf or group of leaves. AP provides a dynamic and efficient interface implemented as a lightweight web-browser (and thus platform-independent) application, accompanied by an extensive user’s manual.
2 Software description and main features
AP takes as input an evolutionary tree, whose nodes are annotated with some inferred traits. It typically accepts BEAST output and the like. For simplicity, let us consider geographical locations as the trait of interest: each node has a posterior probability for each location. The Newick input file is first parsed to extract annotations and display the tree. An AP screenshot is shown Figure 1. The user can select, update and visualize annotation of interest through the List of Annotations in the Annotation & colors panel. Given chosen options, AP will display the tree (Main tree panel) and some subtree chosen by the user (Subtree panel). When the user selects any node or leaf, and asks for its scenarios, the Scenarios panel opens up to display two alternatives. Any figure can then be saved as an external graphics for later use.
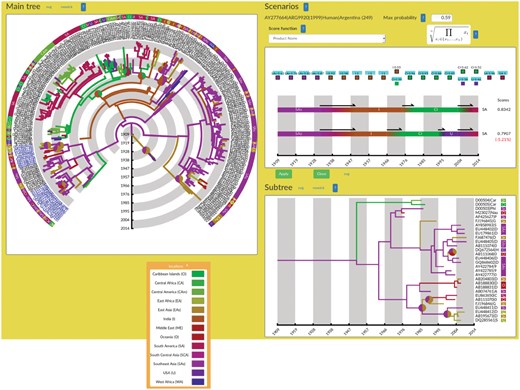
AQUAPONY’s interface showing the Main tree, Subtree and Scenarios panels (as an insert the legend and color codes of geographical locations). Tree from Walimbe et al. (2014). In both trees, the uncertainty of ancestral geographical locations is displayed with pie charts. The Scenarios panel shows the two most probable transmission scenarios of dengue virus from the root of the tree until the chosen leaf. The scores at the right of each scenario indicate that both alternatives are almost equally likely. The user can select among different formulas for scoring of scenarios
The List of Annotations displays the traits obtained by parsing the input as colored items. The user selects some traits for visualization on the tree by drag-and-dropping them to a field of the Annotation panel, but can also create group of annotations, and update the annotations in the Newick file (which can be saved in a new file). Importantly, the interface allows pointing each node on the tree visualization to get its unique ID and vice versa (ID button).
The Annotations panel contains fields to control display (Branch, Pie chart, Min-Max disk, Leaf color group). Dropping a trait in the Branch field will trigger its visualization in the Main tree and Subtree figures. Similarly, dropping it instead in the Leaf color group field, colors the groups of leaves with identical trait in the color of its state.
The two figure panels offers a dynamically linked, whole tree and subtree visualizations: any change is made on both trees. For example, putting the branch support (bootstrap or posterior probability) trait on Min-Max disk triggers the plot of a colored disk on each node whose support is either high enough or too low (according to two user-defined thresholds). Similarly, putting the location probabilities on the Pie chart field plots a pie chart at each node having several states with close probabilities. This enables spotting which nodes have several plausible alternative locations, and thus alternative scenarios. It materializes the uncertainty of ancestral annotations on the figures.
Finally the Scenarios panel displays two alternative phylogeographic scenarios upon selection of a leaf or group of leaves in the tree. The scenarios are shown as multi-color horizontal bars with the associated time scale. Above, the list of all ancestral nodes along the path are shown (left to right) with all possible trait states (on top of each other) and their probability provided the latter are above a user-defined threshold. The user interactively selects the trait states for the alternative, suboptimal scenario, which are immediately reflected in the figure below. Comparing the trait states for a node is easy since probabilities are shown. For comparing entire scenarios, we compute a score that combines the probabilities of their trait states, and the scores of both scenarios are displayed right of them (with their relative difference). For instance in Figure 1, direct dissemination of the virus from Caribean Islands to South America—as suggested by Walimbe et al. (2014)—is a better scenario than a passage through USA. Beyond visualization, the score is an objective measure to compare and prioritize alternative scenarios, which can be almost equiprobable. This novel feature helps deciding among alternatives and discarding scenarios that do not comply with e.g. other independent evolutionary information or geographical constraints.
2.1 Materials and methods
The phylogenetic tree shown in Figure 1 has 269 leaves and represents a global phylogeography of Dengue type 1 virus as described in Walimbe et al. (2014). The ancestral geographic locations of internal nodes were inferred using the BEAST 1.6.2 program (Drummond et al., 2005).
2.2 Implementation and availability
AP can be interactively used on the ATGC bioinformatics platform (atgc-montpellier.fr/aquapony) with a web browser (use preferably Firefox; note that Safari and InternetExplorer do not enable all features of AP), meaning that no installation is needed. Its code source is freely available under a Cecill Licence at https://gite.lirmm.fr/aquapony/aquapony-releases.
Its implementation in JavaScript language makes it highly responsive to user interaction and enables the instantaneous update of the tree visualizations. AP is fast enough for displaying very large trees (up to several thousands of leaves). The computation remains on the client side and must never wait for an eventually busy webserver. Thus, AP can be easily incorporated and reused in other web-based applications without any sophisticated installation. All figures can be saved in a flexible, vectorial image format (SVG), which allows zooming without sacrificing the image quality—many tools can transform SVG into other usual image formats, like jpg or png. The original tree annotations can be modified, grouped, selected and the user can update the input tree and save it into a Newick formatted file for later reuse. Last, AP comes with a comprehensive manual.
3 Conclusion
AQUAPONY is a focused, web-based application for interactive visualization of evolutionary trees and ancestral annotations, as well as for visual investigation of evolutionary scenarios for a trait of interest. AQUAPONY is not an all-purpose tool for phylogeny visualization, for which numerous tools are already available. Its strength is to ease some precise manipulations that remain tedious with other tools. Especially, highlighting of uncertainty and comparison of alternative phylo- or bio-geographical scenarios along a branch in the studied tree becomes effortless in AQUAPONY. Its open source code allows for extensions and for new features. Including other types of tree formats like phyloXML would broaden the range of possible inputs and facilitate downstream analysis of other phylogenetic inference software. The simultaneous visualization of more than two alternative scenarios is a possible addition. Clearly, extension to visualization of evolutionary networks, instead of trees, may be of broad interest.
Acknowledgements
We are grateful to E. Jousselin and F. Chevenet for insightful comments.
Funding
This work was supported by the Institut de Biologie Computationnelle ANR (ANR-11-BINF-0002).
Conflict of Interest: none declared.
References

