


Abstract
Protein structure refinement aims to bring moderately accurate template-based protein models closer to the native state through conformational sampling. However, guiding the sampling towards the native state by effectively using restraints remains a major issue in structure refinement.
Here, we develop a machine learning based restrained relaxation protocol that uses deep discriminative learning based binary classifiers to predict multi-resolution probabilistic restraints from the starting structure and subsequently converts these restraints to be integrated into Rosetta all-atom energy function as additional scoring terms during structure refinement. We use four restraint resolutions as adopted in GDT-HA (0.5, 1, 2 and 4 Å), centered on the Cα atom of each residue that are predicted by ensemble of four deep discriminative classifiers trained using combinations of sequence and structure-derived features as well as several energy terms from Rosetta centroid scoring function. The proposed method, refineD, has been found to produce consistent and substantial structural refinement through the use of cumulative and non-cumulative restraints on 150 benchmarking targets. refineD outperforms unrestrained relaxation strategy or relaxation that is restrained to starting structures using the FastRelax application of Rosetta or atomic-level energy minimization based ModRefiner method as well as molecular dynamics (MD) simulation based FG-MD protocol. Furthermore, by adjusting restraint resolutions, the method addresses the tradeoff that exists between degree and consistency of refinement. These results demonstrate a promising new avenue for improving accuracy of template-based protein models by effectively guiding conformational sampling during structure refinement through the use of machine learning based restraints.
Supplementary data are available at Bioinformatics online.
1 Introduction
Computational protein structure prediction is an integral part of structural bioinformatics (Cavasotto and Phatak, 2009). The accuracy of protein models predicted by the state-of-the-art structure prediction approaches (Kim et al., 2004; Rohl et al., 2004; Zhang, 2008) can be quite impressive, particularly for the template-based modeling cases (Kryshtafovych et al., 2018; Moult et al., 2018). However, they still often fail to reach accuracy high enough to be comparable to the experimentally determined native conformations (Feig, 2017). The goal of computational protein structure refinement is to drive a starting structure towards its native state such that it attains near-experimental accuracy. Consequently, protein structure refinement approaches use conformational sampling to optimize an atomistic force field to bring the starting structure closer to its native state.
The most successful refinement methods employ Molecular dynamics (MD) simulation (Feig and Mirjalili, 2016; Mirjalili et al., 2014), Monte Carlo (MC) sampling (Bhattacharya and Cheng, 2013a, b, c; Park et al., 2016; Park and Seok, 2012), energy minimization with a physics and/or knowledge based force fields (Bhattacharya and Cheng, 2013a, b, c; Bhattacharya et al., 2016; Lee et al., 2016; Lin et al., 2011; Rodrigues et al., 2012). Promising progress in structure refinement has been witnessed in the recent past due to force field improvement by combining physics and knowledge based scoring terms, enhanced sampling for longer time scales and the use of ensemble averaging (Hovan et al., 2018; Modi and Dunbrack, 2016; Nugent et al., 2014). Nevertheless, addressing the tradeoff between degree and consistency of refinement is a major challenge for state-of-the-art refinement protocols. On one hand, aggressive and unrestrained sampling around the starting structure that has the ability to produce large degree of refinement often deviates away from the native state rather than towards it (Park et al., 2012; Summa and Levitt, 2007). On the other hand, applying restraints derived directly from the starting structure during refinement in order to prevent large conformational change (Chen and Brooks, 2007; Lee et al., 2016; Raval et al., 2012) opposes significant structural modifications that may be needed, particularly when the starting structure is far away from the native state. Some refinement approaches apply partial restraints on structurally conserved regions (Cao et al., 2003; Ishitani et al., 2008), or derive restraints using ensemble of homologues structure or fragments (Della Corte et al., 2016; Wildberg et al., 2015; Zhang et al., 2011). However, effectively using restraints to achieve consistent yet significant refinement remains a conundrum in protein structure refinement (Feig, 2017; Heo and Feig, 2018).
Here, we present refineD, which uses deep discriminative learning based ensemble classifiers to predict multi-resolution probabilistic restraints from the starting structure and subsequently converts these restraints into scoring terms to guide conformational sampling during structure refinement. Specifically, we use Deep Convolutional Neural Fields (DeepCNF) (Wang et al., 2016a,b), a deep discriminative learning classifier, to predict the likelihood of Cα atom of any residue of the starting structure to be within r Å with respect to the native. Following the high accuracy version of the Global Distance Test (GDT-HA) score (Zemla, 2003), which captures the number of residues in a predicted protein model with the Cα atom distances from the corresponding residues in the native structure below four different distance thresholds (0.5, 1, 2, 4 Å) and extensively used to evaluate the performance of refinement methods, we use an ensemble of four DeepCNF classifiers after fixing r to each of the four distance thresholds. Each DeepCNF classifier combines several centroid scoring functions of Rosetta (Leaver-Fay et al., 2011; Rohl et al., 2004), sequence profile based residue conservation features and consistency between structural features extracted from the starting structure and predicted values from its sequence. Output from the ensemble of four DeepCNF classifiers are subsequently converted to multi-resolution probabilistic restraints and integrated as additional scoring term into Rosetta’s all-atom energy function (Alford et al., 2017) to perform restrained relaxation using the FastRelax application of Rosetta (Khatib et al., 2011; Tyka et al., 2011). To the best of our knowledge, this is the first study that applies machine learning derived multi-resolution probabilistic restraints in protein structure refinement.
2 Materials and methods
2.1 Training deep discriminative ensemble classifiers
2.1.1 Training dataset
We use 3DRobot (Deng et al., 2016) decoy set to curate dataset for training DeepCNF ensemble classifiers. 3DRobot generates well-packed decoy pool with an even distribution of decoy accuracy over the Root Mean Square Deviation (RMSD) space with respect to native. The original 3DRobot decoy set contains 200 non-homologous protein targets each with 300 decoys that are evenly distributed in the RMSD space from 0 to 12 Å. We compute GDT-HA score for each decoy in the 3DRobot dataset and group them into ten distinct GDT-HA bins with a bin-width of 10 GDT-HA units. For each target, we select at most one decoy from each bin by random sampling. This results in 1767 decoys for 200 targets. It should be noted that for few targets, not all ten GDT-HA bins are populated and this results in fewer than ten decoys being selected for that target.
2.1.2 Feature generation
We use a total of fifteen features to describe each residue of a decoy as briefly described below.
Sequence profile conservation score: We generate sequence profile by searching the NCBI non-redundant sequence database (NR) using three iterations of PSI-BLAST v2.2.26 software (Altschul et al., 1997) with an E-value inclusion threshold of 10−3. We subsequently extract the information per position scores from the PSI-BLAST matrix and scale it between 0 and 1 using sigmoidal transformation. We use this scaled score as sequence profile conservation feature.
Consistency between predicted and observed structural properties: We use SPIDER2 (Heffernan et al., 2015), an iterative deep learning framework, to predict secondary structure and absolute solvent accessibility from a given protein sequence. Observed secondary structure of a decoy is calculated using the DSSP (Kabsch and Sander, 1983) method implemented in PyRosetta (Chaudhury et al., 2010). Per residue relative solvent accessible surface area of each residue is obtained using PyRosetta. We use a binary agreement between predicted and observed secondary structure as a feature. For solvent accessibility, we convert predicted absolute solvent accessibility into their corresponding relative values (rsap) and compute squared error with respect to observed values (rsao) as (rsap − rsao)2 to be used as a feature.
Rosetta centroid energy terms: We use twelve Rosetta centroid energy terms (Leaver-Fay et al., 2011; Rohl et al., 2004) including residue environment (env), residue pair interactions (pair), Cβ density (cbeta), steric repulsion (vdw), radius of gyration (rg), packing (cenpack), contact order (co), statistical potentials for secondary structure formation (hs_pair, ss_pair, sheet, rsigma) and centroid hydrogen-bonding (cen_hb). Once again, we apply sigmoidal function to all terms to scale energy terms before incorporating them as features.
2.1.3 Label generation
We set the class label as 1 (a.k.a. positive class) if the Cα atom of a residue is within r Å with respect to the native structure after optimal structural superposition and 0 (a.k.a. negative class) otherwise. Four different class labels are generated after fixing r at 0.5, 1, 2, 4 Å respectively. It should be noted here that class labels at lower distance thresholds always agree with that of their higher distance counterparts, but the converse may not be true. Moreover, depending on the accuracy of the decoy and the choice of the distance thresholds, one class may vastly outnumber the other; resulting in a class imbalance problem. In the training dataset, ratios between positive and negative classes are 0.21 (40 849/194 621), 0.51 (78 755/156 715), 1.05 (120 334/115 136) and 2.31 (164 421/71 049) at distance thresholds 0.5, 1, 2 and 4 Å respectively. Class imbalance problem is, therefore, particularly noticeable for the lowest and highest distance thresholds.
2.1.4 Architecture and parameters of deep discriminative classifiers
The architecture of deep discriminative classifier, DeepCNF (Wang et al., 2016a,b) that is particularly suited for learning from imbalanced datasets, consists of two modules: (i) the Conditional Random Fields (CRF) module covering the top layer and the class label layer, and (ii) the deep convolutional neural network (DCNN) module covering the input to the top layer. DeepCNF strives to address class imbalance problem in the training data by maximizing the empirical Area Under the ROC Curve (AUC), which is an unbiased measurement for imbalanced data. Based on preliminary testing, we use 5 hidden layers each having 50 neurons with a window size of 21 and a sigmoid activation function for all four DeepCNF classifiers. All four classifiers use the same feature set but different class labels corresponding to distance cutoffs 0.5, 1, 2, 4 Å. Based on preliminary testing, we set the regularizer to 0.5, number of iterations to 1000, AUC degree to 3 and uniform weights defaulted to 1.0 for each labels. A thorough parameter optimization may help further improve the performance.
2.2 refineD protocol
The flowchart of refineD protocol is shown in Figure 1, which consists of feature generation from the starting structure, residue level ensemble classification using the trained DeepCNF classifiers, multi-resolution probabilistic restraints generation, structure refinement via restrained relaxation, and scoring refined structures.
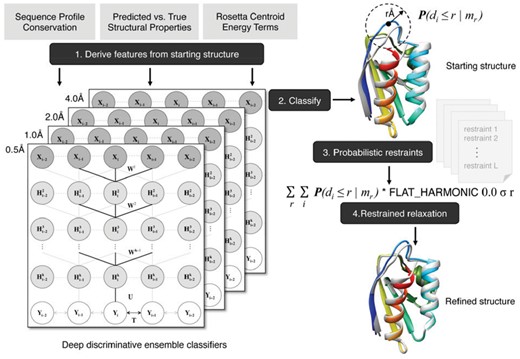
Flowchart of the refineD protocol. The protocol includes feature generation from the starting structure, residue level ensemble classification, multi-resolution probabilistic restraints generation, structure refinement via restrained relax, and scoring refined structures using ensemble classifiers
2.2.1 Feature generation from the starting structure
Given a starting structure for refinement, we extract the previously mentioned set of fifteen features that includes: (i) one feature representing sequence profile conservation score; (ii) two features quantifying the consistency between predicted and observed structural properties (secondary structure and solvent accessibility); and (iii) twelve Rosetta centroid energy terms.
2.2.2 Residue level ensemble classifications
Based on the features derived from the starting structure and using one of the four DeepCNF classifiers trained on class labels generated using a specific distance threshold r Å, we can classify residue i in the starting structure to be within r Å compared to the native structure, where r ∈ {0.5, 1, 2, 4} Å. Collectively, the four trained DeepCNF classifiers result in residue level ensemble classification.
2.2.3 Generating multi-resolution probabilistic restraints
We fix x0 at zero and set the tol parameter to each of the four distance thresholds r ∈ {0.5, 1, 2, 4} Å to allow unrestricted sampling guided purely by the REF15 scoring function in a spherical conformational space of radius r Å centered at each Cα atom of the starting structure. Outside this region, conformational sampling is harmonically restricted using a width parameter sd of 0.1. Consequently, this corresponds to probabilistically restraining the conformational space at four different resolutions.
2.2.4 Structure refinement via restrained relaxation
We use the FastRelax application of Rosetta (Khatib et al., 2011; Tyka et al., 2011) accessed from PyRosetta (Chaudhury et al., 2010) after setting the score function weights to ref2015_cst.wts, which adds restraints based terms with the standard REF15 score function. The FastRelax protocol employs multiple rounds of repulsive weight annealing together with combinatorial rotamer optimization and minimization (ramp‐repack‐min). There are five cycles each consisting of four rounds of ramp‐repack‐min, where the strength of the repulsive energy term is progressively increased starting from 2% of full strength, followed by 25, 55 and 100%.
2.2.5 Scoring refined structures using ensemble classifiers
3 Results and discussions
3.1 Benchmark dataset
We collect a dataset comprising of 181 non-redundant single-domain proteins, originally curated to benchmark the FG-MD refinement protocol (Zhang et al., 2011) spanning across multiple folds. We remove protein targets having significant sequence similarity with the training set. After removal of 31 such targets from the original FG-MD set, our benchmark dataset consists of 150 targets, with average sequence identity of 18.5% (maximum 25.2%) between the test and training set and length varying from 64 to 222 residues. For each protein target, the starting structure for refinement is generated by I-TASSER (Roy et al., 2010; Zhang, 2007) using a multiple template based protein structure prediction approach. As shown in Figure 2A, 28% (42/150) targets have GDT-HA score of the starting structures below 40, 42.67% (64/150) targets with starting GDT-HA scores between 40 and 60, and 29.33% (44/150) targets have starting GDT-HA scores above 60. Additionally, Figure 2B shows that 24% (36/150) targets have length less than 100 residues, 43.33% (65/150) targets with length between 100 and 150 residues, and 32.67% (49/150) targets have length greater than 150 residues. The dataset, therefore, is diversely distributed in terms of accuracy of the starting structures as well as sequence lengths.
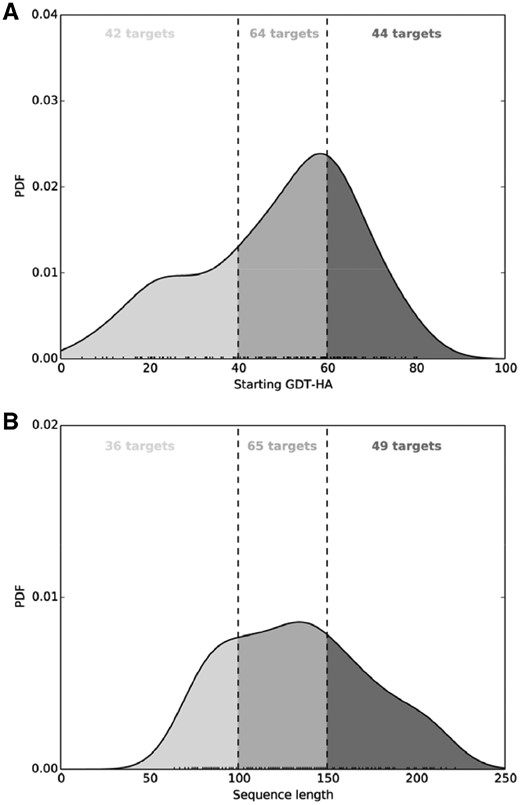
Normalized probability distributions of target accuracy and length of the benchmark dataset. (A) GDT-HA scores of the starting structures; (B) sequence length
3.2 Effects of multi-resolution probabilistic restraints
To investigate the effects of applying multi-resolution probabilistic restraints in structure refinement, we perform four distinct restrained relaxation runs for all 150 targets in the benchmark dataset. Each restraint relaxation run uses a specific restraint resolution corresponding to one of the four distance thresholds r ∈ {0.5, 1, 2, 4} Å and generates one set of refined structures. In Table 1, we show GDT-HA score of the refined structures generated using different restraint resolutions along with the starting GDT-HA score averaged over the entire dataset (Supplementary Table S1). On an average, only using restraints at 0.5 Å resolution results in net positive refinement with 57.33% (86/150) rate of successful refinement; while restraints at 1, 2 and 4 Å resolutions results in overall negative refinement with gradually decreasing successful refinement rate of 46% (69/150), 30% (45/150) and 24.67% (37/150) respectively. In terms of the average ΔGDT-HA, minor increase (0.5425) for 0.5 Å restraints and minor decrease (−0.0422) for 1 Å restraints has been observed, while 2 and 4 Å restraints produce substantial structural degradation (−1.3942 and −2.7407 respectively). The average GDT-HA score of the refined models, therefore, steadily declines as restraint resolutions vary from 0.5 to 4 Å.
Average GDT-HA score after refinement using different restraint resolutions in a benchmark set of 150 targets
| Restraint resolution | Avg. GDT-HAa (Avg. ΔGDT-HAb) |
|---|---|
| 0.5 Å restraints | 49.5413 (0.5425) |
| Nullc | 48.9988 (0.0) |
| 1.0 Å restraints | 48.9566 (−0.0422) |
| 2.0 Å restraints | 47.6046 (−1.3942) |
| 4.0 Å restraints | 46.2581 (−2.7407) |
| Restraint resolution | Avg. GDT-HAa (Avg. ΔGDT-HAb) |
|---|---|
| 0.5 Å restraints | 49.5413 (0.5425) |
| Nullc | 48.9988 (0.0) |
| 1.0 Å restraints | 48.9566 (−0.0422) |
| 2.0 Å restraints | 47.6046 (−1.3942) |
| 4.0 Å restraints | 46.2581 (−2.7407) |
GDT-HA values are sorted in non-increasing order.
Values in parenthesis are difference between average refined GDT-HA for each restraint type and the average starting GDT-HA. A positive number indicates successful refinement on an average.
Represents the starting structures.
In Figure 3, we show the normalized probability distributions of the score changes (ΔGDT-HA) at various restraint resolutions for the entire benchmark set. The results further demonstrate that the median score change gradually shifts towards the negative ΔGDT-HA realm as restraint resolution moves from 0.5 to 4 Å. Prevalence of conservative structural modifications with ΔGDT-HA ranging between −5 and 5 units are observed at 0.5 and 1 Å resolutions, while adventurous degree of conformational change of 5 or more GDT-HA units can be observed at 2 and 4 Å resolutions albeit at the expense of increased likelihood of worsening the starting structure. Even with enhanced potential of structural worsening at 2 and 4 Å resolutions with 18.7 and 31.3% of starting structures taking a loss of 5 or more GDT-HA units respectively, 6 and 4.7% cases show remarkable examples of refinement improving the starting structures by 5–20 GDT-HA units. The results indicate that the choice of restraint resolution is closely related to the tradeoff between degree and consistency of refinement. Restraint resolutions of 0.5 and 1 Å result in modest yet consistent refinement while 2 and 4 Å restraint resolutions have the potential to make substantial degree of refinement but often at the expense of consistency.
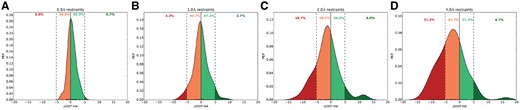
Effect of multi-resolution probabilistic restraints on degree of structural change. Normalized probability density function (PDF) distributions of GDT-HA differences between the refined and starting structures over all 150 benchmark proteins using restrained relaxation with probabilistic restraints at (A) 0.5 Å; (B) 1 Å; (C) 2 Å; (D) 4 Å. Numbers indicate % of refined structures belonging to different ΔGDT-HA ranges
3.3 Refinement with cumulative and non-cumulative restraints
Given the starting structure, we use DeepCNF classifiers for residue level ensemble classification to generate multi-resolution probabilistic restraints and cumulatively integrate them into REF15 scoring function of Rosetta. Consequently, all restraints are simultaneously applied for all residues weighted according to their probabilities as predicted by ensemble of DeepCNF classifiers. We iteratively apply restrained FastRelax protocol for five iterations using four parallel threads to generate a total of twenty refined models. We subsequently apply the ensemble classifier based scoring function described above to score the resulting twenty refined structures and select the five top high scoring refined structures. This corresponds to employing refineD with cumulative restraints (hereafter called refineD-C). We also develop an alternative refinement strategy by using DeepCNF classifiers for residue level ensemble classification to generate multi-resolution probabilistic restraints and integrate them into REF15 scoring function of Rosetta in a non-cumulative way. That is, each multi-resolution restraint is individually applied for all residues weighted according to their probabilities as predicted by ensemble of DeepCNF classifiers. Once again, we apply restrained FastRelax protocol for five iterations using four parallel threads to generate a total of twenty refined models, but this time each parallel thread uses different restraint resolution. We subsequently apply the previously described scoring function to score the resulting twenty refined structures and select the top five high scoring refined structures. This corresponds to employing refineD with non-cumulative restraints (hereafter called refineD-NC). As controls, we employ FastRelax without any restraints as well as four sets of FastRelax runs after applying Rosetta CoordinateConstraint on each of the Cα atom of the starting structure with FLAT_HARMONIC restraints of 0.5, 1, 2, 4 Å having uniform restraint weights of 1.0 (hereafter called FastRelax-r Å, r ∈{0.5, 1, 2, 4} Å), as opposed to the probabilistically weighted restraints predicted by ensemble of DeepCNF classifiers. We generate twenty refined structures per target for each FastRelax-r Å run and subsequently use Rosetta Energy Function 2015 (REF15) to select five refined structures having lowest REF15 energy values. Additionally, we refine the starting structures using two widely used refinement methods FG-MD (Zhang et al., 2011) and ModRefiner (Xu and Zhang, 2011). FG-MD applies fragment-guided MD simulation while ModRefiner relies on atomic-level energy minimization. For FG-MD, we collect the refined structures directly from https://zhanglab.ccmb.med.umich.edu/FG-MD/. We perform two sets of ModRefiner runs: (i) using a strength of 0 for the pairwise Cα based distance restraints derived from the starting structures (ModRefiner-0); and (ii) using a strength of 100 for the pairwise Cα based distance restraints derived from the starting structures (ModRefiner-100). This results in two sets of refined conformations for the benchmark set. It should be noted that restraint strength 0 in ModRefiner represents unrestrained refinement allowing large conformational change, while restraint strength 100 in ModRefiner restricts substantial structural modification. In Table 2, we show average ΔGDT-HA of the refined structures as well as P-values of Wilcoxon signed-rank test with the null hypothesis that refined structures produced by refinement are same as starting structures. Figure 4 shows the distributions of the score changes (ΔGDT-HA) for refineD against the controls (Supplementary Tables S2–S3).
Comparison between refineD with cumulative and non-cumulative restraints and other refinement methods based on average ΔGDT-HA score in a benchmark set of 150 targets
| Method | Avg. Δ top 1a (P-valueb) | Avg. Δ best of 5c (P-value) |
|---|---|---|
| refineD-Cd | 0.6365 (7.11606 × 10⁻⁷) | 1.3109 (8.24092 × 10⁻¹⁸) |
| refineD-NCe | −1.2403 (0.000302906) | 1.5343 (1.45904 × 10⁻⁸) |
| FG-MD | 0.5597 (1.34714 × 10⁻⁷) | 0.5597 (1.34714 × 10⁻⁷) |
| FastRelax | −3.4317 (2.24913 × 10⁻¹²) | −0.1999 (0.61376) |
| FastRelax-0.5 Å | −0.1403 (0.03498) | 0.0548 (0.853297) |
| FastRelax-1.0 Å | −0.3411 (0.082146) | 0.8811 (0.0000328637) |
| FastRelax-2.0 Å | −1.2120 (0.000044333) | 0.8223 (0.117838) |
| FastRelax-4.0 Å | −2.5471 (7.39414 × 10⁻⁹) | 0.0751 (0.561429) |
| ModRefiner-0f | −0.8400 (0.00268802) | −0.8400 (0.00268802) |
| ModRefiner-100g | 0.1491 (0.0675135) | 0.1491 (0.0675135) |
Note: Bold numbers indicate best in each category.
Average ΔGDT-HA of top selected model. Positive number indicates successful refinement.
P-value of Wilcoxon Signed Rank Test.
Average ΔGDT-HA of the best of top five selected models.
refineD with cumulative restraints.
refineD with non-cumulative restraints.
ModRefiner with strength of starting structure derived restraints set to 0.
ModRefiner with strength of starting structure derived restraints set to 100.
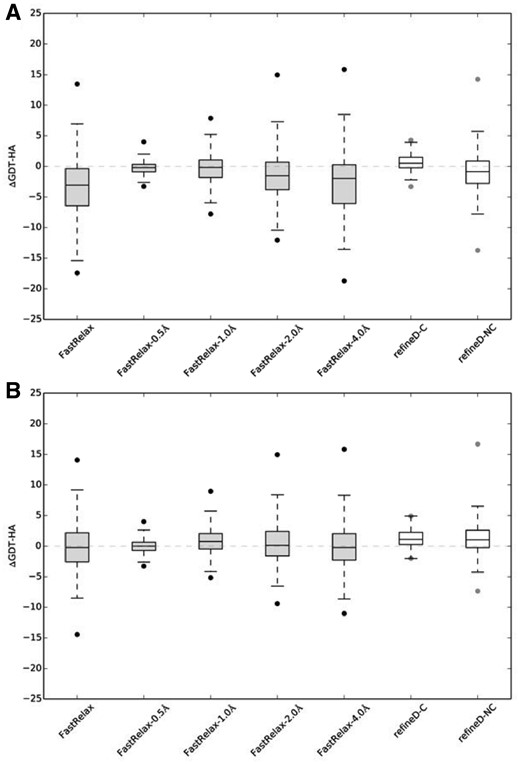
Refinement degree distributions for refineD against controls. ΔGDT-HA distributions over all 150 benchmark proteins considering (A) top 1 refined structure; (B) best of top 5 refined structures
The results demonstrate that out of the ten refinement protocols tested, only three (refineD-C, FG-MD and ModRefiner-100) produce overall positive refinement as indicated by a positive average ΔGDT-HA score considering the top 1 refined structure, even though the degree of refinement is modest in nature. refineD-NC, FastRelax, FastRelax-0.5 Å, FastRelax-1.0 Å, FastRelax-2.0 Å, FastRelax-4.0 Å as well as ModRefiner-0 refinements result in overall negative refinement. ModRefiner-100, despite showing overall positive refinement, is not statistically significant at 95% confidence level as revealed by Wilcoxon Signed Rank Test. refineD-C and FG-MD produces statistically significant refinement at 95% confidence level, with refineD-C having the highest ΔGDT-HA score. It should be noted here that FG-MD uses homologous fragment derived restraint information during refinement to guide MD simulations. refineD-C, on the other hand, is based purely on machine learning derived restrained relaxation completely free from homology. Better performance of homology-free method such as refineD-C makes it suitable for refining protein targets irrespective of homology. Performance of refineD-C is statistically significantly better at 95% confidence level compared to the controls as revealed by one-sample t-test of the GDT-HA score differences between the refined structures produced by refineD-C and controls (P-values of 1.459 × 10⁻¹⁶, 6.69374 × 10⁻²⁰, 9.55371 × 10⁻⁸, 1.29607 × 10⁻⁷ and 1.14242 × 10⁻¹¹ for FastRelax, FastRelax-0.5 Å, FastRelax-1.0 Å, FastRelax-2.0 Å and FastRelax-4.0 Å respectively). refineD-C is also much more consistent than the controls in terms of number of successful refinement cases (ΔGDT-HA score > 0) achieving 63% (94/150) success while FastRelax, FastRelax-0.5 Å, FastRelax-1.0 Å, FastRelax-2.0 Å and FastRelax-4.0 Å attaining 20% (30/150), 37% (55/150), 43% (64/150), 33% (50/150) and 27% (41/150) successes respectively. refineD-NC, while not as consistent as refineD-C, attains 38% (57/150) success that is similar to that of FastRelax-0.5 Å. In terms of best of top 5 refined structures, refineD-NC, refineD-C, FastRelax-0.5 Å, FastRelax-1.0 Å, FastRelax-2.0 Å and FastRelax-4.0 Å refinements result in overall positive refinement with refineD-NC attaining the highest average ΔGDT-HA score. However, only refineD-NC, refineD-C and FastRelax-1.0 Å refinements are statistically significant at 95% confidence level as revealed by Wilcoxon Signed Rank Test. Performance differences of refineD-NC are statistically significantly better than the controls (P-values of one-sample t-tests are 3.25713 × 10⁻⁷, 4.44823 × 10⁻¹⁰, 0.000533175, 0.000590979 and 3.25617 × 10⁻⁷ for FastRelax, FastRelax-0.5 Å, FastRelax-1.0 Å, FastRelax-2.0 Å and FastRelax-4.0 Å respectively). Except for FastRelax-1.0 Å, refineD-C also delivers statistically significantly better performance compared to the controls (P-values of one-sample t-tests are 0.0002796, 1.04138 × 10−42, 0.00604323 and 0.00112333 for FastRelax, FastRelax-0.5 Å, FastRelax-2.0 Å and FastRelax-4.0 Å respectively). Once again, refineD-C attaints most consistent refinement with 81% (121/150) success followed by refineD-NC 69% (104/150), better than the controls with 40% (70/150), 43% (64/150), 60% (90/150), 51% (77/150) and 45% (67/150) successes for FastRelax, FastRelax-0.5 Å, FastRelax-1.0 Å, FastRelax-2.0 Å and FastRelax-4.0 Å respectively. Overall, the results indicate that refineD-C corresponds to a conservative refinement strategy achieving consistent but modest refinement that is statistically significant. refineD-NC, on the other hand, is an adventurous refinement strategy capable of making significant and pronounced degree of refinement.
Some representative examples of pronounced refinement with refineD-NC are shown in Figure 5. Protein targets 1x6iA (Fig. 5A) and 2o37A (Fig. 5B) are primarily α-helical in nature with the GDT-HA score of the corresponding starting structures around 55. Refinement for these targets results in 29.99 and 18.32% improvements in GDT-HA scores respectively, bringing the refined GDT-HA scores of these proteins to values greater than 65. Refinement for targets 2pv2A (Fig. 5C) and 3cjsB (Fig. 5D) with mixed α-helical and β-sheet geometries improve GDT-HA scores by 15.31 and 29.1% respectively. In all cases, structural improvements are distributed across the entire chain causing a substantial global refinement of the starting structures.
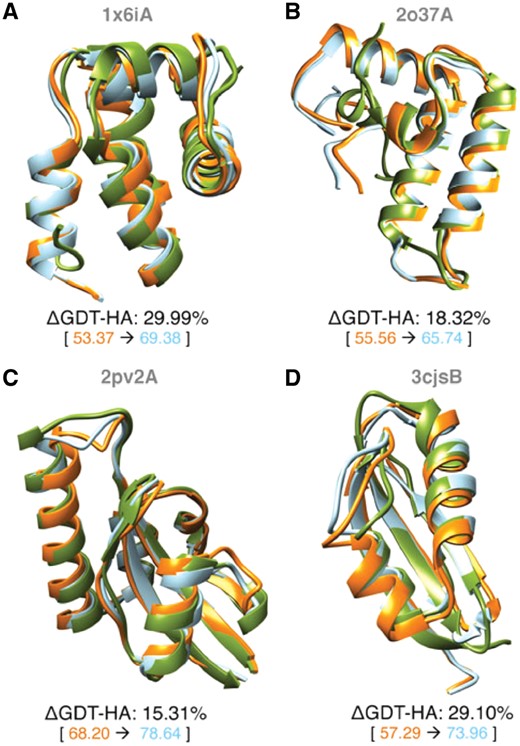
Representative examples of refineD-NC refinement. For each example show in (A–D), the starting (orange) and refined (cyan) structures are overlaid on the experimental (green) structures with numeric degrees of refinement shown below
3.4 Impact of enhanced sampling and alternative scoring
To investigate whether enhanced sampling and alternative scoring affect the performance of cumulative and non-cumulative refineD methods, we conduct twofold experiments via: (i) 5-fold enhancement in sampling compared to the original pool of 20 refined structures by applying restrained relaxation runs for twenty five iterations using four parallel threads to generated 100 refined structures for all 150 targets in the benchmark dataset; and (ii) using the full atom Rosetta Energy Function 2015 (REF15) for selecting top five high scoring refined structures from the pools of original (pool20) and enhanced (pool100) sampling.
In Figure 6, we show the distributions of ΔGDT-HA for pool20 and pool100 as well as top 5 refined structures selected by REF15 and ensemble classifier based scoring function for both cumulative and non-cumulative refineD methods. For relaxation with cumulative restraints, the average ΔGDT-HA is –0.85 for pool20, slightly better compared to the average ΔGDT-HA of −0.88 for pool100. The average ΔGDT-HA of top 5 refined structures selected by ensemble classifier based scoring function from pool20 is −1.07, while selection from pool20 using REF15 degrades the performance compared to the ensemble classifier based scoring function with an average of −2.0 ΔGDT-HA points. For pool100, REF15 selection degrades the average from −1.32 to −2.16. For relaxation with non-cumulative restraints, the averages for pool20 and pool100 are comparable with ΔGDT-HA values of around 0.6. In this case, REF15 selection outperforms the ensemble classifier based scoring function with an average of 0.73 compared to 0.61 for pool20, and 0.68 compared to 0.63 for pool100. Collectively, the results indicate that enhanced sampling or alternative scoring may offer slight performance improvement for refineD with non-cumulative restraints.
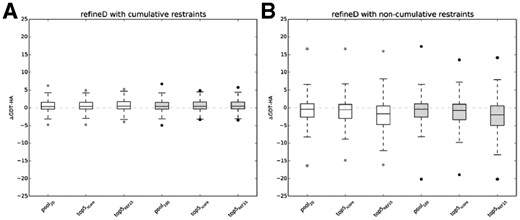
Impact of enhanced sampling and alternative scoring. ΔGDT-HA distributions over all 150 benchmark proteins for pools of original (pool20) and enhanced (pool100) sampling and top five refined structures selected using ensemble classifier based scoring function (top5score) and REF15 (top5REF15) for (A) refineD with cumulative restraints; (B) refineD with non-cumulative restraints
3.5 Relationships between degree of structural refinement and nature of the starting structures
Figure 7 shows the lengths of the starting structures and GDT-HA scores of the starting structures against ΔGDT-HA values for both refineD-C and refineD-NC methods in terms of top 1 and the best of top 5 refined structures selected by ensemble classifier based scoring function. Overall, the degree of refinement is noticeable for smaller targets (length <100 residues) and medium range of starting GDT-HA scores (40 < GDT-HA < 60). This trend gets amplified for the best of top 5 compared to top 1 refined structure, particularly for refineD-NC.
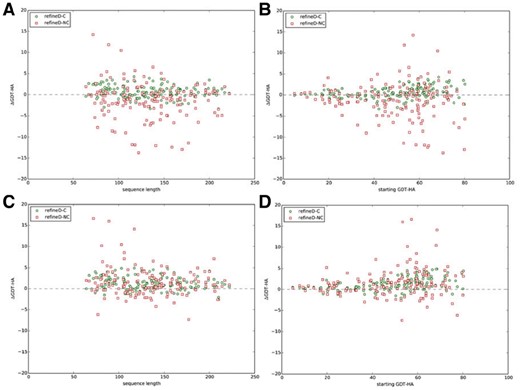
Lengths and accuracies of starting structures against degree of structural refinement. ΔGDT-HA scores against length (A), (C) and GDT-HA of the starting structures (B), (D) over all 150 benchmark proteins for refineD-C and refineD-NC methods for top 1 (A), (B) and the best of top 5 (C), (D) refined structures selected using ensemble classifier based scoring function
In Figure 8, we show the degree of structural refinement measured in term of ΔGDT-HA scores of the best of top five refined structures using refineD-NC with respect to the accuracy of the corresponding starting structures (in terms of GDT-HA) for targets of different lengths (Fig. 8A–C) and different accuracies of starting structures (Fig. 8D–F). Once again, the best improvement is observed for smaller targets having length less than 100 residues with 16.7% of starting structures showing remarkable examples of refinement by improving the starting structures by 5–20 GDT-HA units (Fig. 8A) and those in the medium range of starting accuracies having starting GDT-HA scores between 40 and 60 units with 15.6% cases making marked positive refinement of 5 or more GDT-HA units (Fig. 8E). We additionally examine whether the refinement performance is affected when a test protein shares the same family, superfamily and fold similarity with any of the 200 proteins in the training dataset (Supplementary Fig. S1).
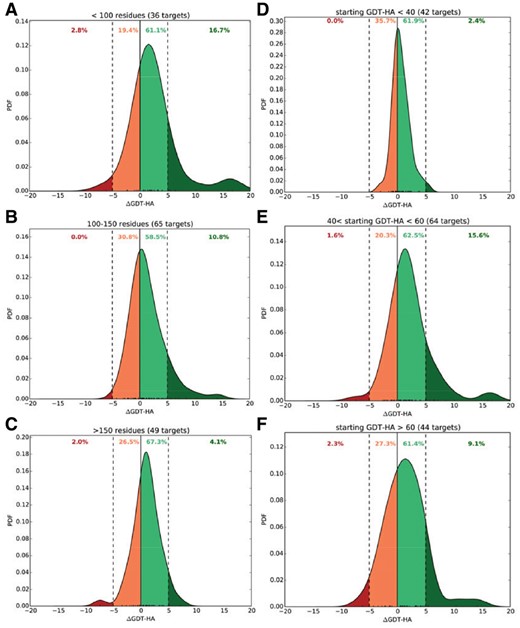
Degree of refinement of refineD-NC for different target lengths and different starting GDT-HA. Normalized probability density function (PDF) distributions of ΔGDT-HA scores for different target length bins (A–C) and different starting GDT-HA bins (D–F). Data for the best of top 5 refined structures presented
4 Conclusions
To use or not to use restraints during protein structure refinement remains a conundrum (Feig, 2017; Heo and Feig, 2018). We develop a novel refinement method called refineD, which uses deep discriminative learning based ensemble classifiers to predict multi-resolution probabilistic restraints from the starting structure and converts these restraints into scoring terms to guide conformational sampling during structure refinement and subsequently scores a pool of resulting refined structures using ensemble classifier based scoring. For the first time, we demonstrate that machine learning based restrained relaxation is able to address the tradeoff that exists between degree and consistency of refinement. refineD is shown to produce consistent and aggressive structural refinement through the use of cumulative and non-cumulative restraints. We demonstrate that the resolution of restraint directly affects the degree of conformational change that can be used for conservative or adventurous structure refinement. Compared to unrestrained relaxation or relaxation restrained to starting structures using the FastRelax application of Rosetta or atomic-level energy minimization based ModRefiner method, refineD delivers better performance in terms of consistency and substantial structural refinement. Moreover, homology-free refineD method outperforms MD simulation based FG-MD protocol, which uses homologous information. Collectively, these results demonstrate a promising new direction in protein structure refinement by using machine learning based restraints to drive moderately accurate template-based protein models closer to the native state, making refineD an useful contribution in the field of protein structure prediction in particular and protein structural bioinformatics in general.
Acknowledgements
The author wants to thank Md Hossain Shuvo and Sutanu Bhattacharya for helpful discussions.
Funding
The work was partially supported by an Auburn University new faculty start-up grant to DB.
Conflict of Interest: none declared.
References

