


Abstract
Currently, most genome assembly projects focus on contigs and scaffolds rather than assembly graphs that provide a more comprehensive representation of an assembly. Since interactive visualization of large assembly graphs remains an open problem, we developed an Assembly Graph Browser (AGB) tool that visualizes large assembly graphs, extending the functionality of previously developed visualization approaches. Assembly Graph Browser includes a number of novel functions including repeat analysis, construction of the contracted assembly graphs (i.e. the graphs obtained by collapsing a selected set of edges) and a new approach to visualizing large assembly graphs.
Supplementary data are available at Bioinformatics online.
1 Introduction
Many genome assembly algorithms use graphs as core data structures, which include de Bruijn graphs (Pevzner et al., 2001), overlap-layout-consensus graphs (Myers et al., 2000) and string graphs (Simpson and Durbin, 2012). Visualization of an assembly graph (a graph used by the assembler) helps to revisit the problematic parts of the graph, modify the assembly (Wick et al., 2015), and plan additional genome finishing experiments (Schmid et al., 2018). Assembly graphs also reveal unresolved repeats, such as segmental duplications with complex mosaic structure (Kolmogorov et al., 2018; Pu et al., 2018).
Previously developed assembly visualization tools include ABySS-Explorer (Nielsen et al., 2009), Ray Cloud Browser (Boisvert et al., 2010), IGV (Robinson et al., 2011), Bandage (Wick et al., 2015), Icarus (Mikheenko et al., 2016) and SGTK (Kunyavskaya and Prjibelski, 2018). IGV and Icarus are designed to visualize contigs/scaffolds, while ABySS-Explorer and Ray Cloud Browser can visualize the assembly graphs of the corresponding assemblers (ABySS and Ray). The recently introduced SGTK tool focuses on visualizing scaffold connections between contigs. Bandage is currently the most popular visualization approach that works with a wide range of assembly graph formats.
Emerging long-read technologies have enabled accurate and contiguous assemblies of large genomes (Koren et al., 2017), but the problem of visualizing the resulting assembly graphs remains open. Although Bandage proved to be a useful tool for analyzing small assembly graphs, navigation becomes difficult in large and tangled graphs. While the authors of SGTK have improved on the visualization of large graphs, the tool was primarily designed for scaffold graphs, rather than assembly graphs.
To address this challenge, we developed Assembly Graph Browser (AGB) for assembly graph visualization, which scales to large and complex datasets. AGB automatically splits the input assembly graph into subgraphs based on different criteria (such as connectivity, repeat configuration or reference mapping), which makes the exploration of large graphs feasible. Additionally, AGB provides various graph simplification functions (removing/collapsing edges based on length, coverage or multiplicity), which allows the user to focus on large-scale graph structures. Given a reference genome, AGB visualizes positions of the edges in the reference and highlights assembly errors using QUAST.
2 Materials and methods
AGB works with assembly graphs in the GFA (https://github.com/GFA-spec/GFA-spec), FASTG (Jaffe et al., 2012) or Graphviz (Gansner and North, 2000) formats. It also utilizes additional information (e.g. how contigs are traversing the graph) provided by various popular assemblers: Canu (Koren et al., 2017), Flye (Kolmogorov et al., 2018) and SPAdes (Bankevich et al., 2012). AGB generates interactive JavaScript-based web pages with two main parts: a control panel and a graph viewer (Fig. 1).
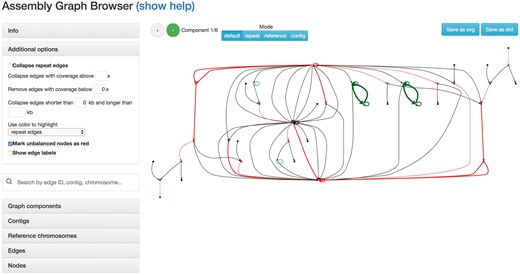
An AGB visualization of the Saccharomyces cerevisiae dataset generated with the Flye assembler (Kolmogorov et al., 2018). The left panel includes the menu with visualization options, a search bar and tables summarizing information about the edges and connected components; the assembly graph is shown on the right. In this graph, edges represent the genomic sequences, while nodes serve as junctions (each edge is represented in forward and reverse-complement copies, thus the graph is always symmetric). The edge labels were hidden to simplify the overview. Unique edges are shown in black, while repetitive edges are shown in color (adjacent repeats have the same color). Tip nodes (with zero indegree or outdegree) are shown as black circles. Unbalanced nodes are highlighted in red. AGB splits the assembly graph into subgraphs and visualizes them separately. The top panel allows to switch between different subgraphs. By default, subgraphs are defined as connected components of the graph. It is also possible to split the graph based on repeat edges clusters, reference mappings and contig paths
AGB uses the d3-based GraphViz (Gansner and North, 2000) library (https://github.com/magjac/d3-graphviz) for assembly graph layout and visualization. GraphViz provides a hierarchical view of the graph structure and the JavaScript implementation provides various interactive features, such as zooming, navigating and interacting with the elements of the graph.
To visualize a large assembly graph with thousands of nodes/edges, AGB splits it into the smaller subgraphs, displaying each subgraph separately using the METIS library (Karypis and Kumar, 1998). Given the input graph, AGB generates minimal edge-cuts, which define subgraphs with <100 nodes in each (Supplementary Fig. S2). AGB also supports various graph modification operations, such as edge removal (e.g. to remove low-coverage edges) and contraction (e.g. to contract repeat edges). In comparison, Bandage can visualize subgraphs that contain a sequence homologous to a FASTA query or induced by a specified subset of segments, but this strategy is not optimal for exploring the graph without prior knowledge about the sequence of interest.
AGB classifies each edge as unique or repetitive (corresponding to unique/repetitive sequence in the genome). Some assemblers (e.g. Flye and Canu) already provide this classification, while if not available, AGB defines an edge as repetitive if its coverage is higher than 1.75× of the median assembly graph coverage (otherwise, the edge is classified as unique). Adjacent repeat edges are grouped into clusters. A repeat cluster is called simple (mosaic) if it consists of one (multiple) edges.
2.1 Assembly graph representations
AGB offers several modes for representing the assembly graph:
Default mode. In this mode, AGB splits the assembly graph into connected components (each large component is further split using the METIS library). This mode could be used to explore the graph of a de novo assembly. The graph representation can be further modified using Additional options (described below).
Repeat-focused mode. In this mode connected components are computed using only repetitive (but not unique) edges. Thus, each subgraph corresponds to a simple/mosaic repeat (unique edges that are entering/exiting this repeat component are also shown). This allows exploration the repeat structure of the genome and investigation of the unresolved repeats (that typically correspond to contig/scaffold breakpoints).
Reference-based mode. If a reference genome is available, AGB runs QUAST-LG (Mikheenko et al., 2018) to align the graph edges and contigs (scaffolds) produced by an assembler to the reference genome, detecting assembly errors. This mode provides two additional options for edge coloring: according to their alignments to the reference (same colors represent the same chromosomes), or based on the presence of assembly errors. It is also possible to group connected components based on their chromosome assignments.
Contig-based mode. If an assembler provides paths in the assembly graph corresponding to the assembled contigs/scaffolds, AGB can display each path separately. Given the reference genome, AGB also shows the number of assembly errors per contig.
Examples of AGB visualizations are given in the Supplementary Material and in the GitHub repository.
2.2 Menu panel
The left panel of AGB specifies multiple options and tables describing various elements of the assembly graph (Fig. 1).
Additional options. To simplify the assembly graph, AGB has an option to filter out edges based on read coverage and/or length. AGB can also collapse all repetitive edges producing a contracted assembly graph (Supplementary Fig. S1). Alternatively, a user can remove all unique edges from the graph (as described above).
Tables. AGB displays interactive, sortable tables containing information about edges, vertices, contigs, reference chromosomes and connected components. A user can select a contig/scaffold/chromosome of interest from the table to either highlight edges that belong to the selected element or to display it in the contig/reference-based mode. A component of interest can be chosen based on various features, e.g. the number of incoming and outgoing edges or total length of edges.
3 Conclusion
Although assembly graphs represent a powerful tool for analyzing and improving genome assemblies, their applications are currently limited due to a shortage of interactive visualization tools. To address this gap, we developed the AGB tool that provides interactive visualizations of assembly graphs and includes various visualization modes and options for simplifying the graph. We believe that AGB can benefit both developers and users of various genome assembly tools.
Funding
A.M. was supported by St. Petersburg State University, St. Petersburg, Russia (grant ID PURE 28396291). M.K. was supported by NSF/MCB-BSF grant 1715911.
Conflict of Interest: none declared.
References

