


Abstract
Drug combinations that simultaneously suppress multiple cancer driver signaling pathways increase therapeutic options and may reduce drug resistance. We have developed a computational systems biology tool, DrugComboExplorer, to identify driver signaling pathways and predict synergistic drug combinations by integrating the knowledge embedded in vast amounts of available pharmacogenomics and omics data.
This tool generates driver signaling networks by processing DNA sequencing, gene copy number, DNA methylation and RNA-seq data from individual cancer patients using an integrated pipeline of algorithms, including bootstrap aggregating-based Markov random field, weighted co-expression network analysis and supervised regulatory network learning. It uses a systems pharmacology approach to infer the combinatorial drug efficacies and synergy mechanisms through drug functional module-induced regulation of target expression analysis. Application of our tool on diffuse large B-cell lymphoma and prostate cancer demonstrated how synergistic drug combinations can be discovered to inhibit multiple driver signaling pathways. Compared with existing computational approaches, DrugComboExplorer had higher prediction accuracy based on in vitro experimental validation and probability concordance index. These results demonstrate that our network-based drug efficacy screening approach can reliably prioritize synergistic drug combinations for cancer and uncover potential mechanisms of drug synergy, warranting further studies in individual cancer patients to derive personalized treatment plans.
DrugComboExplorer is available at https://github.com/Roosevelt-PKU/drugcombinationprediction.
Supplementary data are available at Bioinformatics online.
1 Introduction
Targeted cancer therapy has been developed as an effective way to combat cancer (Green, 2004; Polyak and Garber, 2011), aiming to inhibit or reverse the activation patterns of critical cancer signaling pathways. However, dramatic initial positive response of many targeted cancer therapies is often followed by development of drug resistance. Pathway redundancies, feedback and crosstalk present in cancer cells allow them to acquire this resistance, leading to treatment failure (Bernards, 2012; Yamaguchi et al., 2014). Most incidences of drug resistance arise from: (i) reactivation of the original cancer driver pathways by gene mutation (Choi et al., 2010); (ii) increased expression of drug-targeted genes (Poulikakos et al., 2011; Shi et al., 2012) or their upstream and downstream genes (Bivona et al., 2011; Little et al., 2011); or (iii) activation of bypass pathways closely related to the original cancer driver pathways (Engelman and Janne, 2008; Turke et al., 2010). Low prevalence of druggable mutations often results in trials that mask efficacy in large and unselected populations of patients. This highlights an unmet need for more precision therapies (Chan and Hughes, 2014; Hirsh, 2015). No single cure has been found for any subset of metastatic cancer. Combination therapy is among the most promising strategies for improving cancer treatment, as it impedes cellular compensatory mechanisms, which are often related to drug resistance.
Currently approved drug combinations are largely the result of empirical clinical experience rather than rational design, and they cover only a tiny fraction of the huge potential therapeutic space. Reliable prediction of drug combinations for a specific cancer is extremely challenging, however. Some supervised machine learning models have been proposed to integrate the genomics profiles of tumor and pharmacological profiles of drugs. For example, Preuer et al. (2018) proposed a deep neural network model, DeepSynergy, to predict effective drug combinations using the gene expression data of 39 cancer cell lines and the chemical features of 38 anticancer drugs. DeepSynergy showed an improvement of 7.2% over other machine learning techniques such as support vector machine and Elastic Nets. However, these methods request large number of known synergistic drug combinations and they usually cannot provide an interpretation of potential mechanism of synergy of specific drug combinations (black box). Pathway-based models with the ability to discover the molecular mechanism of disease were then proposed for drug combination prediction. For example, Combinatorial Drug Assembler (CDA) (Lee et al., 2012) was developed to identify drug combinations whose affected signaling pathways overlap with disease-enriched signaling pathways and to select signaling pathways based on gene set enrichment analysis of pathways using differentially expressed genes. Since tumor driver genes are not well defined, CDA leads to biased selection of drug combinations that do not inhibit cancer driver pathways. TIMMA (Tang et al., 2013), another drug combination prediction approach, selects combinations that target multiple survival pathways of a given cancer by integrating drug screening data and drug target interactions into a target inhibition network framework. These survival pathways were constructed based on empirical selection, ignoring much valuable information provided by genomics data, such as gene mutations, of the disease under investigation. Furthermore, TIMMA is not designed for scalability in searching for larger drug combinatory space due to its limitation of using single drug screening assay data as an input. On the other hand, pharmacological data, such as drug indications and side effects (Huang et al., 2014; Zhao et al., 2011), have been used to predict effective drug combinations, illustrated by a number of synergistic drug combinations reported for various diseases (Jia et al., 2009; Liu et al., 2010). These approaches are not generalizable and lack experimental validation. In addition, ordinary differential equations-based models have been used to encode a fixed pathway as a system to simulate the response of cancer cells to drug combinations (Iadevaia et al., 2010; Nelander et al., 2008). These approaches, however, ignore important gene or pathway features, such as gene mutation status and pathway crosstalk (Al-Lazikani et al., 2012), and reliable parameter estimation becomes infeasible when the number of genes in the pathway reaches tens or hundreds.
To fill the gap, we developed the DrugComboExplorer, a computational systems biology tool that concurrently integrates pharmacogenomics profiles of 5585 drugs and bioactive compounds from the NIH LINCS program (Library of Integrated Network-based Cellular Signatures) and genomic profiles for specific cancer types (i.e. signaling pathways, interactome and pharmacological data). This tool adopts a data-driven strategy to uncover novel regulatory signaling pathway mechanisms (i.e. driver signaling networks) by integrating multi-omics data of cancer patients and performs large-scale drug combination prediction (15 593 320 available drug combinations). We conducted validation experiments using cell viability assays to evaluate the predictive power of DrugComboExplorer with applications on subtypes of B-cell lymphoma and prostate cancer (PCa). We confirmed that DrugComboExplorer can reliably prioritize potential drug combinations and identify cancer driver pathways underlying the synergistic drug combinations.
2 Materials and methods
2.1 Overview of DrugComboExplorer
DrugComboExplorer aims to identify candidate drug combinations targeting cancer driver signaling networks and consists of two components: identification of the driver signaling networks (Fig. 1A) and evaluation of the targeting effects of drug combinations on the driver signaling networks (Fig. 1B). It employs an algorithm based on non-parametric, bootstrapping-based simulated annealing (NPBSA) to identify robust dysregulated signaling networks with high statistical confidence by integrating DNA-seq, gene copy number, DNA methylation and RNA-seq data of specific cancer patients with interactome data (Fig. 1A). NPBSA explores sub-networks from individual driver (seed) genes identified from the frequently mutated or copy number amplified genes from DNA-seq and gene copy number data of cancer patients. It grows the subnetwork by adding in the neighbor genes of current network genes therein to increase a pre-defined network score until an optimum score for the current subnetwork is achieved. By applying NPBSA on the RNA-seq (or methylation) data, we will generate transcriptome- (or methylation-)based driver networks. A co-expression network was generated based on RNA-seq data of specific cancer patients by analyzing co-expression measures of each gene pair. A gene regulation network was derived by integrating RNA-seq data of cancer patients and transcription factor-target interactions using a supervised regulatory network algorithm, SIRENE (Mordelet and Vert, 2008). The dysregulated signaling networks identified from the transcriptome and methylation profiles, the co-expression network, and gene regulation network were then combined into the driver signaling networks to predict drug combinations. See Supplementary File S1 for details about the driver networks identification approach.
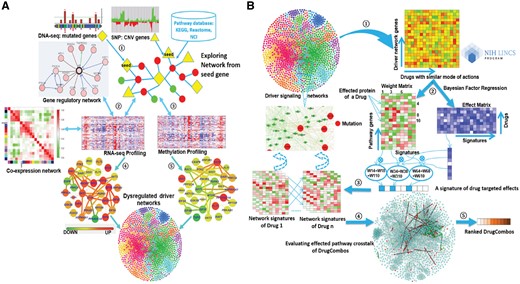
The workflow of DrugComboExplorer includes two major components: (A) systematic overview of applying NPBSA on four different types of genomics data to identify driver signaling pathways in cancer. There are five steps in this component, Step 1: to identify the seed (driver) genes from the frequently mutated and copy number variation genes using the DNA-seq and copy number data of specific cancer patients; Step 2: to explore networks from the seed genes by integrating the RNA-seq profiles and pathway knowledge from known pathway databases and generate a gene co-expression network and a gene regulatory network using the RNA-seq profiles; Step 3: to explore networks from the seed genes by integrating the methylation profiles and pathway data; Step 4: to combine the networks generated from the RNA-seq profiles together; Step 5: to combine the networks generated from the RNA-seq data and from the methylation data together. Herein, the color legend shows how the node color represents the fold change. (B) Identification of synergistic drug combinations and the underlying mechanisms based on the pharmacogenomics data and the identified dysregulated driver networks. There are five steps in this component, Step 1: extraction of the drug treated gene expression profiles with genes from the identified driver networks only from the NIH LINCS data; Step 2: to use a Bayesian factor regression approach to factorize the treatment profiles into weight matrices and effect matrices; Step 3: generation of the driver network signatures for each of the drugs; Step 4: evaluation of the synergistic targeting effects of drug combinations on alternative driver signaling networks; Step 5: ranking of the drug combinations according to their quantitative synergistic effects
Figure 1B shows synergistic drug combination prediction based on pharmacogenomics data and the identified dysregulated driver networks. First, we extracted the signatures of treatment transcriptional responses (genomic profiling of cancer cell lines treated with specific drugs or bioactive compounds from the LINCS project) on each driver signaling network. We clustered those drugs into functional clusters (modules) based on drug–drug similarities. Second, we decomposed the signatures of each drug functional module (a matrix) into a weight matrix and an effect matrix using the Bayesian factor regression model (BFRM) (Bayarri et al., 2003; Carvalho et al., 2008). Third, we predicted off-targets of drugs using bipartite network projection on the drug–drug similarity network. According to the weights of drug targets or off-targets in the weight matrix, we extracted the targeted effects of each drug on all genes in the driver signaling networks. Thus, we obtained a drug-induced gene expression profile for each drug on each driver signaling network. Fourth, drug combinations were ranked according to their targeted effect scores by quantifying the collaborative targeted effects (CTE) on the same driver signaling networks and the complementary targeted effects (CPTE) of the drug combination on different driver signaling network modules using the drug-induced gene expression profiles of the given drug combination. The sum of CTE and CPTE of a drug combination represents the total synergistic effects of that combination. Finally, we uncovered the potential synergistic mechanism of drug combinations by mapping drug pair-affected targets and off-targets back onto the driver disease signaling networks.
2.2 Drug off-target prediction based on drug–drug functional network
2.3 Drug combination prediction based on correlation analysis of the drug effects on driver signaling networks
2.3.1 Bayesian factor regression model for identifying pharmacological profiles of drugs
BFRM (Bayarri et al., 2003; Carvalho et al., 2008) has been applied to the prediction of drug sensitivity from the gene expression signatures of the network-module. It introduces the following model from to deconvolute the treatment transcriptional response matrix into a series of underlying signatures, where is an -dimensional vector of fold change (treatment versus control) of drug in the treatment response matrix; is the number of drugs and is the number of genes that we get from all driver signaling networks. is a sparse matrix whose columns define the gene signatures , and each numerical value defines the weight of gene j in the column of gene signature . reflects the measurement error and the residual biological noise in the response data. In addition, BFRM outputs a matrix , which quantifies the probability of how each gene is associated with each factor . To address which cancer signaling networks are responsible for the unknown pharmacologic mechanisms and to what extent they are targeted, we identified signatures associated with the targeted genes in the driver signaling networks. We defined a weight matrix (targeted gene signatures), (with if and if ) and an effect matrix with quantifies the effect of drug imposed on the gene signature, (Fig. 1B).
2.3.2 Driver signaling networks based drug-induced gene expression profiles
We defined a drug-induced gene expression profile on the derived driver signaling networks using and . Let characterizes the overall effects of drugs on signatures. We viewed the known drug–target interactions and predicted drug–target interactions as physical drug–target interactions. We defined the non-zero weights of the rows of the targets across signatures of drug as a targetable gene signature set . For each targetable gene signature, we defined the product between and the effect score as the overall effect of drug imposed on signature , , where denotes the response of the signature to the drug . For a gene signature that cannot be targeted by the drug , i.e. the weights of the tarts of drug across the signature are all 0, , . Therefore, for each driver signaling network, we obtained a drug-induced gene expression profile for the drug , , is the set of factors for the network .
2.3.3 Drug combination prediction based on driver signaling networks
3 Results
3.1 Performance on dream drug combination prediction challenge
We tested DrugComboExplorer using the NCI-Dream Drug Combination Prediction Challenge dataset that consists of transcriptomic profiles of OCI-LY3 B-lymphoma cells after treatment with each of fourteen drugs. The goal was to predict the treatment effects of pairwise combination of these 14 drugs (91 drug combinations totally) using genomic profiles before and after treatment with each drug. SSMG of 39 lymphoid neoplasm diffuse large B-cell lymphoma (DLBCL) patients from TCGA were identified by analyzing the whole-exome sequencing (WES) data using Mutsig (Lawrence et al., 2013) and the SCNVG of those DLBCL patients were detected by analyzing the SNP data using GISTIC (Mermel et al., 2011). The SSMG, SCNVG, and 24 key genes that have been reported highly correlated with DLBCL were used as potential driver genes (600 genes in total, see Supplementary Information S1 for details) for DLBCL. The overlapping genes between SSMG, SCNVG and OMIM key genes are marked in Supplementary Information S1. We applied NPBSA to RNA-seq profiles of 39 DLBCL samples and 33 normal DLBCL samples from TCGA, in which those 600 driver genes were selected to identify networks by integrating RNA-seq profiles with IHSCN to obtain 242 driver signaling networks. Then, we applied DrugComboExplorer to the gene expression profiles of OCI-LY3 cells treated with 14 drugs and the 242 driver signaling networks to prioritize the 91 drug combinations for DLBCL. The ranking was evaluated against an experimentally assessed gold standard generated by evaluating drug combination activity in OCI-LY3 cell viability assay. A modified version of the probability concordance index (PCI) (Harrell Frank et al., 1996) with its corresponding P-value was used to quantify the concordance between the ranking of compound pairs in the gold standard. See also Bansal et al. (2014) for details about how to compute the PCI between two ranked lists. Figure 2 shows that DrugComboExplorer outperforms Target Inhibition inference using Maximization and Minimization Averaging (TIMMA) (Tang et al., 2013), DIGRE [the best performing method included in the DREAM report (Yang et al., 2015)], SynGen (Bansal et al., 2014) and PCDE (Zhao et al., 2014) in terms of PCI (Fig. 2A) and the corresponding estimated P-value (Fig. 2B), which quantified the robustness of the PCI results. See Supplementary File S1 for details about how to estimate those P-values. Supplementary Table S1 lists the top 25 drug combinations predicted by DrugComboExplorer.
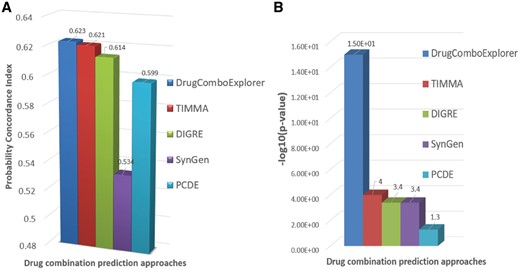
(A) Comparison results of different drug combination prediction results in terms of probability concordance index (PCI) on NCI-dream drug combination prediction challenge dataset. (B) The estimated P-value results of different drug combination prediction results for PCI
3.2 Testing on AR-positive and AR-negative prostate adenocarcinoma
We evaluated the prediction power of DrugComboExplorer on LNCaP and PC3 cells, two proxies of AR-positive and AR-negative prostate cancer patients. We collected the available RNA-seq data (Level 3) of LNCaP and PC3 cell lines from the gene expression omnibus. RNA-seq data from five LNCaP cell line samples (GSM1328163, GSM1329614, GSM1573658, GSM1573659 and GSM1573660) were used to retrieve all RNA-seq data of 498 PCa from TCGA. We computed the Pearson similarity among those 503 samples by combining the RNA-seq data of LNCaP and PC3 cells. Using the AP clustering algorithm, 237 patients were clustered together with those five LNCaP cell lines. The WES data (Level 3), the SNP data (Level 3) and the methylation data (Level 3) of those 237 PCa patients were downloaded from the TCGA data portal. SSMG were identified from the WES data using Mutsig (Lawrence et al., 2013) and SCNVG were detected from the SNP data using GISTIC (Mermel et al., 2011).
We combined SSMG and SCNVG with the PCa oncogenes from OMIM (Hamosh et al., 2005) as cancer driver genes (991 total genes and the overlapping genes are marked in Supplementary Information S1) of those 237 PCa patients. Next, we investigated driver LNCaP-represented PCa signaling networks by applying NPBSA to the RNA-seq data of those 237 PCa patient samples and 52 normal prostate samples from TCGA, the driver genes, and IHSCN. 991 driver genes served as initial driver networks and NPBSA grew each network by adding genes (from IHSCN) that increased its network score. 923 transcriptome-based driver signaling networks for LNCaP-represented PCa were identified by NPBSA. Then, we applied NPBSA on the methylation data of the same PCa patients to derive methylation-based driver signaling networks, using the same driver genes. 909 methylation-based driver signaling networks were obtained. We merged the transcriptome-based and methylation-based driver signaling networks derived from the same driver genes to obtain 964 total driver signaling networks. Due to overlapping genes among the 964 driver signaling networks, we used the AP clustering algorithm (Frey and Dueck, 2007) to cluster them into 278 driver signaling networks.
A co-expression network and a gene regulation network were generated, respectively, by applying the aggregated co-expression algorithm (see Section 2) and the SINERE algorithm on the RNA-seq data of those 237 LNCaP-represented PCa patients. These two networks were combined into 278 driver LNCaP-represented PCa signaling networks. If two genes of an edge exist in one of the 278 driver LNCaP-represented PCa signaling networks, this edge will be added to that driver signaling network. Finally, 278 driver LNCaP-represented PCa signaling networks with 6767 genes were obtained.
RNA-seq data from five PC3 cell line samples (GSM869036, GSM869042, GSM1678010, GSM1563053 and GSM1563054) were used to query all RNA-seq data of 498 PCa patients from TCGA and 118 metastatic castration-resistant prostate cancer patients from dbGaP database (phs000909.v.p1) (Beltran et al., 2016) to obtain the samples with similar gene expression patterns. One hundred TCGA patients were clustered together with those five PC3 cell lines. We combined SSMG and SCNVG with the oncogenes of PCa from the OMIM database (Hamosh et al., 2005) as driver genes (995 total genes and the overlapping genes are marked in Supplementary Information S1) of those 100 PCa patients. We identified 901 transcriptome-based and 703 methylation-based driver signaling networks for PC3-represented PCa. We merged the transcriptome-based and methylation-based driver signaling networks from the same driver genes to obtain 933 total driver signaling networks. We used the AP clustering algorithm to cluster them into 276 driver signaling networks. The co-expression network and the gene regulation network were combined into driver PC3-represented PCa signaling networks using the same strategy as with LNCaP to derive 276 driver PC3-represented PCa signaling networks with 6738 genes.
We then applied DrugComboExplorer to the 276 PC3-represented PCa driver signaling networks and gene expression profiles of PC3 cells treated with 3405 drugs or bioactive compounds from the LINCS project to predict effective drug combinations. We extracted the drug–drug similarity network from STITCH and clustered the drugs into 34 drug clusters using the AP algorithm (Frey and Dueck, 2007). Then, we extracted the transcriptional response matrixes for drugs within each cluster and decomposed them into weight matrixes and effect matrixes using BFRM. We extracted the drug-induced gene expression profiles on 276 PC3-represented PCa driver signaling networks using the weight matrixes and effect matrixes. By quantifying the CTE on the same driver PC3-represented PCa signaling networks and CPTE on different PC3-represented PCa driver signaling networks between the drug-induced gene expression profiles of combinations, the synergistic effects of a given drug combination are quantified as the summation of CTE and CPTE, and drug combinations with high synergistic effects were predicted to be the promising candidates. By applying DrugComboExplorer to the LNCaP-represented PCa driver signaling networks and gene expression data of LNCaP cell lines treated with 3011 drugs from the LINCS project, the effective drug combinations for LNCaP-represented PCa patients were predicted.
For PCa, our collaborating oncologists suggested ‘BORTEZOMIB’, ‘DASATINIB’, ‘DOCETAXEL’, ‘DOXORUBICIN’, ‘VINCRISTINE’ and ‘VORINOSTAT’ as anchor drugs. We tested those six drugs individually on LNCaP and PC3 cell viability and obtained sigmoid growth inhibition curves. To validate our drug combination predictions for LNCaP and PC3-represented PCa, the six base drugs and another 50 empirically selected drugs (each with 10 different doses, 4 replicates) were tested through cell viability assays (for details about in vitro drug combination screening, see Supplementary File S1, which also includes all the Supplementary figures and tables). The synergism or the antagonism of drug combinations was quantified by the synergy index (Knol et al., 2011). We used the concordance index between the predicted rank and the cell killing rank (ranked by synergy index) in the cell viability assays to judge the quality of the prediction, as well as the number of top predicted drug combinations with synergistic effects in vitro.
We compared the predicted results with TIMMA (Tang et al., 2013) and random combination prediction (RCM), i.e. randomly picking drugs from the available 5585 drug candidates to combine with those six designated drugs. Among the top 50 drug combinations predicted by DrugComboExplorer for LNCaP, 27 were identified as synergistic drug combinations in vitro with synergy index larger than 2.0, while the number was 19 in TIMMA and 4 in RCM among their 50 top predicted drug combinations (Fig. 3). Supplementary Table S2 lists those 27 drug combinations, their synergy scores predicted by DrugComboExplorer, and their synergy index. Figure 4A shows the comparison results in LNCaP in terms of concordance index results between DrugComboExplorer, TIMMA and RCM. For PC3 cells, among the 25 top-ranked drug combos by DrugComboExplorer, 6 were found to be synergistic in vitro, while the number was 2 in TIMMA, and 1 in RCM among their 25 top predicted drug combinations (Fig. 3). Supplementary Table S3 lists those six drug combinations. Figure 4B shows the comparison results in PC3 in terms of concordance index results among DrugComboExplorer, TIMMA and RCM. The ranks predicted by DrugComboExplorer were more consistent with in vitro rank than TIMMA and RCM. The prediction results on LNCaP and PC3 showed that DrugComboExplorer significantly outperforms TIMMA and RCM.
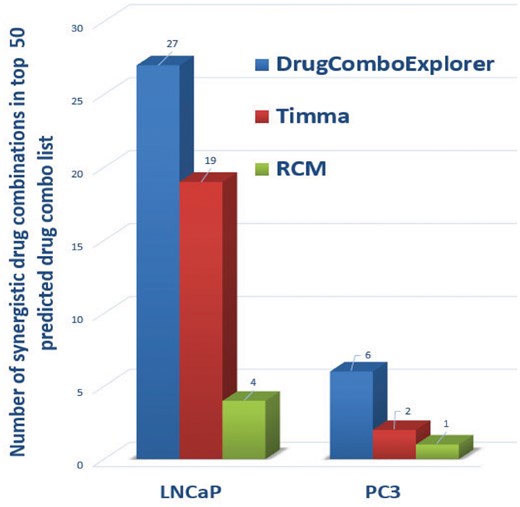
Comparison results on the number of top ranked predictions of drug combinations which are synergistic drug combos in vitro on LNCaP and PC3 cells
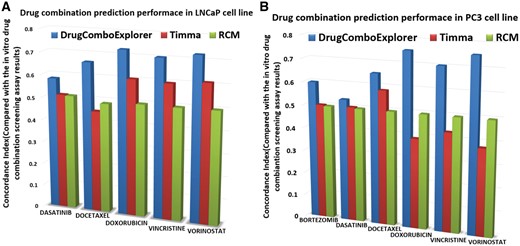
(A) Comparison results of the consistency between drug combination prediction results and the in vitro drug combination screening assay results on LNCaP cells; (B) comparison results of the consistency between drug combination prediction results and the in vitro drug combination screening assay results on PC3 cells
3.3 Mechanism of synergistic drug combinations
The dose response curves of elesclomol plus vincristine, elesclomol plus docetaxel, elesclomol plus doxorubicin are given in Supplementary Figure S1. These drug combinations showed synergistic effects on PC3 cell line and elesclomol in combination with docetaxel has been investigated in a clinical trial for prostate cancer (ClinicalTrials.gov ID: NCT00808418). Elesclomol plus vincristine showed higher synergistic effects on PC3 cells than elesclomol plus docetaxel. Supplementary Figure S2 shows the whole driver PC3-represented PCa signaling network (276 driver PC3-represented PCa signaling networks were merged together); the potential targets of elesclomol and vincristine are marked as big nodes. Green, yellow and red represent the reduced expression, non-significant differential expression and increased expression genes, respectively. Figure 5 shows the significantly mutated genes with big nodes in the driver PC3-represented PCa signaling network. We found elesclomol and vincristine combination increased the expression of certain genes, such as TUBB2A, CTNND2, P4HB, CDK3 and NEK2, and reduced the expression of others, such as FHL2, which is related to the androgen receptor signaling pathway, ETS1, KRT15 and ITGA3. A mutated and downregulated gene SELP and its related IL-8 signaling are also affected by this drug combination. The top enriched signaling pathways of the upregulated and downregulated genes with the PC3-derived signaling network are the ERK signaling, mTOR signaling, NF-kB signaling and PI3K/AKT signaling (Supplementary Table S4).
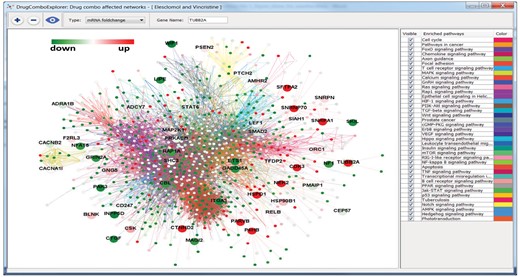
The whole driver PC3-represented PCa signaling pathway. Big nodes are the targets of synergistic drug combo, Elesclomol and Vincristine. The green nodes and red nodes are down and up regulated genes, respectively, and the yellow nodes are genes with non-significant differential expressions
Supplementary Figure S3 shows the whole driver LNCaP-represented PCa signaling network (278 driver LNCaP-represented PCa signaling networks were merged together); the potential targets of mepacrine and doxorubicin are marked as big nodes. Supplementary Figure S4 shows the significantly mutated genes in the whole driver LNCaP-represented PCa signaling network. We found this drug combination affects certain upregulated genes, such as MMP9, SPP1, THBS2 and GDF15, and downregulated genes, such as FHL2, FGF7, VAV3, SERPINB5 and ATF3. Interestingly, MMP9 and FGF7 were also mutated genes and have been reported to be associated with metastatic prostate cancer invasion (Aalinkeel, 2011; London et al., 2003). The top enriched signaling pathways of the up- and down-regulated genes with the LNCaP-derived signaling network were ILK signaling, IL-8 signaling, VEGF signaling, ERK/MAPK signaling and PTEN signaling pathways (Supplementary Table S5). Interestingly, elescolmol and vincristine did not show synergistic effects on LNCaP cells in vitro, while mepacrine and doxorubicin showed an antagonistic effect on PC3 cells in vitro. These results suggest crosstalk commonly exists between cancer survival pathways and that DrugComboExplorer can be used to uncover the underlying mechanism of synergistic action of drug combinations.
4 Discussion
Repositioning FDA-approved or investigational drugs in combination for specific subtypes of cancer presents an attractive strategy to speed drug discovery. Additionally, it is believed that drug combinations can achieve greater efficacy than the sum of their constituent parts, as the complexity of multiple regulatory pathways is a principal barrier to innovative cancer therapy (Podolsky and Greene, 2011). Crosstalk between effector signaling pathways is another critical aspect of tumor signaling transduction pathways that allows cancer cells to survive and acquire resistance to targeted therapy and personalized treatment, rendering the given treatment strategy ineffective. Optimal drug combinations targeting a cancer patient’s alternative driver signaling networks, especially the crosstalk between networks, is predicted to better combat resistance progression encountered in chemotherapy or targeted therapy.
We developed DrugComboExplorer, a novel computational systems biology tool from the concept of using networks as a biomarker to predict synergistic drug combinations by evaluating combinatorial drug-induced targeting effects on alternative and complementary driver signaling pathways. Our working principle is that synergistic drug combinations should have similar targeted effects on the same signaling pathways and CPTE on parallel or alternative signaling pathways.
We first employed the NPBSA algorithm to concurrently analyze multi-genomic profiling of certain subtypes of cancers for the identification of robust driver signaling networks with high statistical confidence level. There are three advantages here. First, shifting from identification of driver oncogene-markers to driver signaling network-markers helps us to interpret heterogeneous and noisy genomic mutation profiles. Second, driver signaling pathways containing gene mutations and changes in DNA methylation, gene copy number and mRNA expression levels are likely to play important roles in tumor progression. Third, this overcomes the deficiency of analyzing only a specific genomic space and increases the confidence of our results. For rare cancers such as osteosarcoma or medulloblastoma, this novel bootstrapping strategy provides an effective way to estimate the robustness of identified driver disease signaling networks under the constraints of limited sample size.
Next, we believe drugs with similar modes of action will induce similar perturbation patterns on gene expression. We clustered the drugs that were used on a specific cancer cell line into drug functional modules. We decomposed the transcriptional responses of each drug functional module into a weight matrix and an effect matrix. We extracted the drug-induced effect profile of each drug on those identified driver signaling pathways according to these two matrixes. After quantifying CTE and CPTE on driver signaling networks for a drug combination, the synergistic effects of the drug combination are quantified as the summation of CTE and CPTE. Drug combinations that target parallel or neighboring driver signaling networks, hub nodes and the crosstalk genes are hypothesized to have high synergy.
Mapping drug targets and off-targets back onto the driver signaling networks can reveal the potential mechanisms of action of drugs’ synergistic effects. DrugComboExplorer provides insight regarding which driver signaling pathways that a specific drug combination should target. In this study, we used the genomics data of a specific cell line as a proxy for a specific cancer patient. Predicted drug combinations were then experimentally validated on this cell line. DrugComboExplorer could also be applied for a specific cancer patient to suggest personalized drug combinations and thus open up a vista to aid clinical researchers and drug developers in deriving more efficient treatment plans for individual patients. We are investigating this option as on-going research.
Acknowledgements
The authors would like to thank Dr Fuhai Li of Washington University in St Louis, Dr Jinwen Ma of Peking University and the members of Cancer Systems Biology Lab of the Department of Systems Medicine and Bioengineering at Houston Methodist for their helpful discussions. We would like to thank Dr. Rebecca Danforth and David Spence for proofreading the draft.
Funding
This work is supported by Cancer Prevention and Research Institute of Texas RP110532 and National Institute of Health U01CA188388 and U54CA149196, Ting Tsung and Wei Fong Chao Foundation, and John S Dunn Research Foundation to S.T.C.W., and National Institute of Health R01CA211861 and American Cancer Society RSG-13–061–01-TBE to B.H.
Conflict of Interest: none declared.
References

