


Abstract
The resistance of bacterial pathogens to antibiotics is one of the most important issues of modern health care. The human microbiota can accumulate resistance determinants and transfer them to pathogenic microbiota by means of horizontal gene transfer. Thus, it is important to develop methods of prediction and monitoring of antibiotics resistance in human populations.
We present the agent-based VERA model, which allows simulation of the spread of pathogens, including the possible horizontal transfer of resistance determinants from a commensal microbiota community. The model considers the opportunity of residents to stay in the town or in a medical institution, have incorrect self-treatment, treatment with several antibiotics types and transfer and accumulation of resistance determinants from commensal microorganism to a pathogen. In this model, we have also created an assessment of optimum observation frequency of infection spread among the population. Investigating model behavior, we show a number of non-linear dependencies, including the exponential nature of the dependence of the total number of those infected on the average resistance of a pathogen. As the model infection, we chose infection with Shigella spp., though it could be applied to a wide range of other pathogens.
Source code and binaries VERA and VERA.viewer are freely available for download at github.com/lpenguin/microbiota-resistome. The code is written in Java, JavaScript and R for Linux platform.
Supplementary data are available at Bioinformatics online.
1 Introduction
Increase in mortality from pathogens resistant to antibacterial substances is currently one of the most important problems of modern health care. According to the report in Review on Antimicrobial Resistance, chaired by Jim O’Neill (O’Neill, 2016), annual mortality from infections complicated by antibiotics resistance (AR) is estimated at 700 000. By 2050, it is predicted that mortality will reach 10 million, and economic losses will reach 100 trillion US dollars (O’Neill, 2016). The major factor promoting the spread of resistance is the wide use of antibiotics in medicine and agriculture (Rhouma et al., 2016; Rolain, 2013). This includes such factors as misuse of antibiotics by people, insufficient control of turnover of the medicines containing antibiotics, uncontrolled use of these medicines in agriculture and other reasons (Liu et al., 2016; Nguyen et al., 2016; Osterberg et al., 2016; Rhouma et al., 2016). Accumulation of AR by human microbiota commensals and transfer of AR-determinants to pathogens by means of HGT could complicate this problem further (Sommer et al., 2009).
Thus, there is a need for development of instruments for monitoring and prediction of the spread of infections to human populations taking into account the above-mentioned factors. It is important to use modern methods of functional genomics, next-generation sequencing and modern computational methods, including computer modeling, alone and in combination.
Mathematical and computer models help to investigate and predict the behavior of various complex systems including systems that are biological in nature (Eubank et al., 2004; Pitman et al., 2012). Such models have already been applied for studying the spread of AR (Fofana et al., 2017; Spicknall et al., 2013; Weinstein et al., 2001). Models exist which consider the problem of AR pathogens in hospitals (Austin et al., 1999; D’Agata et al., 2007; Webb et al., 2005). Other models consider the use of several antibiotics (Cohen and Murray, 2004). The majority of models are based on the use of differential equations (Colizza et al., 2007; Kaufman et al., 2009; Lipsitch et al., 2000; Spicknall et al., 2013; Van Bunnik and Woolhouse, 2017). However, it was noted that agent-based modeling is more suited to model infectious diseases (Willem et al., 2015). We are not aware of any existing models which take into account accumulation and transmission of AR-determinants in microbiota.
We present herein a tool—the agent-based model VERA–which simulates accumulation and spread of pathogen resistance among the population. It can be useful for the assessment of an epidemiological state either in some location (i.e. a city, town, village, etc.) or in various institutions (e.g. kindergarten). People, which are referred to herein as agents, can be placed nominally in the town or in the hospital, and in various states: healthy, with infection in an incubation period, with infection in an active phase. Agents’ microbiota accumulates AR-determinants and transfers them to the pathogen, which could then be transferred to other agents. An optimal monitoring frequency is derived based on minimization of functional cost. The result of simulation is a detailed log of state transitions. Also, a number of statistics can be visualized in a PDF report or displayed through a local web page.
2 Materials and methods
2.1 Model description
Agents are people who can be localized in a town or in a hospital. An agent can catch a pathogen and change state from healthy to a state of infected in incubation period. After the end of the incubation period, the agent transitions to the infection state with resistant or sensitive pathogen until she/he is cured, either at home or in a hospital. While being treated at home, the agent takes Antibiotic-1 either correctly or in a non-optimal regime (i.e. either reducing the dose or ceasing the treatment). Incorrect home treatment causes the pathogen to become resistant to Antibiotic-1. Patients are treated with the other antibiotic (Antibiotic-2) in the hospital. We assume that there is no formation of Antibiotic-2 resistance. Agents can be hospitalized for reasons other than the pathogen under consideration, and they can then become infected there. A modeling time unit is 1 day.
2.1.1 Model of microbiota resistance formation and its transfer to a pathogen
A pathogen can be in one of two states: resistant to one of the antibiotics (Antibiotic-1) or sensitive to it. Each agent in our model has his/her own level of microbiota resistance, which increases during the process of using Antibiotic-1. Also, there is a permanent (or, at least, persistent) increase in Antibiotic-1 resistance (i.e. by food consumption with subtherapeutic Antibiotic-1 doses (Moore et al., 2013; Pehrsson et al., 2016; Hoang et al., 2017) until it reaches some level (i.e. ‘no resistance’ and ‘the microbiota has attained the greatest level of AR that is possible’). It is assumed that patients without heavy infection symptoms are treated at home with Antibiotic-1, where the AR-formation by means of horizontal gene transfer (HGT) through plasmids/transposons is possible (Levy and Marshall, 2004; von Wintersdorff et al., 2016). The patients in the hospital are assumed to be treated with the other antibiotic (Antibiotic-2). We assume that formation of Antibiotic-2 resistance by means of plasmids/transposons transfer bearing AR-determinants is improbable. With each step in the simulation, the microbiota of each patient taking Antibiotic-1 increases resistance by otherwise it decreases by . At each step, we count the average microbiota resistance level to Antibiotic-1, rm, and average pathogen resistance, rp.
The probability that the healthy agent will be infected with a pathogen and that that pathogen will become resistant corresponds to the Bernoulli random distribution magnitude, with the probability of success of p2 and rt accordingly.
It is possible that a pathogen will gain resistance to Antibiotic-1 with probability p7. If the pathogen acquired resistance, the probability of being hospitalized for treatment increases to , where p3 is the probability of hospitalization with antibiotic sensitive pathogen from home treatment, and rc characterizes the ease of the pathogen to acquire AR-determinants. There is also a probability that an agent who is a Non-Infected person in the hospital will catch a sensitive pathogen p6, and there is a random Bernoulli distribution magnitude with probability rh of catching a resistant pathogen.
2.1.2 Model of antibiotic resistance spread and agent transmission dependences
Agents change their states consistent with probabilities and have variable microbiota resistance levels. Probability to catch the pathogen p2 is defined dynamically in every moment of modeling and is proportional to the number of infected people in town divided by the total number of people in town (see Supplementary Table S1). We assume that the treatment course in the hospital is chosen in such a way that provides recovery of the patient without AR-formation. A modeling time unit is 1 day. In the conditions of treatment (except for treatment in the hospital) the resistance increases by every day with the taking of antibiotics and, on the contrary, decreases when the taking of antibiotics stops, at , until it reaches a constant level rl.
All probabilities of transitions have Bernoulli distributions with the appropriate probability of success (see Supplementary Table S1). Transitions from one state to another are experienced by agents at each time point of modeling, according to the following rules. Agents can be in one of a number of states which differ in location (town or hospital) and the status of infection. They are: the healthy person (Healthy person), the person who was admitted to the hospital not because of infection with the pathogen under consideration (Non-Infected person in hospital), the person in incubation period (Person in incubation period), the person who is under treatment at home with the recommended treatment period of antibiotics (Person in antibiotic treatment period), the person who is under treatment at home with a reduced treatment period of antibiotics (Person in antibiotic incorrect treatment period), the person infected with the current pathogen and who is on treatment in hospital (Infected person in hospital) and the person in the incubation period with a resistant pathogen after the incorrect treatment (Person in incubation period 2). Transitions are possible at every moment of modeling. The short descriptions of the states used in modeling are given below. The workflow of the VERA is presented in Figure 1.
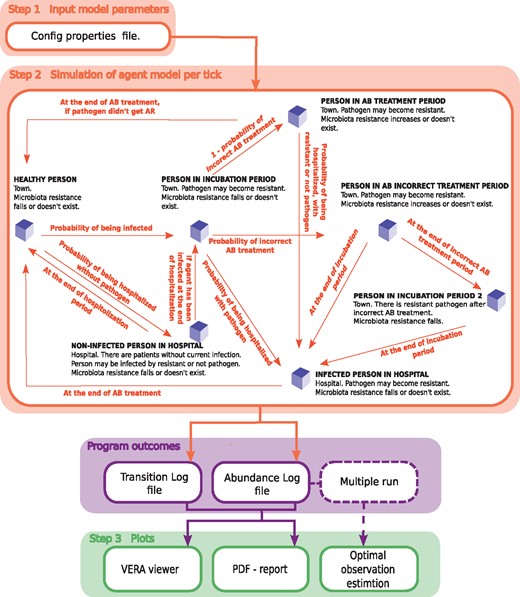
The workflow of the VERA model. Step 1—set input parameters; step 2—start simulation to get: a table with the number of agents in each state at each time point of modeling (abundance log file), and a file with transitions of each agent (transition log file); step 3—dynamic visualization, a PDF report is generated and optimal frequency of observations is calculated. AR=antibiotic resistance; AB=antibiotic. Agents’ transitions between states are carried out according to the following rules (see Supplementary Table S2)
Healthy person. A person located in the town without pathogen infection. The agent can get into the state Non-Infected person in hospital with the possibility p1 or into Person in incubation period with possibility p2.
Non-Infected person in hospital. People admitted to the hospital, not because of infection with a target pathogen. Agents can get to this state only from the state Healthy person. The intestinal microbiota AR of the person is reduced by , as it is assumed that there is no treatment with the specific antibiotic. After treatment period ip, the agent passes back into Healthy person or, with possibility p6, is infected with a pathogen and transitions to state Person in incubation period, with probability p9 to catch a resistant pathogen.
Person in incubation period. An agent who was infected by a pathogen and with infection in the incubation period. The pathogen can become resistant with the possibility p7. The incubation period should be defined in input parameters to match the pathogen under consideration. When the incubation period is expired, the person can pass into a state Infected person in hospital with possibility p3, or be treated at home non-optimally (state Person in antibiotic incorrect treatment period) with possibility of p8, or optimally (Person in antibiotic treatment period) with probability .
Person in incubation period 2. A person gets to this state after the incorrect treatment, and the pathogen is assumed to be resistant. As soon as the incubation period ends, agents are hospitalized (state Infected person in hospital).
Infected person in hospital. Agents receive treatment in the hospital. The microbiota resistance decreases according to because of change of the antibiotic to the other one (Antibiotic-2), where there is no AR through horizontal genes transfer. After the treatment completion, the agent passes into the state Healthy person.
Person in antibiotic incorrect treatment period. In this state, the agents’ pathogen can become resistant, p7. During the treatment at home, with the possibility of p4 or p5 the agent can be hospitalized for treatment (state Infected person in hospital). If after the end of the therapy the agent was not hospitalized, he passes into a state Person in incubation period 2.
Person in antibiotic treatment period. On any day of treatment, agents can be hospitalized with possibility of p4 or p5 and, also, upon completion of the treatment period (in a state Infected person in hospital), if the pathogen became resistant. And if not, then with a certain level of microbiota resistance the agent passes into the state Healthy person.
2.2 Estimating the optimal frequency of observation
Here serves as the measurement rate, and σ is the error rate. To determine the optimal intensity of observations, it is necessary to solve the minimizing problem for the objective function (1) , where is the desired optimal observation intensity (OOI). The estimationReportRUN.sh script implements this task and determines the OOI (Supplementary Fig. S1, 500 runs with 100-day simulation). By default, the error rate σ is set according to the Centers for Disease Control and Prevention data on the number of infections and deaths associated with AR, as .
2.3 Parameter estimation for pathogens
Shigellosis is a widespread disease in places of public catering, day-care centers, etc. Here we investigate Shigella spp. as a model pathogen. Details for this see in Supplementary Notes 1 and Supplementary Tables S3 and S4.
Cholera outbreak has occurred in Yemen up to now, and we decided to check our model on this case. Details of the parameters selection are in Supplementary Notes 2.
Also we added table with values of pathogen susceptibility to receive antibiotic resistance (Supplementary Table S7) for ESKAPE pathogens (Enterococcus faecium, Staphylococcus aureus, Klebsiella pneumoniae, Acinetobacter baumannii, Pseudomonas aeruginosa and Enterobacter species).
There is the additional option to investigate an infection spread in terms of multidrug resistance (Supplementary Notes 3).
2.4 Results
2.4.1 Qualitative analysis of the model
We obtained multiple launches (500 runs) of the VERA model with the same input parameters, and estimated the scale of changes in the four main model indicators: the number of infected people, the probability of being infected, the average level of microbiota resistance and the pathogen resistance. This procedure allowed assessment of the model results’ stability relative to the probability transitions. The results are shown in Figure 2.
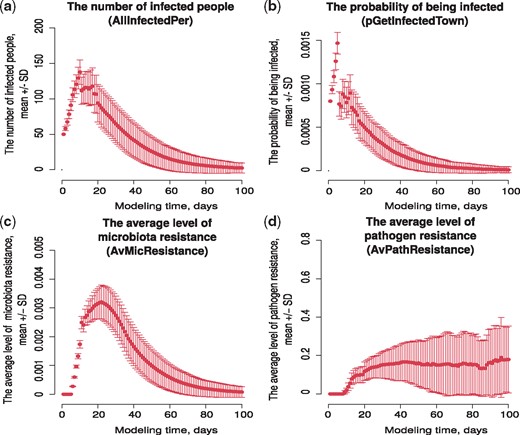
Results of the model stability assessment. The average of 500 runs relative to each simulation time point with standard deviation. (a) The number of infected people (column name AllInfectedPer in output table), (b) the probability of being infected p2 (column name pGetInfectedTown in output table), (c) the average level of microbiota resistance rm (column name AvMicResistance in output table) and (d) the average level of pathogen resistance rp (column name AvPathResistance in output table)
It is seen that the values of the indicators for multiple launches of the model with the same values of the input parameters differ from the mean with some deviation. In the case of the indicator ‘The number of infected people’, the maximum value of the standard deviation from the mean for multiple launches is explained by the data kind, here this number of people, with a size of 10 000 people. The obtained set of data allows us to state that this model is fairly stable and the observed spread of the values of the main parameters does not cause a change in the behavior of the model.
2.4.2 Parameter grid
To investigate under what initial conditions there are transitions from a low infection rate to a pandemic and assumptions of the interrelation nature (or relationship type) of input parameters, a regression analysis of multiple model launches was conducted. To define the model state, we will use the values of the simulation indicators. Indicators in the VERA model are (i) the number of infected people, (ii) the probability of being infected, (iii) the average level of microbiota resistance and (iv) the pathogen resistance. As an indicator assessment during the entire modeling period, the area under its (indicator) curve was determined—the larger the area at a certain start-up, the higher the index under selected input parameters.
Linear regression was constructed based on the results of 105 runnings of the VERA model, where the simulation time was 300 days. To execute each such launch, a config.properties file was generated with the values of the input parameters, which were randomly selected from the appropriate allowable ranges (see Supplementary Table S5). To calculate the linear regression, the values vector for indicator was taken as the dependent variable, and the free variables were the values of the input parameters. The parameters whose contribution to the indicator change were the most significant (the value of the regression coefficients) were selected as significant for this indicator (see Supplementary Table S6 for regression results and statistical significance) and were depicted in Figure 3.
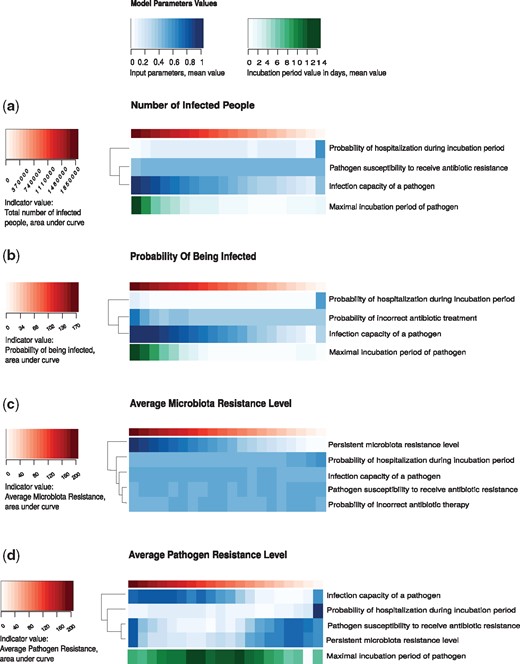
Parameter grid. Heatmap of the model indicator values depending on the control parameter values. There are the input parameters as the control parameters, which make the most significant contribution to changes in indicator values, according to regression analysis (see Supplementary Table S6)
It turned out that the pathogen infection potential ic has a significant effect on all model indicator values. Among the other parameters, the control parameters were: the incubation period ip, the probability of incorrect antibiotic treatment p8, the pathogen susceptibility to receive AR rc (the potential of AR accepting a pathogen, how much it is susceptible to the reception of AR genes), the permanent level of gut AR rl, the probability of being hospitalized during incubation period p3.
Thus, using a grid of parameters for model indicators, it is possible to predict the pandemic degree in the prognosis for 300 days based on the parameter values. Also, a grid of parameters revealed the relation type of input parameters. The analysis has established that a permanent level of gut AR of agents affects only the average resistance of the microbiota and pathogen. The increased probability of incorrect antibiotic treatment leads to an increased probability of being infected in the town.
2.4.3 Model indicator dependencies
The main model indicator is the number of infected agents (and this value is most easily estimated in practice). Model indicators are interdependent, so we determined the dependence of the estimated pandemic state on the number of infected agents and other indicators. It turned out that, in the case of probability of being infected, the dependence is logarithmic (Fig. 4a). With an increase in the probability of being infected p2, a rapid increase in the number of infected people and a transition to saturation are observed. That means saturation does not occur as quickly as growth in the number of infected people. The relation between the number of infected agents and the average level of pathogen resistance is characterized by an exponential dependence (Fig. 4b). Critical values of the infection incidence are achieved only with a high proportion of resistant strains on average, and any restriction on the growth of the infection incidence does not have any noticeable effect. It can be assumed that this pattern is due to home treatment, which does not have the proper effect against resistant pathogens.
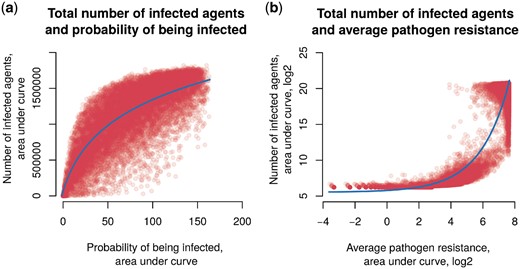
The scatter plot of the number of infected agents and other model indicators. (a) The probability to be infected p2. Data were fitted by a logarithmic function (continuous line). (b) The average level of pathogen resistance rp, along the axes of log2 values . Data were fitted by an exponential function (continuous line)
2.4.4 Demonstration of the model using Shigella spp.
To demonstrate the work of VERA on the model infection, we chose shigellosis (infection with Shigella spp.). The values of the input parameters were derived from the literature (Supplementary Table S3). We consider that Antibiotic-1 is co-trimoxazole same, Antibiotic-2 is from groups of fluoroquinolone or nitrofuran.
In the case of Shigella spp. using the simulations of our model to develop an effective treatment strategy, the following recommendations can be made. It was found that the OOI of the epidemiological situation development is 2 days (see Supplementary Fig. S1).
After multiple model runs, it can be concluded that the pandemic is falling by median for 80 days (see Supplementary Fig. S3). Also seen is the second possible scenario, when during the development of infection we have two peaks of a pandemic. For example, as seen from one of the simulations (see Supplementary Fig. S2), the first peak is observed on day 65, the second at 167, after a fall of 134 days. In this instance, the number of cases was close to zero at 236 days. This behavior is explained by the increased number of people who chose the incorrect treatment (R = 0.865, the Spearman’s rank correlation coefficient) and as a result of an increase in the average level of resistance of the microbiota and pathogen. At the time of the second peak, the resistance of the pathogen begins to reach the full saturation level. This explains that the number of infected agents begins to decline, so as only treatment in the hospital will be effective.
3 Discussion
The spread of the bacterial AR-determinants to antibiotics has occurred over a long time (D’Costa et al., 2011; Perron et al., 2015), and it is not in itself a threat. However, our intensive use of antibiotics leads to the positive selection of bacteria harboring resistance determinants, and its spread by HGT between different microbes further complicates the situation. Such events of determinant transfer were detected in patients after antibacterial therapy (Crémet et al., 2012; Karami et al., 2007) and were confirmed experimentally in animals and healthy donors (Lester et al., 2004, 2006). Cases of spread of pathogens that received resistant genes from the intestinal microbiota have been reported (Crémet et al., 2012; Goren et al., 2010). Thus, the intestinal microbiota is an important reservoir of AR genes, open to infectious agents of socially significant diseases (Jernberg et al., 2010). At the moment, various approaches have been applied to study and monitor AR using molecular biology, biochemistry and high-throughput sequencing techniques; modeling approaches to the epidemiological process have also been developed. However, there is a need to study the capabilities of the mathematical apparatus for predicting and simulating the spread of AR within the spread of infectious agents in the population, which can substantially supplement and expand the possibilities of existing research methods.
Different approaches have been developed to predict and simulate the resistance of individual infectious agents and microbiota. The most frequent approach to epidemiological simulation is a differential equations-based method. However, as noted above, to study a complex disease behavior and to develop a strategy for intervention, agent-based models are more appropriate.
We created a model for the spread of an infection caused by a pathogen, taking into account the possible gain of AR-determinants. In our model, there are two states of pathogens: sensitive to treatment and resistant. Our agents could be in several states: healthy; in the incubation period; taking antibiotic therapy at home; taking antibiotic therapy in the hospital; being treated in the hospital for another reason, not infection. Changes in agents’ states occur according to the corresponding probabilities, which are calculated dynamically. There is also a variable level of agents’ microbiota resistance level, which accumulates through antibiotic therapy and consumption of products containing antibiotics. In the home treatment state, it is likely that the patient will choose the incorrect treatment (reducing the dose or cessation of treatment). At each point in time, modeling assesses the degree of resistance of the pathogen in the town on average, which affects the probability of infection with a pathogen in the next step.
During the regression analysis, the following parameters were identified as being control: the pathogen infection potential ic, the incubation period ip, the probability of incorrect antibiotic treatment p8, the pathogen susceptibility to receive AR rc, the persistent level of gut antibiotic resistance rl and the probability of being hospitalized during the incubation period p3. An incremental increase of the incubation period ip, the pathogen infection potential ic and the probability of incorrect antibiotic treatment p8 leads to growing the number of infected people and the probability of being infected (Fig. 3). Obviously, only the latter, p8, can be controlled. The main tool here is public education, the promotion of ‘responsible self-treatment’ (link) and the availability of well-designed recommendations. Our results suggest that the main contribution to the growth of the average human microbiota resistance level is made by the increase in the persistent level rl of gut AR in the population (Fig. 3). It is formed by consuming subtherapeutic doses of antibiotic in food, consuming water treated with antibiotic and incorrect treatment. Clearly, monitoring the quality of agricultural products and checking for the antibiotic presence will help cope with this problem and reduce the unintended consumption of antibiotic. In the case of an average pathogen resistance level, the high incubation period ip and the combination of the pathogen AR acceptance potential rc with the persistent level of gut AR rl are evidenced, which leads to increased values of the model indicators (Fig. 3). The most important characteristics that make the biggest contribution to changes in infection spread are the pathogen infection potential ic, incubation period ip, and the probability of incorrect antibiotic treatment p8. These parameters affect all four indicators of the model (the number of infected people, the probability of being infected, the average microbiota resistance level and the average pathogen resistance level). The effect of the incubation period ip and the infection potential ic seems completely logical and does not contradict modern data (Horn and Lake, 2013; Leclerc et al., 2014; Salje et al., 2016). In general, there are two points of view regarding the dose of the antibacterial drug taken. The first considers that stopping the course of an antibiotic earlier than the standard treatment time is a safe and effective way to avoid excessive use of antibiotics in many situations (Horne et al., 2013; Llewelyn et al., 2017). Others insist it is necessary to take antibiotic all the prescribed course (Bassetti et al., 2015; Tepekule et al., 2017). The study of the VERA model showed that the probability of incorrect treatment p8 (non-compliance with the prescribed course of taking antibiotic) positively affects the indicators. The microbiota resistance and pathogen resistance increase is also influenced by the persistent level of antibiotic resistance rl of the agents’ gut microbiota (accumulated through consumption of food treated with antibiotic) (Founou et al., 2016; Hoang et al., 2017; Moore et al., 2013). Thus, based on our model, it can be concluded that the excessive consumption of antibacterial drugs (here, improper therapy and consumption of food processed with antibiotic) leads to the accumulation of AR microbiota, the spread of AR and to the complicated control of the epidemiological situation of this infection.
According to the analysis of the relationship of indicators among themselves, the number of infected agents depends exponentially on the high proportion of resistant pathogens (Fig. 4b). This could be very important because of catastrophic effects of even a small increase in the average pathogen resistance. Since the resistance of pathogens could be investigated, it is important to constantly monitor AR. It is desirable to put into practice the control of the resistance of microorganisms in the main public places of the town. Such information could lead to a change in the treatment protocols for pathogenic infections in a timely manner and not allow catastrophic consequences.
We studied the model using the example of shigellosis. The choice of shigellosis was dictated by two factors. The first is the ease of distribution in children’s institutions, in places of public catering, in hospitals, etc. (Kimball et al., 1980; Mani et al., 2016; Sack, 2001; Self et al., 2017; Valero et al., 2016). Centers for Disease Control and Prevention in its report notes 7638 cases of infection in the USA in 2013. In 2014, the incidence rate is 6.5 cases per 100 000 people. The second factor is that Shigella spp. are very prone to acquiring AR, which can add complications to patients (Keusch, 2009; Sack, 2001). In 2017, World Health Organization (WHO) published a report, which included Shigella spp. in the list of pathogens that needs development of new antibiotic (World Health Organization, 2017). It is known that shigellosis is most active at times of the year corresponding to massive international travel, namely, summer, autumn and holidays. It is believed that drug resistance outbreaks appear in the USA at these times (Sack, 2001). Also based on data about cholera outbreak in Yemen from April 27 to June 12, 2017 by WHO, we compared results after multiple runs of the model for Vibrio cholerae and real cholera cases. We see high correlation between simulated data and data from report (R = 0.895, the Spearman’s rank correlation coefficient, Supplementary Fig. S4).
In our model there are a number of limitations:
We do not consider a lethal outcome.
The hospital’s capacity is equal to the population size.
AR is acquired only through horizontal genes transfer.
Treatment in the hospital does not lead to acquiring AR; moreover, it decreases to some constant value.
Also in our model, seasonality is not taken into account. However, this may be an advantage, because it could lower the noise associated with additional factors, like the time of year. With the development of next-generation sequencing technology and the generation of an increasing number of metagenomic samples, it is possible to improve the accuracy of the model, modifying it to produce more accurate results.
An important characteristic of the model is the combination of factors of possible improper treatment and the formation of a permanent level of AR intestinal microbiota. The advantage of this model lies in the ease of generating data on the development of AR and the pandemic of the bacterial pathogen with varying input parameters. Such real-world data is often not available. Simulations using models like VERA could be useful in predicting the development of the epidemiological situation associated with the spread of infection due to the pathogen. The feature for assessing an optimal observation frequency could also be effective for choosing an optimal duration of quarantine, e.g. in children’s institutions. For illustration purposes, we also implemented a visualization tool which shows model behavior dynamically and as a PDF report.
Funding
This model development was supported by the Russian Scientific Foundation [grant 15-14-00066].
Conflict of Interest: none declared.
References
World Health Organization. (

