


Abstract
Detection of somatic copy number alterations (SCNAs) using high-throughput sequencing has become popular because of rapid developments in sequencing technology. Existing methods do not perform well in calling SCNAs for the unstable tumor genomes.
We developed a new method, DEFOR, to detect SCNAs in tumor samples from exome-sequencing data. The evaluation showed that DEFOR has a higher accuracy for SCNA detection from exome sequencing compared with the five existing tools. This advantage is especially apparent in unstable tumor genomes with a large proportion of SCNAs.
DEFOR is available at https://github.com/drzh/defor.
Supplementary data are available at Bioinformatics online.
1 Introduction
Somatic copy number alteration (SCNA) is the change in copy number that arises in somatic cells. SCNAs have been observed frequently in tumors (Zack et al., 2013), and recurrent SCNAs have also been identified in several types of tumors (Hieronymus et al., 2014). SCNA detection plays an important role in studying the mechanisms of tumor development and in guiding therapeutics. In recent years, SCNA detection using high-throughput sequencing has become popular because of rapid developments in sequencing technology.
Although several bioinformatics methods have been developed for SCNA detection using exome-sequencing data (Abyzov et al., 2011; Chen et al., 2015; Klambauer et al., 2012; Koboldt et al., 2012; Talevich et al., 2016; Xie and Tammi, 2009), these methods rely on a strong assumption that the median or mean value of the copy numbers of the genome is 2 (normal status). This assumption is generally used to give an estimation of the depth or depth ratio that represents the normal status. The assumption usually holds for germline copy number variations, because most parts of the genome do not have copy number changes. However, the assumption may not hold in tumor cells where large-scale copy number alterations were observed frequently (Zack et al., 2013). In such situations, the mean or median value of copy numbers across the genome may be not 2, and so the copy number estimate based on that assumption would be no longer reliable. Therefore, existing methods may not perform well in calling SCNAs for the unstable tumor genomes. Samples from tumor tissue are usually contaminated with normal cells from nearby normal tissue, and the purity of different tumor samples varies substantially (Aran et al., 2015). Because the purity of the tumor sample affects the observed copy number (Carter et al., 2012), it adds another layer of variations in SCNA detection of tumor samples.
We developed a new method, DEFOR, to detect SCNAs in tumor samples from exome-sequencing data. DEFOR supports the estimation of copy numbers in six different statuses and adopts a model considering allele frequency, depth and purity (Supplementary Table S1). The performance of DEFOR is outstanding compared with the other five existing methods in the evaluation, even for unstable tumor genomes with a larger proportion of SCNAs.
2 Materials and methods
SCNAs in tumor cells are very complicated, and the six most common statuses are considered in the model: (i) normal status, (ii) loss of both alleles, (iii) loss of one allele, (iv) loss of one allele followed by amplification of the remained allele, (v) gain of one allele and (vi) gain of both alleles. These statuses can be distinguished by allele frequency and depth, when there are no polyploidy events. In five of these statuses, the purity of the tumor cells affects the allele frequencies, so purity was also build into the model (Supplementary Table S1).
Allele frequency is estimated for each genomic location, and then the genome is segmented into blocks according to the allele frequency distribution. The depth ratio between tumor and normal pair is estimated using a sliding window across the genome. Based on the allele frequency blocks and depth ratio distribution in each block, candidate normal regions (with a copy number of two) are selected. Depth ratios are adjusted according to GC content. Then the median value of GC-adjusted depth ratios in candidate normal regions was chosen as the standard depth ratio that represents the normal copy number status. All GC-adjusted depth ratios are normalized based on the standard depth ratio to get the final estimation of the copy number for each genomic region (Fig. 1a and Supplementary Material). DEFOR reports the copy numbers and events (one of the six statuses) in different regions (Fig. 1b).
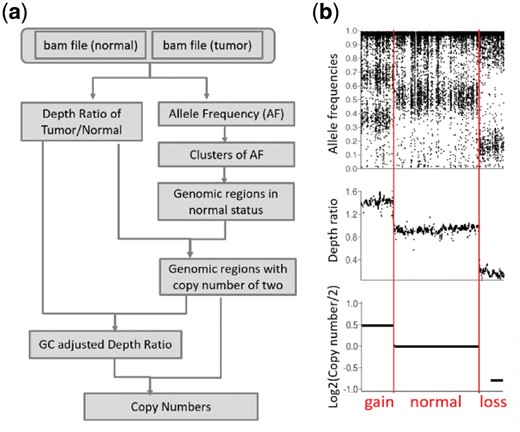
(a) The pipeline of DEFOR. (b) Allele frequencies, depth ratios and the copy numbers estimated by DEFOR in chromosome 2 of T164T tumor samples. Based on the patterns of allele frequencies and depth ratios, the sequence of chromosome 2 can be divided into three regions. In region 2, the allele frequencies were distributed around 0.5. This indicates the copy number may be two for this region. In region 1, the allele frequencies were clustered into two groups around 0.3∼0.4 and 0.6∼0.7, and the depth ratios were higher than those in other regions. This indicates the copy number may be three for this region. In region 3, the allele frequencies were clustered between 0.1∼0.2 and 0.8∼0.9, which indicated that loss of heterozygosity happened in this regions. The depth in region 3 was lower than other regions, and indicated the copy number may be one in this region
To evaluate the performance of DEFOR and some of the available methods, SNP array data and exome-sequencing data of nine paired normal-tumor samples from a published study on kidney cancer (Pena-Llopis et al., 2012) (GSE25540 and phs000491) were used. SCNAs estimated from SNP array data served as the gold standard, and SCNAs from exome-sequencing data were detected using DEFOR, CNVkit, Falcon, VarScan2, cn.mops and CNV-seq.
3 Results
Based on the proportion of the genome occupied by SCNAs, we classified nine tumor samples into two groups. Five samples in which the detected SCNAs covered less than 30% of the genome were assigned as stable tumor cells, while the other four samples in which the detected SCNAs covered greater than 30% of the genome were assigned as unstable tumor cells.
For the five samples from stable tumor cells, the copy numbers derived from both DEFOR and CNVkit had a high concordance with that from array data, and these models performed significantly better than the other methods (Supplementary Table S2). For four of these five samples, DEFOR had an F-score greater than 0.98, which was higher than that of CNVkit and other methods tested. However, the concordance between the results from exome-sequencing and array data was much lower for unstable tumor cells (Supplementary Table S2). To figure out the reason behind that, we inspected the results in each sample manually. By comparing the copy numbers from different methods with allele frequencies and depth, we found that the results from SNP arrays may not be reliable when the SCNAs occupy a high proportion of the genome (Supplementary Material and Supplementary Fig. S3). This is because the median or mean copy number across the genome is no longer close to two in that situation, and the copy numbers were not normalized accurately (Supplementary Fig. S3). For all four samples from unstable tumor cells, the copy numbers estimated by DEFOR had better concordance with the pattern with allele frequencies and depth (Supplementary Material and Supplementary Fig. S3). We think that is a good example indicating the importance of considering both depth and allele frequency to estimate SCNAs in tumor cells.
Based on the evaluation using the real dataset, DEFOR had good accuracy in detecting SCNAs from tumor samples and outperformed all other methods, especially for unstable tumor cells in which SCNAs occurred in a large proportion of the genome. We think the improvement in performance is largely due to the model integrating allele frequency, depth and purity.
Funding
This work was supported by Cancer Prevention and Research Institute of Texas [RP150596]. JB and YX are supported by NIH [P50CA196516].
Conflict of Interest: none declared.
References

