


Abstract
Patterns of mutational correlations, learnt from patient-derived sequences of human immunodeficiency virus (HIV) proteins, are informative of biochemically linked networks of interacting sites that may enable viral escape from the host immune system. Accurate identification of these networks is important for rationally designing vaccines which can effectively block immune escape pathways. Previous computational methods have partly identified such networks by examining the principal components (PCs) of the mutational correlation matrix of HIV Gag proteins. However, driven by a conservative approach, these methods analyze the few dominant (strongest) PCs, potentially missing information embedded within the sub-dominant (relatively weaker) ones that may be important for vaccine design.
By using sequence data for HIV Gag, complemented by model-based simulations, we revealed that certain networks of interacting sites that appear important for vaccine design purposes are not accurately reflected by the dominant PCs. Rather, these networks are encoded jointly by both dominant and sub-dominant PCs. By incorporating information from the sub-dominant PCs, we identified a network of interacting sites of HIV Gag that associated very strongly with viral control. Based on this network, we propose several new candidates for a potent T-cell-based HIV vaccine.
Accession numbers of all sequences used and the source code scripts for all analysis and figures reported in this work are available online at https://github.com/faraz107/HIV-Gag-Immunogens.
Supplementary data are available at Bioinformatics online.
1 Introduction
The Joint United Nations Programme on HIV/AIDS (UNAIDS) estimates that more than 36 million individuals are currently living with the human immunodeficiency virus (HIV) (UNAIDS, 2018). Despite multiple efforts over the last three decades, an effective vaccine against HIV is still not available (Safrit et al., 2016). One of the major challenges for vaccine design is that HIV mutates and replicates at a high rate, with the resulting diversity enabling it to escape host immune responses (Allen et al., 2005; Esparza, 2013; Safrit et al., 2016). The observed escape mechanism in HIV often involves a network of interacting sites: escape mutations at sites targeted by the immune cells may be accompanied by mutations elsewhere in the protein that compensate for the fitness loss incurred by those escape mutations (Barton et al., 2016; Dahirel et al., 2011; Goulder and Watkins, 2004; Noviello et al., 2011; Schommers et al., 2016). These networks of interacting sites are quite complicated and not well-understood. For designing an effective HIV vaccine, accurately determining such networks is important to mitigate the possibility of viral escape.
Several studies have attempted to learn the networks of interacting sites in HIV proteins by studying the mutational correlation patterns observed in patient-derived sequence data (Dahirel et al., 2011; Liu et al., 2008; Quadeer et al., 2018). In Liu et al. (2008), the study focused specifically on HIV-1 protease to differentiate the networks of interacting sites within drug-naïve patients and those undergoing therapy. In contrast, by performing a spectral analysis of the mutational correlation matrix of multiple individual HIV proteins (constructed from the sequence data of drug-naïve patients) and studying the structure embedded within the respective principal components (PCs), (Dahirel et al., 2011; Quadeer et al., 2018) identified distinct biochemically linked groups of co-evolving sites, termed ‘sectors’, which apparently reflect underlying intrinsic networks of interacting sites in HIV proteins. An important feature of these methods (Dahirel et al., 2011; Quadeer et al., 2018), which drew upon earlier work of Halabi et al. (2009), was the use of ideas from random matrix theory (RMT) to distinguish true correlations from those which are seemingly due to the statistical noise caused by limited data.
For HIV Gag, a highly immunogenic polyprotein, one of the inferred sectors (Dahirel et al., 2011) was found to be enriched with sites that lie within the known protective epitopes which, when targeted by cytotoxic T lymphocytes (CTLs), are known to correlate with HIV control (Pereyra et al., 2010, 2014). An important feature of this sector, as compared with other inferred sectors (Dahirel et al., 2011), was the preponderance of site pairs whose mutations were negatively correlated; meaning that the frequency of simultaneous mutations at such site pairs is lower than the frequency that would be expected if the mutations at the individual sites were independent. This suggested that the sites within this sector may be collectively more constrained; i.e. mutating them simultaneously may incur a high fitness cost to the virus [evidenced in Mann et al. (2014) by studying the effect of such mutations on in vitro replication capacity of HIV], and thus represent potential candidates for effective immune targeting.
The sectoring inference method of Dahirel et al. (2011) was improved in Quadeer et al. (2018) by introducing a robust co-evolutionary analysis method (RoCA) that yielded more accurate biochemically linked HIV Gag sectors by providing enhanced resilience to statistical noise in the estimation of the PCs. However, RoCA used a conservative approach which considered only the few dominant (strongest) PCs of the correlation matrix for sector inference, notwithstanding that some relevant mutational information could still be present in the sub-dominant (relatively weaker) PCs.
Here, by looking beyond the dominant PCs of the correlation matrix, we demonstrate that sub-dominant PCs may carry complementary biochemically and immunologically important information. Our work identifies a basic ‘sector splitting’ phenomenon that can essentially affect all existing sector-based co-evolutionary analysis methods, which typically infer co-evolutionary sectors from individual PCs of mutational correlation matrices of proteins (Dahirel et al., 2011; Rivoire et al., 2016; Quadeer et al., 2014; Quadeer et al., 2018). Model-based tests show that networks involving negatively correlated sites [precisely those which appear most relevant for vaccine design (Dahirel et al., 2011)] tend to be under-represented by the dominant PCs, and that subdominant PCs play a critical role in accurately inferring such networks. To incorporate this information in the sector inference procedure, we present a principled modification of the approach of (Quadeer et al., 2018) which considers PCs of the correlation matrix beyond the few dominant ones and, where relevant, combines information from multiple PCs to form sectors. This leads us to identify a refined sector for HIV Gag having a much stronger association with protective epitopes than that reported in previous studies (Dahirel et al., 2011; Quadeer et al., 2018). Based on the sites of this refined sector, we identify new Gag candidate immunogens as potential targets for an effective T-cell-based HIV vaccine.
2 Materials and methods
The sequence data of HIV-1 clade B Gag were downloaded from the Los Alamos National Laboratory (LANL) HIV sequence database (www.hiv.lanl.gov/components/sequence/HIV/search/search.html) and processed as described in Quadeer et al. (2018). This resulted in a Gag multiple sequence alignment (MSA) comprising N = 1897 sequences with M = 451 sites. The MSA was used to compute the mutational correlation matrix (see Supplementary Text S1 for details), serving as the basis of our analysis.
For our model-based ground-truth tests, correlation matrices were constructed from two synthetic data models: (i) a simple model comprising a single network of three interacting sites and (ii) a larger more complex model comprising two distinct networks of 14 and 43 interacting sites, respectively (see Supplementary Text S2 for details).
Spectral analysis of the correlation matrices was carried out to identify networks of interacting sites by estimating the PCs using Corr-ITSPCA (correlation-based iterative thresholding sparse PCA), a key component of the RoCA method (Quadeer et al., 2018). However, in contrast to that method, which involved a conservative threshold and yielded six dominant PCs for the correlation matrix of HIV Gag (Fig. 1A), we progressively relaxed the threshold. In Quadeer et al. (2018), this threshold was set according to the maximum eigenvalue observed in a large ensemble of randomized MSAs to distinguish PCs reflecting true correlations from those which were supposedly corrupted by statistical noise. To investigate if the PCs corresponding to the sub-dominant eigenvalues captured further information about the underlying networks of interacting sites, especially the ones involving negatively correlated pairs which were suggested to be important for vaccine design (Dahirel et al., 2011), we introduced an approach that successively included multiple sub-dominant PCs in the Corr-ITSPCA algorithm until the resulting estimates of the dominant PCs became unstable; i.e. they were largely distorted by statistical noise (see Supplementary Text S3a for details). In Quadeer et al. (2018), sectors were formed from the six dominant PCs by selecting the sites that corresponded to large-magnitude indices in these PCs; these indices were largely distinct across the PCs and, thus, each PC yielded a distinct sector. However, the sets of large-magnitude indices may show significant overlap, particularly when sub-dominant PCs are considered. Here, guided by insights from our model-based ground-truth tests, which suggested that multiple overlapping PCs (i.e. PCs having common large-magnitude indices) may in fact represent the same network of interacting sites (see Section 3), we proposed a modified sector inference approach. Specifically, in addition to forming sectors from distinct PCs based on their large-magnitude indices, we proposed, where appropriate, to form sectors based on the large-magnitude indices of multiple PCs having significant overlap (see Supplementary Text S3b for details). The improved accuracy of the proposed method in the identification of complex interaction networks was confirmed using ground-truth models (Supplementary Text S4).
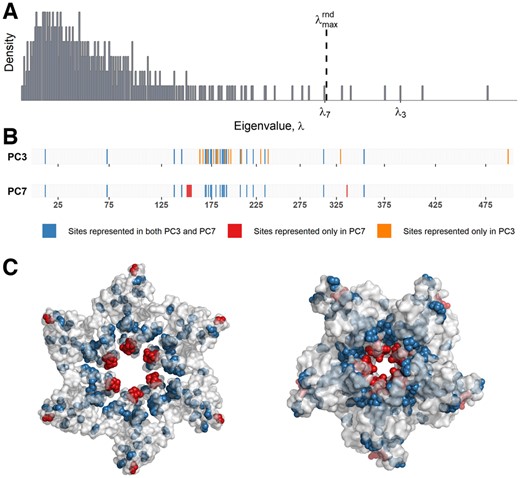
Spectral analysis of HIV Gag sequence data. (A) Eigenvalue distribution of the Gag sample correlation matrix. The dashed line indicates the threshold () adopted by Quadeer et al. (2018). (B) Illustration of PC3 (top) and PC7 (bottom) corresponding to λ3 and λ7, respectively. The PC indices are numbered according to the HXB2 reference sequence (https://www.hiv.lanl.gov/content/sequence/HIV/REVIEWS/HXB2.html). (C) Crystal structures showing the P24 hexamer (PDB ID: 3GV2) (left panel) and the P24 pentamer (PDB ID: 3P05) (right panel) involved in the formation of HIV capsid. The sites on the structure are colored according to the color scale shown in (B)
3 Results
3.1 Sub-dominant PCs may provide information about networks of biologically interacting sites of HIV Gag
In Quadeer et al. (2018), six sectors reflecting networks of interacting sites were identified for HIV Gag, with each sector uniquely associated to a distinct structural or functional domain. For example, one of the inferred sectors was found to strongly associate with the membrane-binding domain of the matrix protein p17, while sites forming another sector strongly associated with the intrahexamer and intrapentamer interface of the capsid protein p24. Due to the conservative threshold adopted for identifying the number of informative PCs of the Gag sample correlation matrix (Fig. 1A), it was not clear if useful information was being missed by excluding the sub-dominant PCs that corresponded to eigenvalues close to the specified threshold. Therefore, we first examined the PC corresponding to the seventh largest eigenvalue (λ7)—situated very close to the threshold in (Quadeer et al., 2018) (Fig. 1A)—which revealed a distinct pattern to that reflected by the first six PCs. Specifically, while the sets of large-magnitude indices of the first six PCs were mutually quite distinct, the set of large-magnitude indices of PC7 significantly overlapped (78%) with that of another PC (PC3) (Fig. 1B).
The sector previously inferred from PC3 in Quadeer et al. (2018), based on its large-magnitude indices, had the important characteristic of comprising a large proportion of negatively correlated pairs of sites. This sector was also shown to be strongly associated with the P24 intrahexamer and intrapentamer interface sites, known to be important for the structural stability of the viral capsid (Pornillos et al., 2011, 2009). Interestingly, the additional set of sites indicated by PC7 (indices having large-magnitude in PC7 and not in PC3) mostly belonged to the core of the P24 hexamer/pentamer structure (Fig. 1C), which is also known to be critical for the stability of the viral capsid (Campbell and Hope, 2015; Manocheewa et al., 2013; Rihn et al., 2013; Schommers et al., 2016). The fact that sites within the P24 core and those within the intrahexamer and intrapentamer interfaces are associated to the same function suggests that PC3 and PC7 may together correspond to a single underlying network of functionally linked interacting sites.
3.2 Model-based studies reveal that sub-dominant PCs can capture distinct information for networks involving negatively correlated pairs of sites
To help explain the empirical observations above, we constructed systematic tests to investigate whether and under what circumstances a network of interacting sites may not be inferable from a single PC of the correlation matrix, but rather, would require multiple PCs. Specifically, we first constructed a simple single-network model for a protein comprising three interacting sites. Multiple test cases were considered, with each case involving a different proportion of negatively and positively correlated pairs within the network (Fig. 2A). For simplicity, we assumed similar magnitude for all pairwise correlations (for details on the model construction, see Supplementary Text S2). We noticed that, while in some cases the most-dominant PC (PC1) assigned a large magnitude to the indices corresponding to the three interacting sites (Fig. 2Atop panel), this was not always true when some sites in the network were negatively correlated (Fig. 2Abottom panel). This is a consequence of an intrinsic limitation of the PC representation; in particular, the number of pairwise negative correlations that can be reflected in a single PC is limited. For example, a PC can represent a negatively correlated pair of sites by having opposite signs on its corresponding indices. However, if all pairs of sites in a network are mutually negatively correlated, it is impossible for a single PC to represent these pairwise interactions (see Fig. 2Abottom right panel, for example), since that would require all indices of a PC to have distinct signs. As a result, for such cases, some of the interacting sites may be represented by indices with small magnitude in a dominant PC; such indices can then be easily missed when forming sectors (Quadeer et al., 2018). Interestingly, our tests suggested that a sub-dominant PC compensates for the under-representation of sites in the dominant PC, such that a site represented by an index with small magnitude in PC1 was strongly represented—by an index with large magnitude—in PC2 (Fig. 2Abottom panel). Thus, the two PCs (PC1 and PC2) together were required to identify all interacting sites of the underlying network. Note that this result is robust to specific values of correlations used to construct the networks (Supplementary Fig. S1).
![Representations of model-based correlation matrices and their PCs capturing networks of interacting sites in protein models. (A) A single network model with three interacting sites and different correlation structures: (i) all pairs of sites are positively correlated (top left panel), (ii) two pairs are negatively while one pair is positively correlated (top right panel), (iii) two pairs are positively while one pair is negatively correlated (bottom left panel) and (iv) all pairs of sites are negatively correlated (bottom right panel). In the first two cases (top panel), the three interacting sites are fully represented in PC1 (corresponding to the largest eigenvalue); this contrasts with the last two cases (bottom panel), where the network is only partially represented in PC1. (B) A two-network model comprising pairwise correlations close to those observed in the Gag data. The first network (corresponding to the upper left block) comprises 14 sites involving only positively correlated pairs of sites while the second network (corresponding to the lower right block) comprises 43 sites involving a combination of both positively and negatively correlated pairs of sites. PCs corresponding to the three largest eigenvalues of the correlation matrix (namely, PC1, PC2 and PC3) are shown after removing the weak PC indices [see Equation (3) in Supplementary Text S3b for details]. On the bottom panel, the magnitudes of the PC indices are represented by the color of the corresponding cells. The same color scale was used to represent all the PCs in (A) and (B) which is shown at the bottom of panel (B)](https://oup.silverchair-cdn.com/oup/backfile/Content_public/Journal/bioinformatics/35/20/10.1093_bioinformatics_btz524/2/m_bioinformatics_35_20_3884_f2.jpeg?Expires=1716549800&Signature=z2Uupc-NE7B9irxUZ~lPlMKChBeTQ0ivScA-BUpHk3Z8I9zGrQW3oL4Sb7g5szTmDttGOK7iAts-x2D2nIt1DA~7WZDerGl2~qjxWk8vu~dJLxC4XXEIr40T54TRgZWrrUXhflcbQ4dnKJKLN8mryMRNRWnmImR-yR5fXCtN8N9pBrDeqrVGhxjkED4Xw6JLGmvEmWCX~yAmvWCXDbSXWnSHsL-n96hWzfzZzumb-ANRdwZVnta0XzZnild5iOIlQtpye3r~Tl5GWnRNMaYchBbVzbUC25Ohrcp4R7D-00~hgdAOC~jlpFtKMNEtiV~ObVZF-b2iceXcPa9AyOJ2VQ__&Key-Pair-Id=APKAIE5G5CRDK6RD3PGA)
Representations of model-based correlation matrices and their PCs capturing networks of interacting sites in protein models. (A) A single network model with three interacting sites and different correlation structures: (i) all pairs of sites are positively correlated (top left panel), (ii) two pairs are negatively while one pair is positively correlated (top right panel), (iii) two pairs are positively while one pair is negatively correlated (bottom left panel) and (iv) all pairs of sites are negatively correlated (bottom right panel). In the first two cases (top panel), the three interacting sites are fully represented in PC1 (corresponding to the largest eigenvalue); this contrasts with the last two cases (bottom panel), where the network is only partially represented in PC1. (B) A two-network model comprising pairwise correlations close to those observed in the Gag data. The first network (corresponding to the upper left block) comprises 14 sites involving only positively correlated pairs of sites while the second network (corresponding to the lower right block) comprises 43 sites involving a combination of both positively and negatively correlated pairs of sites. PCs corresponding to the three largest eigenvalues of the correlation matrix (namely, PC1, PC2 and PC3) are shown after removing the weak PC indices [see Equation (3) in Supplementary Text S3b for details]. On the bottom panel, the magnitudes of the PC indices are represented by the color of the corresponding cells. The same color scale was used to represent all the PCs in (A) and (B) which is shown at the bottom of panel (B)
These insights were further corroborated for more complex interaction networks. We constructed a ground-truth model for a protein comprising two distinct, larger networks of interacting sites (Fig. 2B); one comprising sites with only positive pairwise correlations, the other comprising sites with both positive and negative pairwise correlations (see Supplementary Text S2 for details). Of the inferred PCs, PC2 uniquely represented the network comprising all positively correlated pairs of sites, however, two overlapping PCs (PC1 and PC3) jointly represented the network comprising both positive and negative pairwise correlations (Fig. 2Bbottom panel). This is in line with the aforementioned splitting of information of the interacting sites over multiple PCs for a network comprising negative pairwise correlations. The two PCs (PC1 and PC3) overlapped significantly (67%), suggesting that a large overlap among PCs of the correlation matrix may be a good marker for identifying multiple PCs that reflect the same underlying network.
These ground-truth results reveal an important message: by forming sectors based on only the dominant PCs, as in previous methods (Dahirel et al., 2011; Quadeer et al., 2014, 2018), one may potentially miss some sites of networks that involve negatively correlated interactions—precisely those suggested to be most important for vaccine design (Dahirel et al., 2011).
3.3 Sector inference incorporating weaker PCs reveals a HIV Gag sector with enhanced immunological significance
Guided by insights from our ground-truth studies, we modified the procedure of Quadeer et al. (2018) for selecting the number of informative PCs and applied this modified approach to infer new sectors for HIV Gag. Specifically, after progressively relaxing the eigenvalue threshold to incorporate additional PCs—while keeping the additional statistical noise to a level such that the estimates of the six dominant PCs [demonstrated previously (Quadeer et al., 2018) to be informative of Gag biochemical domains] are not significantly distorted—the nine strongest PCs of the Gag correlation matrix were selected for sector inference. We used a modified sector inference procedure that considers the PCs with large overlaps to infer sectors comprising all the sites indicated by the overlapping PCs (see Supplementary Text S3b for details). Among the nine PCs, PC7 overlapped substantially (78%) with PC3, and a significant overlap (35%) was observed between PC6 and PC9, while the remaining five PCs (namely, PC1, PC2, PC4, PC5 and PC8) were largely distinct (Fig. 3 and Supplementary Fig. S2). PCs in each overlapping pair (PC3–PC7 and PC6–PC9) were also found to be statistically mutually dependent as opposed to all other possible pairs of PCs (see Supplementary Text S5 for details). Five sectors were uniquely inferred from the distinct five PCs, of which four corresponded one-to-one with sectors previously inferred in Quadeer et al. (2018) while one sector, inferred from PC8 and comprising 12 sites, was largely distinct (Fig. 3). In addition, two new sectors (sectors 3 and 6) were inferred by combining sites indicated by the overlapping PCs: PC7 with PC3 (sector 3) and PC9 with PC6 (sector 6), respectively (Fig. 3). Unlike the others, these two sectors comprised negatively correlated pairs of sites (Fig. 3), which is consistent with our findings from the ground-truth tests; i.e. the information of interacting sites in a network involving negative pairwise correlations can split across multiple PCs.
![Representation of the cleaned Gag sample correlation matrix and its informative PCs. PCs corresponding to the nine largest eigenvalues of the correlation matrix (namely, PC1–PC9) are shown after removing the weak PC indices [see Equation (3) in Supplementary Text S3b for details]. Rows and columns of the matrix as well as PC indices are ordered such that the inferred sectors appear clearly as blocks, e.g. PC7 is placed after PC3 since they are jointly used to infer a single sector. On the bottom panel, the magnitudes of the PC indices are represented by the color of the corresponding cells. Note that negative pairwise correlations appear only within two sectors: sector 3 inferred jointly from PC3 and PC7, and sector 6 inferred jointly from PC6 and PC9 (for details on matrix cleaning, see Supplementary Text S7)](https://oup.silverchair-cdn.com/oup/backfile/Content_public/Journal/bioinformatics/35/20/10.1093_bioinformatics_btz524/2/m_bioinformatics_35_20_3884_f3.jpeg?Expires=1716549800&Signature=as6FWDsC4rXXVeZr8VDZ~m514GWHtTZZbigd347iXb04j3RyuQwD7kpqvne3swEaMRhlTr1fSUXR1y2XaEAD9uHc2a-r3Md00Dx3DlS8MdVxxlJVducq2b6yiAEQXLVOIh4kMpTPRXBHRboK~wOOXgEBD~gGgAUFFO4ASohqR8MJVeR5zzF1zFc6p-8m4CodJ1k0b36QZY3Sl7Pz-oRwLb3Ilir9eRKkWhZdMaXUT85sPLB7RzcqJZGJQgUyj3Q0LOPQTW0WssGrJKkYlxShc36Ni1NsglNrzzDE-3TlxfhpJw5YUeTwTCCrhmiiBY2PiE9m0NMjUUsyUtAX5DD1dw__&Key-Pair-Id=APKAIE5G5CRDK6RD3PGA)
Representation of the cleaned Gag sample correlation matrix and its informative PCs. PCs corresponding to the nine largest eigenvalues of the correlation matrix (namely, PC1–PC9) are shown after removing the weak PC indices [see Equation (3) in Supplementary Text S3b for details]. Rows and columns of the matrix as well as PC indices are ordered such that the inferred sectors appear clearly as blocks, e.g. PC7 is placed after PC3 since they are jointly used to infer a single sector. On the bottom panel, the magnitudes of the PC indices are represented by the color of the corresponding cells. Note that negative pairwise correlations appear only within two sectors: sector 3 inferred jointly from PC3 and PC7, and sector 6 inferred jointly from PC6 and PC9 (for details on matrix cleaning, see Supplementary Text S7)
The presence of negatively correlated sites within sectors 3 and 6 pointed to the potential immunological importance of these sectors. Further analysis revealed that sector 3 was strongly associated with the sites that lie within the known protective epitopes (Pereyra et al., 2010, 2014), while sector 6 was reminiscent of a quasi-sector reported in Dahirel et al. (2011), comprising weakly correlated sites (see Supplementary Fig. S3) that appear to represent an averaged footprint of the diverse immune pressure exerted by the HIV-infected population (Brumme et al., 2009) (see Supplementary Fig. S4). Notably, the statistical significance of the association of sector 3 with protective epitopes was nearly two orders of magnitude higher (Fig. 4) than that reported for the suggested immunologically vulnerable sectors in previous works (Dahirel et al., 2011; Quadeer et al., 2018). Specifically, by incorporating PC7, six additional sites (149, 150, 151, 152, 153, 335) were included in sector 3 which lied within at least one of the known protective epitopes. Moreover, five of these six sites are involved in the structural core of the P24 intrahexamer and intrapentamer interfaces (Fig. 1B and C) where mutations have been found to result in defective capsid assembly and impairment of infective capacity of the virus (Burdick et al., 2017; Jacques et al., 2016; López et al., 2011; Manocheewa et al., 2013). Thus, incorporating these additional sites into sector 3 increased the statistical significance of both its biochemical and immunological associations by several orders of magnitude (see Supplementary Fig. S5).
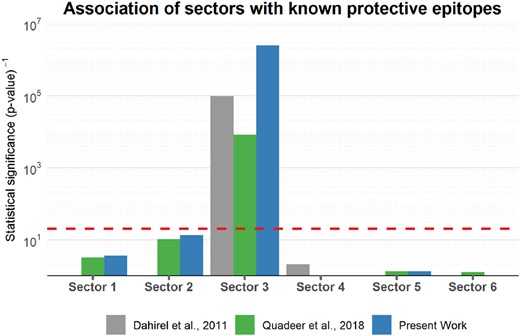
Association of the inferred sectors with the set of sites that lie within the known protective epitopes. These epitopes are derived from Gag (Pereyra et al., 2010, 2014). The p-values measuring the statistical significance of associations were computed using Fisher’s exact test. The dashed line represents the common threshold of statistical significance (p-value = 0.05)
The fact that sector 3 was enriched with negatively correlated pairs of sites suggested that it represented a multi-dimensionally constrained network within Gag, wherein, simultaneous mutations on pairs of sites are less tolerated by HIV due to their seemingly deleterious effect on viral fitness (Mann et al., 2014). Hence, eliciting an immune response against multiple sites within this sector may potentially restrict viral escape as it would force the virus to mutate in order to avoid being recognized by the immune system, with the resulting mutant viruses likely having a severely compromised fitness (Ferguson et al., 2013; Mann et al., 2014). Thus, sites within this sector may serve as important targets for an effective T-cell-based HIV vaccine.
3.4 T-cell-based HIV vaccine candidates
For designing a T-cell-based vaccine that specifically targets multiple sites in the inferred sector 3, we considered as a case study a target population of European Caucasian descent having one of the 25 most-frequent haplotypes across the three common HLA loci (A, B and C) involved in the processing and presentation of CTL epitopes (Gragert et al., 2013). The selected haplotypes cumulatively cover nearly 48% of the targeted population. To form candidate immunogens, the list of immunogenic epitopes of Gag that are restricted by the HLA alleles present within the targeted population was obtained from the ‘best-defined’ CTL epitopes list for HIV-1 in the LANL Molecular Immunology database (see Supplementary Table S1) (www.hiv.lanl.gov/content/immunology/tables/optimal_ctl_summary.html). We identified 45 distinct Gag epitopes and, among these, all possible groups of five epitopes were evaluated according to our design objective (Supplementary Text S6). In particular, to identify candidate immunogens that would likely establish viral control, we used a suitably adapted version of the procedure described in Dahirel et al. (2011) and Quadeer et al. (2014) for screening groups of five epitopes that: (i) maximize the proportion of sites that are fully conserved, (ii) maximize the proportion of negatively correlated pairs of sector 3 sites across epitopes, and (iii) minimize the proportion of positively correlated pairs of sites across epitopes (see Supplementary Text S6 for further details). The top five candidate immunogens (out of ∼106 combinations) that maximize this design objective (L score) as well as the double coverage (DCov)—the fraction of the target population that comprise HLA alleles which elicit immune response against at least two epitopes present within the candidate immunogen—are presented in Table 1. Each of the top five candidates differ by at least four out of five epitopes compared with the top five candidate immunogens proposed in Dahirel et al. (2011). Specifically, our top five candidates are composed of seven distinct epitopes, of which only one is present among the top five candidate immunogens proposed in Dahirel et al. (2011). Furthermore, the DCov is greater than that reported for the candidates in Dahirel et al. (2011) (see Supplementary Table S2 for the list of top 20 candidate immunogens).
List of Gag derived CTL epitope-based candidate immunogensa
| Epitope1 | Epitope2 | Epitope3 | Epitope4 | Epitope5 | DCov (%) | score |
|---|---|---|---|---|---|---|
| 148–156 | 269–277 | 294–304 | 355–363 | 433–442 | 40.4 | 0.39 |
| 148–156 | 269–277 | 306–316 | 355–363 | 433–442 | 40.4 | 0.38 |
| 148–156 | 180–188 | 269–277 | 294–304 | 433–442 | 40.4 | 0.37 |
| 180–188 | 269–277 | 294–304 | 355–363 | 433–442 | 40.4 | 0.37 |
| 180–188 | 269–277 | 306–316 | 355–363 | 433–442 | 40.4 | 0.34 |
All epitopes are numbered according to the HXB2 reference sequence.
Overall, our analysis shows that refined identification of networks of interacting sites in HIV Gag, incorporating sub-dominant PCs, reveals new candidate immunogens with potentially enhanced efficiency. Our study can guide further experimental work designed to test the robustness of immune responses elicited by these candidate immunogens.
Funding
M.R.M. and A.A.Q. were supported by the General Research Fund of the Hong Kong Research Grants Council (RGC) [Grant No. 16202918]. S.F.A. was supported by the Hong Kong Ph.D. Fellowship Scheme (HKPFS). The funders had no role in study design, data collection and analysis, decision to publish, or preparation of the manuscript.
Conflict of Interest: none declared.
References
Author notes
The authors wish it to be known that, in their opinion, Syed Faraz Ahmed and Ahmed A. Quadeer authors should be regarded as Joint First Authors.

