


Abstract
The third generation PacBio long reads have greatly facilitated sequencing projects with very large read lengths, but they contain about 15% sequencing errors and need error correction. For the projects with long reads only, it is challenging to make correction with fast speed, and also challenging to correct a sufficient amount of read bases, i.e. to achieve high-throughput self-correction. MECAT is currently among the fastest self-correction algorithms, but its throughput is relatively small (Xiao et al., 2017).
Here, we introduce FLAS, a wrapper algorithm of MECAT, to achieve high-throughput long-read self-correction while keeping MECAT’s fast speed. FLAS finds additional alignments from MECAT prealigned long reads to improve the correction throughput, and removes misalignments for accuracy. In addition, FLAS also uses the corrected long-read regions to correct the uncorrected ones to further improve the throughput. In our performance tests on Escherichia coli, Saccharomyces cerevisiae, Arabidopsis thaliana and human long reads, FLAS can achieve 22.0–50.6% larger throughput than MECAT. FLAS is 2–13× faster compared to the self-correction algorithms other than MECAT, and its throughput is also 9.8–281.8% larger. The FLAS corrected long reads can be assembled into contigs of 13.1–29.8% larger N50 sizes than MECAT.
The FLAS software can be downloaded for free from this site: https://github.com/baoe/flas.
Supplementary data are available at Bioinformatics online.
1 Introduction
The third generation sequencing technology is advantageous over the second generation in its much larger read lengths (Eid et al., 2009). As a representative of the third generation sequencing technology, the PacBio Single Molecule Real-Time technology can currently generate long reads of 5–15 K base pairs on average with cost of $0.4–0.8 per million base pairs (Lee et al., 2016; Rhoads and Au, 2015). The long reads can overcome length limitation of the second generation short reads, and can thus facilitate assembling or analyzing complex genome regions such as GC islands and repeats in downstream. As a result, more and more sequencing projects have incorporated the long reads. The projects can be classified into two categories as below.
Long and short read hybrid projects use long and short reads together (Chen et al., 2014; Philippe et al., 2013). In these projects, long reads of low to moderate coverage are used as a complement to short reads of relatively high coverage, to obtain higher quality results than the short reads alone.
Long read only projects use long reads alone (Baker et al., 2014; Chaisson et al., 2015). Though more expensive, long reads of high coverage can be used without short reads, to guarantee high quality results while simplifying the sequencing workflow.
Nevertheless, the long reads contain about 15% sequencing errors dominated by insertions and deletions, so it is important to correct these errors. The error correction can be made in two levels: biological level by Circular Consensus Sequencing (CCS) technology and computational level by error correction algorithms (Eid et al., 2009). The CCS technology has to reduce read lengths to a large extent for correction, so the error correction algorithms are usually in favor over the CCS. The current error correction algorithms can be classified into two categories as below.
Short read assisted correction algorithms align the corresponding short reads from the same species to the long reads and correct them, so they are suitable for the long and short read hybrid projects. PBcR (Koren et al., 2012), LSC (Au et al., 2013), Proovread (Hackl et al., 2014) and CoLoRMap (Haghshenas et al., 2016) align the uncorrected short reads to the long reads for correction, while ECTools (ECTools and HGAP, FALCON, Canu and MECAT below are essentially pipeline algorithms including both error correction and downstream assembly algorithms.) (Lee et al., 2014), LoRDEC (Salmela and Rivals, 2014), Jabba (Miclotte et al., 2016) and HALC (by ourselves Bao and Lan, 2017) align the long reads to a de Bruijn graph constructed or contigs assembled from the short reads for correction.
Self-correction algorithms align the long reads to themselves and find multiple sequence alignments among the long reads to correct them, suitable for the long read only projects. HGAP (Chaisson and Tesler, 2012; Chin et al., 2013) finds seeding k-mers among the long reads and then the alignments by dynamic programing, and FALCON (Chin et al., 2016; Myers, 2014) applies fast techniques to find the k-mers and alignments. Canu (Berlin et al., 2015; Koren et al., 2017) weights and filters the k-mers to reduce load of finding the alignments, and MECAT (Xiao et al., 2017) takes into consideration correlation of the k-mers for the filtration. Differently, LoRMA (Salmela et al., 2016) aligns the long reads to de Bruijn graphs constructed from themselves for correction.
For the self-correction algorithms, there are two challenges to address as below.
It is challenging to make correction with fast speed, because it is time consuming to align the long reads of usually several millions to each other. HGAP, FALCON, Canu and MECAT all seek to address this challenge.
It is also challenging to correct a sufficient amount of read bases, i.e. to achieve high-throughput self-correction, because it is also difficult to align the long reads of about 15% errors to each other. LoRMA seeks to address this challenge.
Note that for the self-correction algorithms, though it is important to distinguish genome repeats in the long reads during correction, it is not as challenging as the above two, because the repeats are usually shorter than the long reads, and have only moderate to low influence on long-read alignment and correction. This is different from the short read assisted correction algorithms.
MECAT has successfully addressed the first challenge, and is currently among the fastest self-correction algorithms (Xiao et al., 2017). Nevertheless, its throughput is relatively small. This is not economical considering the higher cost of long reads compared to short reads, and may also affect quality of the downstream results (Lee et al., 2014). In order to address both of the two challenges, here we propose FLAS, a fast and high-throughput algorithm for long-read self-correction. FLAS is a wrapper algorithm of MECAT, to achieve high throughput while keeping MECAT’s fast speed. FLAS has two novelties as below.
FLAS finds additional alignments from MECAT prealigned long reads to improve the correction throughput, and removes misalignments for accuracy. For the prealigned long reads, those aligned with each other are likely to be from the same genome region, so are found and put into the same set. For two such sets, if there are shared long reads existing in both of them, it is possible all the long reads are from the same genome region, so additional alignments could be found between the two sets for correction; alternatively, it is possible the shared long reads are misaligned in one set, so misalignments could be removed from the set.
It also uses the corrected long-read regions to correct the uncorrected ones to further improve the throughput. A graph is constructed from alignments of the corrected long-read regions, and context of the graph is examined to accurately align the uncorrected long-read regions to the corrected ones for further correction.
2 Materials and methods
2.1 Overview
The FLAS algorithm consists of two steps as below, corresponding to the two novelties above, respectively.
Correct with refined MECAT prealigned long reads.
Align long reads with each other by MECAT, construct an overlap graph based on the alignments (Myers, 2005), and find maximal cliques with a modified Bron–Kerbosch algorithm in the graph (Eppstein et al., 2010; Eppstein and Strash, 2011).
For two maximal cliques with shared vertices, find additional alignments between the corresponding long reads or remove misalignments depending on number of the shared vertices. Make error correction with the refined alignments.
Correct uncorrected long-read regions with corrected ones.
Align the corrected long-read regions with each other, and construct a second overlap graph based on the alignments.
Align all the long reads obtained from step 1 to paths of the graph. For each long-read region with multiple aligned paths, find the correct one by referring to not only alignment identities but also expected amounts of aligned long reads to the paths. Make error correction for the uncorrected long-read regions with the alignments.
In step 1, we construct an overlap graph recording all alignment information by MECAT, find maximal cliques in the graph as sets containing long reads aligned with each other (step 1a), and use the maximal cliques to refine the alignments for error correction (step 1b). In step 2, we construct a second overlap graph recording alignment information among the corrected long-read regions (step 2a), and align all the long reads to paths of the graph to correct the uncorrected regions (step 2b). Details of these steps are as below. Figure 1 shows an illustration of the algorithm.
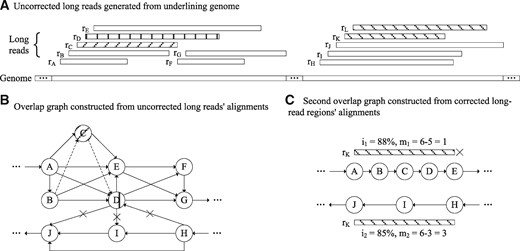
Illustrations on the FLAS algorithm. (A) Uncorrected long reads rA–rL are generated from two similar genome regions in the underlining target genome. rC (shaded) may not be fully corrected by MECAT, since it is only aligned to long reads rA and rE, and not aligned to rB and rD from the same genome region; rD (shaded) may be miscorrected, since it is misaligned to long reads rH, rI and rJ from the other genome region; rK and rL (shaded) may not be corrected, since they are not aligned to any long read from the same genome region. (B) In algorithm step 1, an overlap graph is constructed from the uncorrected long-read alignments. In the graph, there are four maximal cliques: and , where C1 and C2, C2 and C3, C2 and C4 and C3 and C4 are two cliques with shared vertices. C1 and C2 are classified in case (i), and additional alignments are obtained between rC and rB, as well as rC and rD (indicated with dashed lines). As a result, rC can be fully corrected. C2 and C4 are classified in case (iii), and misalignments are removed between rD and rH, rD and rI, as well as rD and rJ (indicated with crosses). As a result, rD can be accurately corrected. (C) In algorithm step 2, a second overlap graph is constructed from alignments of the corrected long reads. With limited errors in paths of the graph, rK could be aligned to two alternative paths: and . Despite P1’s higher alignment identity than P2’s , rK is aligned to P2 of much higher expected amount of aligned long reads than P1’s . As a result, rK can be corrected with accuracy. Similarly, rL can also be corrected (not shown for simplicity)
2.2 Maximal cliques in overlap graph
We align the long reads with each other by MECAT. The parameter settings are the default of moderate alignment sensitivity and accuracy. This guarantees sparsity of the constructed overlap graph (see below).
Based on the alignments, we construct an overlap graph. Each vertex is constructed for one long read, and each edge is constructed between two vertices if the corresponding long reads are aligned with a sufficient overlap length. Transitive edges are not removed, because all the alignment information should be kept (Myers, 2005). The constructed graph is a sparse graph with maximum vertex degree d, where d is the maximum number of candidate alignments for each long read, usually 50–200 controlled by the aligner. The graph’s degeneracy is thus at most d. Sparsity of the graph is useful to guarantee small running time of the modified Bron–Kerbosch algorithm (see below).
In the graph, we find maximal cliques with a modified Bron–Kerbosch algorithm (Eppstein and Strash, 2011). In an arbitrary graph, the maximal clique finding problem is NP-hard, but because the overlap graph is a sparse graph with degeneracy at most d, the modified Bron–Kerbosch algorithm has polynomial time complexity , where n is number of the long reads or vertices. Therefore, running time of the modified Bron–Kerbosch algorithm is guaranteed relatively small.
2.3 Alignment refinement and error correction
Given two cliques C1 of size c1 and C2 of size c2 with s shared vertices existing in both cliques, there are basically three cases for them as below.
Case (i): the corresponding long reads of C1 and C2 are from the same genome region, and the long reads of shared vertices are correctly aligned.
Case (ii): the corresponding long reads of C1 and C2 are from two different genome regions, and the long reads of shared vertices span the genome regions and are correctly aligned.
Case (iii): the corresponding long reads of C1 and C2 are from two different genome regions, and the long reads of shared vertices are from one of the regions and misaligned to the other.
In cases (i) and (ii), s should be relatively large compared to , while in case (iii), s should be relatively small. This is based on the observation that among all alignments, number of the correct alignments is much larger than the misalignments. In addition, in case (ii), each long read of a shared vertex should have one region alignable to the long reads of C1, and a different region to those of C2.
Therefore, to distinguish between cases (i)/(ii) and (iii), we check s and . If , C1 and C2 are classified in case (i)/(ii); otherwise, they are in case (iii), where α1 is a fraction value with default setting 50%. To further distinguish between cases (i) and (ii), we check s and , where is number of the shared vertices whose long reads have one region alignable to the long reads of C1, and a different region to those of C2. If , C1 and C2 are classified in case (ii); otherwise, they are in case (i), where α2 is a fraction value also with default setting 50%.
For any two cliques classified in case (i), we realign the corresponding long reads of the cliques by MECAT to find more alignments. MECAT’s parameter settings are tuned for high alignment sensitivity and relatively low accuracy. The −k parameter, specifying the minimum number of matching k-mers to detect overlap candidates, is lowered from its default value to 2 to detect, form and report more overlaps. The −n parameter, specifying the minimum number of overlap candidates for extension to form overlaps, is lowered from its default value to 50 to form and report more overlaps. The −a parameter, specifying the minimum overlap lengths between reads to report the overlaps, is lowered from its default value to 1000 to report more overlaps. This could improve the error correction throughput. For any two cliques classified in case (iii), we calculate for each long read of a shared vertex, its average alignment identity to the long reads of each clique, and remove it from the clique of lower identity. This could improve the accuracy. After the refinement of alignments, we make error correction by MECAT with default parameter settings. Note that if two cliques are classified in case (ii), we do not do anything, because though the long reads of shared vertices overlap with those in both cliques, they are simply sufficiently long spanning genome regions, and do not imply any additional or incorrect alignment.
2.4 Correction of uncorrected regions with corrected regions
Similar to Section 2.2, we align the corrected long-read regions with each other, and construct a second overlap graph. Transitive edges are removed in the graph. Then we align all the long reads to paths of the graph for error correction. For the long reads containing both corrected and uncorrected regions, the corrected regions are aligned uniquely to paths in the graph, and the uncorrected regions could thus be aligned to paths in between for correction. For the long reads containing only uncorrected regions, they could also be aligned to paths of the graph for correction, because of the graph’s limited errors.
It is possible that an uncorrected long-read region has multiple paths for alignment. To find the correct path, we compare not only alignment identities, but also expected amounts of aligned long reads to the paths. The latter is a measurement of paths’ capability to accommodate aligned long reads, and a long read has higher probability to align to the path of larger capability (see below). Given a long-read region R with two aligned paths P1 of identity i1 and P2 of identity i2, if , we find the path of larger identity as the correct one, where β1 is a difference value with default setting 5%. Otherwise, the expected amounts of aligned long reads to the paths m1 and m2 are calculated, respectively, and if , we find the path of larger amount as the correct one, where β2 is also a difference value with default setting 20%. For long-read regions with more than two aligned paths, alignment identities and expected amounts of aligned long reads are compared in pairs to find the correct path.
Here, the expected amount of aligned long reads to a path P is calculated as the expected amount of long reads mg from the path’s genome region minus the amount of long reads forming the path. can be recorded when the graph is constructed, and mg is calculated as below. Because the probability that a long read of length l is from a genome region of length Δg is , mg is calculated as , where o is minimum required overlap length between the long read and genome region, G is size of the genome, li is length of the ith long read and again, n is number of the long reads. Furthermore, because Δg is about P’s length Δp, and G can be estimated as , mg is further refined as , where c is coverage of the long reads. Note that this calculation assumes a path does not correspond to multiple genome regions. This is reasonable, since one alternatively aligned path of a long-read region represents a single genome region in most cases in overlap graph (Kamath et al., 2017; Myers, 2005).
2.5 Implementation of the FLAS software
The FLAS software is implemented in C++ for Linux platform. It contains data structures as below.
An n item adjacency list for the overlap graph in algorithm step 1. Its lists have the maximum length d, because of the graph’s sparsity.
An n item hash table for the read-clique mapping. It is used to find all the cliques with shared vertices.
An item hash table for the clique-read mapping, where is the maximum possible number of cliques in the graph (Eppstein and Strash, 2011). It is used to find all the shared vertices for any two cliques.
An item adjacency list for the second overlap graph in algorithm step 2, where is number of the corrected long-read regions.
Input of FLAS is the uncorrected long reads, and the outputs include the trimmed long reads that do not contain uncorrected regions in read heads and tails, and split long reads that do not contain any uncorrected region (Salmela and Rivals, 2014).
3 Evaluation
3.1 Experimental design
3.1.1 Test of error correction performance
To evaluate FLAS’s performance, we ran FLAS, MECAT and the other self-correction algorithms HGAP, LoRMA, FALCON and Canu on three sets of long reads from species: Escherichia coli, Saccharomyces cerevisiae and Arabidopsis thaliana of genome sizes 5, 12 and 125 Mbp, respectively. Canu’s genomeSize parameter could be set large values for high throughput, so it was run in both default mode and this high-throughput mode. The latter is represented as Canu+. We also ran FLAS and MECAT on another set of long reads from human of much larger genome size 3 Gbp. The other algorithms besides MECAT were not compared on the human long reads, because they need long running time (Xiao et al., 2017). Coverage of the first three long reads was all about 100×, meeting the requirement of most long read only projects, while that of the human long reads was 50×, due to its large genome size. In addition, on the first three long reads, we ran some typical short read assisted correction algorithms PBcR, CoLoRMap and ECTools, together with the corresponding short reads from the same species. Coverage of the short reads was all about 50×, meeting the requirement of most long and short read hybrid projects. After error correction, we aligned the corrected long reads to the corresponding target genomes, to assess quality of the long reads. Note that not all the short read assisted correction algorithms were compared, because they are in a different category from FLAS.
3.1.2 Test with various long-read coverage and parameter settings
FLAS’s performance is mainly affected by coverage of the long reads, because it is inputted with long reads alone. Hence, it is interesting to see FLAS’s performance with various long-read coverage, and especially, the performance change compared to MECAT and the other self-correction algorithms. To do this, we varied coverage of the E.coli long reads from 50 to 200×, and ran and compared FLAS, MECAT, HGAP, LoRMA, FALCON, Canu and Canu+.
In addition, FLAS’s performance could also be affected by its parameter settings. Specifically, the parameters include the two fraction values α1 and α2 to distinguish between cases (i)–(iii) as discussed in Section 2.3, and the two difference values β1 and β2 to find the correct aligned paths as discussed in Section 2.4. It is also interesting to see FLAS’s performance with various settings of the parameters. To do this, we varied α1 and α2 from 30 to 70%, varied β1 from 1 to 15% and varied β2 from 10 to 40%, and ran FLAS on the E.coli long reads of 100×. Similar to above, after error correction, we aligned the corrected long reads to the corresponding target genome, to assess quality of the long reads.
3.1.3 Test of long-read assemblies
FLAS’s performance influences downstream assembly and analysis as discussed in Section 1. Hence, it is interesting to see some downstream assembly results from the FLAS corrected long reads. To do this, we used FALCON’s assembly algorithm FALCON* (FALCON’s assembly algorithm and Canu’s assembly algorithm below are represented as FALCON* and Canu*, respectively, to distinguish from the error correction algorithms.) (Chin et al., 2016) and Canu’s assembly algorithm Canu* (Koren et al., 2017), and assembled the FLAS corrected S.cerevisiae and A.thaliana long reads. To make comparison, we also assembled the MECAT corrected long reads. Then we assessed quality of the contigs. Note that we did not assemble the corrected long reads by the other algorithms in this test, because this study improves MECAT rather than the other algorithms, with a focus on long-read error correction rather than assembly. Also note that MECAT does not have a standalone assembly algorithm, but applies Canu’s assembly algorithm.
All of the algorithms’ software was in default settings, except Canu+ and the test of various parameter settings as discussed in Section 3.1.2. Only the corrected split long reads were compared and used for assemblies in these tests, so that the results could not be affected by the uncorrected bases. All experiments were performed in a computing node of a computer cluster with 32 cores of 2.3 GHz and 1024 GB memory.
3.2 Datasets and performance measurements
3.2.1 Datasets
The long reads of E.coli, S.cerevisiae, A.thaliana and human were the filtered subreads downloaded from the MHAP website (Berlin et al., 2015). Additional E.coli long reads for the test with various coverage were downloaded from NCBI accession SRX1155577, and filtered by the Single Molecule Real-Time Analysis quality control. The corresponding target genomes were from NCBI accessions NC_000913.3, NC_001133.9, the Ensembl Plant FTP and Ensembl FTP, respectively. The corresponding short reads of E.coli, S.cerevisiae and A.thaliana were from NCBI accessions ERR022075, SRR567755 and ERR469286, respectively.
3.2.2 Performance measurements
We aligned the error corrected split long reads and uncorrected long reads to the corresponding target genomes to assess their quality. The BWA-MEM aligner was used for these alignments, because it is a typical aligner for genomic sequences with fast speed and relatively high sensitivity (Li and Durbin, 2010). We made the following measurements: (i) throughput is the number of corrected and outputted bases, and throughput ratio (THR) is the throughput over the total number of uncorrected long-read bases; (ii) alignment ratio is the number of aligned bases over the total number of outputted bases; (iii) alignment identity is the identity of aligned bases; (iv) genome fraction is the number of genome bases aligned by long reads over the total number of genome bases; (v) time is the elapsed time with 16 threads; (vi) memory is the corresponding memory usage.
Then we used the Error Correction Evaluation Toolkit for split long reads implemented by ourselves (Bao and Lan, 2017), and obtained in the outputted bases, the number of corrected errors (true positive or TP), the number of falsely converted correct bases (false positive or FP), the number of uncorrected errors (false negative or FN) and the number of unconverted correct bases (true negative or TN). With these numbers, due to the errors’ uniform distribution in long reads, we can estimate the total number of errors in the uncorrected long reads as the number of errors in the outputted bases over the THR, i.e. . We can also estimate the total number of correct bases in the uncorrected long reads as the number of correct bases in the outputted bases over the THR, i.e. , and thus the number of correct bases in the discarded bases as the total number of correct bases in the uncorrected long reads minus the number of correct bases in the outputted bases, i.e. . Therefore, we made the following measurements: (vii) sensitivity is calculated as ; (viii) specificity is calculated as ; (ix) gain is the number of errors effectively corrected without introducing new ones over the total number of errors in the uncorrected long reads, and calculated as .
For the assembled contigs, following Chin et al. (2016), we used the QUAST toolkit (Gurevich et al., 2013) and made the following measurements: (x) assembly size is the total length of contigs; (xi) N contigs is the number of contigs; (xii) N50 size is the contig size at 50% of the total number of contig bases; (xiii) N N50 is the number of contigs of lengths larger than the N50 size; (xiv) Max contig size is the maximum contig size. We also aligned the contigs to the corresponding genomes, and generated MUMmer plots to assess accuracy of the contigs (Kurtz et al., 2004).
3.3 Results
3.3.1 Results of error correction performance
Results on the E.coli long reads are listed in Table 1a. The throughput of MECAT is 284 Mbp, and the alignment ratio and alignment identity are about 100%, while the throughput of FLAS is 347 Mbp, and the alignment ratio and alignment identity are also about 100%. The throughput of FLAS is 22.0% larger than MECAT. The running time and memory usage of the other self-correction algorithms HGAP, LoRMA, FALCON, Canu and Canu+ are 0.3–2.0 h and 2.7–46.2 GB, respectively, while those of FLAS are 0.2 h and 2.9 GB, respectively. FLAS is 2–10× faster than all of them. In addition, the throughput of these algorithms is 158–316 Mbp, and that of FLAS is also 9.8–119.4% larger. As to the short read assisted correction algorithms PBcR, CoLoRMap and ECTools, FLAS is 6–16× faster than all of them, and interestingly, the throughput of FLAS is also 4.7–48.9% larger, even though the latter were inputted with additional 50× short reads. This is probably because the short reads have limited lengths, and thus may not be sufficiently aligned to the long reads for correction. Note that for PBcR and FALCON, the sensitivity, gain and specificity are not available without the correspondence information between the uncorrected long reads and corrected ones.
Evaluation of error correction performance
| Method | Throughput (bp) | Alignment ratio (%) | Alignment identity (%) | Genome fraction (%) | Sensitivity (%) | Gain (%) | Specificity (%) | Time (h) | Memory (GB) |
|---|---|---|---|---|---|---|---|---|---|
| (a) Long reads of E.coli (397 486 752 bp) | |||||||||
| PBcRa | 318 955 887 | 99.6 | 99.9 | 96.3 | — | — | — | 3.6 | 2.4 |
| CoLoRMap | 232 836 623 | 99.9 | 99.9 | 91.8 | 58.2 | 56.7 | 99.4 | 1.2 | 18.4 |
| ECTools | 331 259 738 | 99.9 | 99.9 | 94.1 | 83.0 | 82.6 | 99.7 | 3.2 | 11.2 |
| HGAP | 173 564 650 | 95.4 | 99.4 | 98.3 | 41.9 | 32.9 | 98.2 | 2.0 | 7.2 |
| LoRMA | 310 602 850 | 92.7 | 99.9 | 98.5 | 76.0 | 65.1 | 97.3 | 0.9 | 36.4 |
| FALCONa | 245 895 710 | 97.0 | 99.4 | 98.8 | — | — | — | 1.3 | 46.2 |
| Canu | 158 007 936 | 95.6 | 98.9 | 97.7 | 38.0 | 28.1 | 98.0 | 0.3 | 2.7 |
| Canu+ | 315 881 753 | 96.5 | 99.2 | 99.3 | 76.2 | 59.0 | 96.3 | 1.5 | 3.4 |
| MECAT | 284 138 161 | 97.2 | 99.6 | 98.4 | 68.8 | 55.5 | 97.2 | 0.1 | 2.9 |
| FLAS | 346 737 024 | 96.8 | 99.6 | 98.5 | 83.9 | 67.6 | 96.5 | 0.2 | 2.9 |
| (b) Long reads of S.cerevisiae (1 405 936 758 bp) | |||||||||
| PBcRa | 841 341 658 | 99.6 | 99.9 | 99.7 | — | — | — | 21.2 | 4.4 |
| CoLoRMap | 668 145 143 | 99.9 | 99.9 | 99.8 | 47.5 | 45.6 | 99.7 | 1.3 | 53.2 |
| ECTools | 429 253 952 | 99.9 | 99.4 | 99.8 | 26.8 | 26.7 | 99.9 | 90.6 | 11.2 |
| HGAP | 452 022 161 | 99.9 | 99.5 | 99.9 | 32.0 | 29.4 | 99.7 | 6.3 | 16.8 |
| LoRMA | 896 121 171 | 99.9 | 99.9 | 99.9 | 64.1 | 63.1 | 99.4 | 7.5 | 68.2 |
| FALCONa | 603 240 666 | 96.3 | 99.6 | 99.9 | — | — | — | 1.5 | 75.4 |
| Canu | 388 286 736 | 95.0 | 99.3 | 99.9 | 27.4 | 24.6 | 99.6 | 3.4 | 4.6 |
| Canu+ | 893 339 818 | 96.6 | 99.4 | 99.9 | 63.0 | 56.7 | 99.1 | 4.5 | 5.2 |
| MECAT | 726 605 009 | 99.9 | 99.6 | 99.9 | 51.4 | 47.6 | 99.4 | 0.3 | 8.5 |
| FLAS | 1 032 185 610 | 99.9 | 99.6 | 99.9 | 73.2 | 67.7 | 99.2 | 0.6 | 8.5 |
| (c) Long reads of A.thaliana (18 557 597 273 bp) | |||||||||
| PBcRa | 9 166 306 215 | 99.3 | 99.8 | 99.9 | — | — | — | 320.6 | 38.9 |
| CoLoRMap | 9 734 458 732 | 99.6 | 99.8 | 99.9 | 57.6 | 51.1 | 93.7 | 24.4 | 102.4 |
| FALCONa | 12 110 519 562 | 99.9 | 99.3 | 99.9 | — | — | — | 80.8 | 104.2 |
| Canu | 4 090 897 122 | 99.8 | 99.1 | 99.9 | 23.9 | 19.9 | 99.4 | 28.5 | 44.3 |
| Canu+ | 9 119 913 928 | 99.7 | 99.0 | 99.9 | 53.1 | 41.7 | 98.3 | 68.4 | 48.4 |
| MECAT | 10 373 391 686 | 99.9 | 99.4 | 99.9 | 61.0 | 52.7 | 98.6 | 6.7 | 13.8 |
| FLAS | 15 618 210 837 | 99.7 | 99.2 | 99.9 | 91.7 | 79.0 | 97.9 | 16.2 | 13.8 |
| (d) Long reads of human (168 421 410 338 bp) | |||||||||
| MECAT | 74 946 808 568 | 97.3 | 99.7 | 98.7 | 43.4 | 37.3 | 99.1 | 163.4 | 24.9 |
| FLAS | 93 838 595 967 | 97.2 | 99.6 | 98.9 | 54.3 | 46.4 | 98.8 | 370.0 | 24.9 |
Note: The long reads in tests (a)–(d) are from E.coli, S.cerevisiae, A.thaliana and human, respectively. The corrected long reads by MECAT and FLAS (below dashed line), and the other self-correction algorithms HGAP, LoRMA, FALCON, Canu and Canu+ (above dashed line), and by short read assisted correction algorithms PBcR, CoLoRMap and ECTools (in gray) using additional short reads are compared in each test. The best result for the self-correction algorithms in each column is shown in boldface. The performance measurements are listed in Section 3.2.2.
Some measurements are not available without the correspondence information between the uncorrected long reads and corrected ones.
Results on the S.cerevisiae long reads are listed in Table 1b. The throughput of FLAS is 42.1% larger than MECAT. FLAS is 3–13× faster than the other self-correction algorithms HGAP, LoRMA, FALCON, Canu and Canu+, and the throughput of FLAS is also 15.2–165.8% larger than all of them. Results on the A.thaliana long reads are listed in Table 1c. The throughput of FLAS is 50.6% larger than MECAT. FLAS is 2–5× faster than the other self-correction algorithms FALCON, Canu and Canu+, and the throughput of FLAS is also 29.0–281.8% larger than all of them. Results on the human long reads are listed in Table 1d. The throughput of FLAS is 25.2% larger than MECAT. Note that results of ECTools, HGAP and LoRMA on the A.thaliana long reads are not shown, because they were designed for relatively small genomes and could not finish processing for the larger genome within relatively short time. These results indicate FLAS can achieve high throughput while keeping MECAT’s fast speed.
3.3.2 Results with various long-read coverage and parameter settings
Results with various coverage of the E.coli long reads are listed in Supplementary Table S1. For all the algorithms, the throughput and running time increase together with the coverage. For all the coverage, the throughput of FLAS is 15.2–22.4% larger than MECAT. In general, FLAS is 2–11× faster than the other self-correction algorithms HGAP, LoRMA, FALCON Canu and Canu+, and the throughput of FLAS is also 9.8–249.0% larger. These results indicate FLAS is scalable and efficient with various long-read coverage.
Results with various parameter settings are not shown, because difference of the results is within <5% and relatively small. The difference with various α1 and α2 is small, because their influence is within algorithm step 1b, while the remaining algorithm steps 2a and 2b are complementary to this step. The difference with various β1 and β2 is also small, because it is not a dominating situation to align one long-read region to multiple paths of the overlap graph in algorithm step 2b. However, this does not downgrade the importance to decide the correct paths in this step. As shown in Figure 2, on the E.coli long reads, a long-read region in the 12 033th long read from target genome region [3 203 249; 3 205 477] could be aligned to two paths of genome regions [1 428 679; 1 430 845] and [3 203 249; 3 205 477], and FLAS can find the correct path of genome region [3 203 249; 3 205 477] for it. In addition, a long-read region in the 20 672th long read from target genome region [3 181 373; 3 182 998] could be aligned to three paths of genome regions [2 079 308; 2 080 933], [3 181 373; 3 182 998] and [4 364 860; 4 366 488], and FLAS can also find the correct path of genome region [3 181 373; 3 182 998] for it.
![Illustrations on FLAS’s function in finding correct paths on the E.coli long reads. (A) A long-read region in the 12 033th long read from target genome region [3 203 249; 3 205 477] could be aligned to two paths of genome regions [1 428 679; 1 430 845] and [3 203 249; 3 205 477] (shaded), and FLAS can find the correct path of genome region [3 203 249; 3 205 477] for it. (B) A long-read region in the 20 672th long read from target genome region [3 181 373; 3 182 998] could be aligned to three paths of genome regions [2 079 308; 2 080 933], [3 181 373; 3 182 998] and [4 364 860; 4 366 488] (shaded), and FLAS can also find the correct path of genome region [3 181 373; 3 182 998] for it](https://oup.silverchair-cdn.com/oup/backfile/Content_public/Journal/bioinformatics/35/20/10.1093_bioinformatics_btz206/2/m_bioinformatics_35_20_3953_f2.jpeg?Expires=1716347084&Signature=uv81OrNAfMjJZ4w0-9-LTUdAO24hX2Yu6X9Gpd5voLkaGODPvyOn16XaAlqe6XDupmYPjz0zOOGxSy5Uy2FPINtDokfvWDF6ksVwRT7OlZEdsHrQgvZ2YX2tyeiAnuCqO63bLz2CzUAiUBwFABehx7~YWsQn7YJeq1V-pB0AYEmr~hKHDKCzMKq~voH~iShusSgOax9~9QilHFGpeRK6eMpo3ZMzDGfGBtg7std-2RMR379VTlshKkkAtl29xOxfNtEvq4EdSXspxlFkaztKHdrJt5ikYlcAsn2yR1zIDcPf4fy8gbVFbQmkck0BkHHQseto0Zf~-NqVWOilTbVpyg__&Key-Pair-Id=APKAIE5G5CRDK6RD3PGA)
Illustrations on FLAS’s function in finding correct paths on the E.coli long reads. (A) A long-read region in the 12 033th long read from target genome region [3 203 249; 3 205 477] could be aligned to two paths of genome regions [1 428 679; 1 430 845] and [3 203 249; 3 205 477] (shaded), and FLAS can find the correct path of genome region [3 203 249; 3 205 477] for it. (B) A long-read region in the 20 672th long read from target genome region [3 181 373; 3 182 998] could be aligned to three paths of genome regions [2 079 308; 2 080 933], [3 181 373; 3 182 998] and [4 364 860; 4 366 488] (shaded), and FLAS can also find the correct path of genome region [3 181 373; 3 182 998] for it
3.3.3 Results of long-read assemblies
Results on the S.cerevisiae long reads are listed in Table 2a and b and 18–20 contigs are assembled from the MECAT corrected long reads, of N50 sizes 720 657–777 561 bp and max contig sizes 1 075 704–1 537 692 bp, while 16–20 contigs are assembled from the FLAS corrected long reads, of N50 sizes 912 129–927 803 bp and max contig sizes 1 526 323–1 544 348 bp. The N50 sizes with FLAS are 19.3–26.6% larger than MECAT, and the max contig sizes are 41.9% larger or comparable. Results on the A.thaliana long reads are listed in Table 2c and d. The N50 sizes with FLAS are 13.1–29.8% larger than MECAT, and the max contig sizes are comparable. Interestingly, the numbers of contigs with FLAS are a little larger than MECAT. This is probably because more alleles could be assembled from the FLAS corrected long reads.
Evaluation of long-read assemblies
| Method | Assembly size (bp) | N Contigs | N50 size (bp) | N N50 | Max contig size (bp) |
|---|---|---|---|---|---|
| (a) Contigs of S.cerevisiae by FALCON* | |||||
| MECAT | 11 986 444 | 18 | 777 561 | 6 | 1 537 692 |
| FLAS | 12 080 029 | 16 | 927 803 | 6 | 1 544 348 |
| (b) Contigs of S.cerevisiae by Canu* | |||||
| MECAT | 11 949 806 | 20 | 720 657 | 7 | 1 075 704 |
| FLAS | 11 976 512 | 20 | 912 129 | 6 | 1 526 323 |
| (c) Contigs of A.thaliana by FALCON* | |||||
| MECAT | 120 803 609 | 64 | 10 410 339 | 5 | 15 926 937 |
| FLAS | 121 875 742 | 81 | 11 775 451 | 5 | 15 950 055 |
| (d) Contigs of A.thaliana by Canu* | |||||
| MECAT | 120 987 757 | 60 | 9 028 586 | 5 | 15 898 934 |
| FLAS | 122 399 256 | 89 | 11 721 501 | 5 | 15 900 235 |
Note: The contigs in tests (a)–(d) are of S.cerevisiae or A.thaliana by FALCON* or Canu*, assembled from the MECAT and FLAS corrected long reads. The contigs from MECAT corrected long reads and those from FLAS corrected long reads are compared in each test. The best result in each column is shown in boldface. The performance measurements are listed in Section 3.2.2.
Figure 3 shows MUMmer plots of the A.thaliana contigs by Canu*, assembled from the MECAT corrected long reads and FLAS corrected long reads, respectively. As shown in the plots, the latter contigs are as accurate as the former. Supplementary Figures S1, S2 and S3 show the remaining plots, and similar results can be observed in each figure. These results indicate FLAS corrected long reads can be assembled into quality contigs.
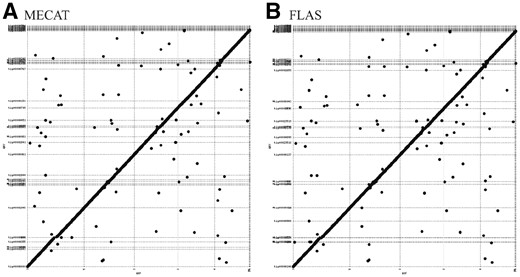
MUMmer plots of the A.thaliana contigs by Canu*, assembled from the MECAT corrected long reads (A) and FLAS corrected long reads (B), respectively
4 Conclusions
This study introduces FLAS, a wrapper algorithm of MECAT, to achieve high-throughput long-read self-correction while keeping MECAT’s fast speed. FLAS finds maximal cliques in an overlap graph constructed from MECAT prealigned long reads, and refines the alignments for correction. FLAS also aligns the long reads to paths of a second overlap graph constructed from the corrected long-read regions for further correction, considering not only alignment identities but also expected amounts of aligned long reads to the paths. As a result, FLAS can achieve 22.0–50.6% larger throughput than MECAT. Compared to the self-correction algorithms other than MECAT, FLAS is 2–13× faster than all of them, and its throughput is also 9.8–281.8% larger. The FLAS corrected long reads can be assembled into contigs of 13.1–29.8% larger N50 sizes than MECAT. In the future, we will adapt FLAS to process long reads of different characteristics from other platforms, e.g. Oxford Nanopore platform.
Acknowledgements
We thank Lingxiao Lan in our group, for implementing the Error Correction Evaluation Toolkit for split long reads. We acknowledge the support of core facilities at the Institute for Integrative Genome Biology (IIGB), the University of California, Riverside.
Funding
This work was supported by grants from the National Natural Science Foundation of China [61502027 to E.B.]; and the Fundamental Research Funds for the Central Universities [2015RC045 to E.B.].
Conflict of Interest: none declared.
References

