


Abstract
The past few years have seen the emergence of nanopore-based sequencing technologies which interrogate single molecule of DNA and generate reads sequentially.
In this paper, we demonstrate that, thanks to the sequentiality of the nanopore process, the data generated in the first tens of minutes of a typical MinION/GridION run can be exploited to resolve the alterations of a human genome at a karyotype level with a resolution in the order of tens of Mb, while the data produced in the first 6–12 h allow to obtain a resolution comparable to currently available array-based technologies, and thanks to a novel probabilistic approach are capable to predict the allelic fraction of genomic alteration with high accuracy. To exploit the unique characteristics of nanopore sequencing data we developed a novel software tool, Nano-GLADIATOR, that is capable to perform copy number variants/alterations detection and allelic fraction prediction during the sequencing run (‘On-line’ mode) and after experiment completion (‘Off-line’ mode). We tested Nano-GLADIATOR on publicly available (‘Off-line’ mode) and on novel whole genome sequencing dataset generated with MinION device (‘On-line’ mode) showing that our tool is capable to perform real-time copy number alterations detection obtaining good results with respect to other state-of-the-art tools.
Nano-GLADIATOR is freely available at https://sourceforge.net/projects/nanogladiator/.
Supplementary data are available at Bioinformatics online.
1 Introduction
Copy number variants/alterations (CNVs/CNAs) are genomic rearrangements that involve DNA segments of at least 50 bp (Alkan et al., 2011) that can be present at a variable copy number in comparison with a reference genome.
CNVs have been demonstrated to be one of the main sources of genomic variation in humans and pathogenic CNVs have been found to be associated with autism (Sanders et al., 2012), neurological disorders (Pippucci et al., 2015), Crohn’s disease (McCarroll et al., 2008a) and cancer (Campbell et al., 2008) and they are also suspected to be associated with complex diseases such as type I diabetes (Craddock et al., 2010) and cardiovascular disease (Fahed et al., 2013). Moreover, somatic copy number alterations are common in cancer and the analysis of cancer genomes led to the identification of recurrent somatic copy number alterations in specific cancer types (Beroukhim et al., 2010), and, in some instances, of cancer causing-genes which are targets for tailored therapeutic approaches (Ciriello et al., 2013).
At present, CNVs/CNAs detection can be performed with microarray platforms or by exploiting data generated by second-generation sequencing (SGS) technologies. The high-density CGH-arrays (aCGH) and single nucleotide polymorphism genotyping arrays afford a level of resolution that allows CNV boundaries to be called with relatively high precision at a genome-wide level. For instance, currently available array platforms, that consist of more than 1 million probes, have a lower limit of detection of 5–25 kb (McCarroll et al., 2008b). Over the past decade, the introduction of SGS technologies has revolutionized our capability to study CNVs/CNAs. Whole-genome sequencing combined with sophisticated computational strategies such as read count (RC), paired end or split read approaches improved CNVs detection, allowing base-pair resolution of breakpoints.
However, both microarray and SGS techniques are based on very long and complex experimental recipes that require several days to obtain results. At present, several commercial SNP-array (Illumina and Affymetrix) and aCGH (Agilent and Nimblegen) platforms are available and the workflow time of these different platforms ranges from 2 to 4 days. Similarly, library preparation for SGS experiments requires from 24 h to 3 days (Buermans and Den Dunnen, 2014), and although the sequencing run of the latest SGS platforms can take <1 day (e.g. 18 h for a 75 bp paired end run of a Illumina NextSeq500), the total time from DNA extraction to results can require more than 2 weeks. Remarkably, the parallel nature of sequencing by synthesis and sequencing by ligation approaches (that sequences simultaneously each read) imposes to use data only at the end of the experiment run.
In this scenario, the turnaround times for the diagnostic use of these technologies are in the range of weeks, which makes standardized and widespread implementation difficult and hinders timely diagnostic applications (decision making). Moreover, the use of these platforms requires very high starting investments (100 000 $), thus limiting the use of these technologies to large laboratories.
The past few years have seen the emergence of a third-generation sequencing technology based on nanopores (Magi et al., 2017) which interrogates single molecule of DNA and is capable to produce sequences much longer than those generated by SGS methods. The basic principle of nanopore sequencing relies the transit of a DNA molecule through a nanoscopic pore and the contemporary measurement of its effect on an electric current.
The Oxford Nanopore Technologies (ONT) MinION and GridION are the first commercially available devices that use nanopores as biosensor to sequence very long single-stranded DNA molecule. In particular, the MinION is a pocket-sized (90 g and 10 cm in length) device that costs only $1000. A typical MinION/GridION run usually takes from 24 to 48 h, but thanks to the sequential nature of the nanopore process, reads are continuously generated and, unlike SGS data that require the completion of the run, they can be used for further analysis while the sequencing process is ongoing.
In this paper, we demonstrate that, thanks to the sequentiality of the nanopore process, the data generated in the first tens of minutes of a MinION/GridION run can be exploited to study the karyotype of a human cancer genome and are sufficient to detect large chromosomal alterations with a resolution in the order of tens of Mb, thus revolutionizing molecular karyotyping. Moreover, we show that the data produced in the first 6–12 h of a sequencing run can be used to identify CNVs/CNAs with an accuracy comparable to currently available array-based technologies, and thanks to a novel probabilistic approach described in this manuscript, allow to predict the allelic fraction of genomic alteration with high accuracy.
To fully exploit the unique characteristics of nanopore sequencing data, all the computational methods developed in this paper have been packaged in a publicly available software tool, Nano-GLADIATOR (Nanopore Genomic aLterations AnD allelIc frAcTiOn pRedictor), that is capable to perform CNVs/CNAs detection and allelic fraction prediction during the sequencing run (‘On-line’ mode for real-time molecular karyotyping) and once the experiment is completed (‘Off-line’ mode, for parallel analysis of multiple samples).
In ‘On-line’ mode the tool must be launched simultaneously to a nanopore experiment so that, by exploiting the data flow generated during the sequencing process, it can perform real-time CNVs/CNAs detection. In ‘Off-line’ mode Nano-GLADIATOR can be used to perform parallelized analysis of multiple runs at once for the identification of germline CNVs and somatic CNAs. To demonstrate the power of our tool in analyzing nanopore whole genome sequencing (WGS) data, we tested Nano-GLADIATOR in ‘Off-line’ mode on a publicly available cancer dataset and in ‘On-line’ mode for the real-time analysis of MinION runs on six hematological samples and we compared its performance with three state-of-the-art methods previously devised for the analysis of SGS data.
2 Materials and methods
2.1 Allele fraction prediction (FractionPred)
Nanopore sequencing process is a stochastic process in which each read is sequenced randomly and independently from any location of the genome and the number of reads mapping into a window of the reference genome is proportional to the number of times the region appears in the DNA sample and follows a Poisson distribution.
Under this assumption, for a sequencing run that generated N reads, we can expect sequences in a two-copies region of size L, in a one-copy region of size L and in a three-copies region of size L, where G is the total size of the genome ( bp for a human genome). These considerations can be extended to alterations that affect only a fraction x of the cell populations: for a one-copy region of size L present in a fraction x of the cell population we can expect reads, while for a three-copy region we can expect .
Following these assumptions, we can estimate the allele fraction x of any segmented region R of the genome by finding the x that maximizes:
for three-copy regions
for one-copy regions
where NR is the number of reads in region R and .
To this end, for each region R segmented by the shifting level models (SLM) algorithm, we first count the total number of reads NR, we then generate a set of values of xi, , and for each xi we calculate the probability that NR belongs to a Poisson distribution with mean A(xi, , where . In order to estimate the 95% confidence interval we also calculate .
The values xi that maximize the three Poisson distributions give an estimate of the allele fraction and its 95% confidence interval. Clearly, the larger the number of reads the higher the accuracy with which we will be able to estimate xi and its confidence interval.
These approaches can be easily extended to the analysis of pairs of test/matched normal samples (paired mode), by replacing the Poisson distribution with the Skellam distribution that tests the difference between the number of reads aligned in region R for Test (NRTest) and control (NRControl) samples:
for three-copy regions
for one-copy regions
where and .
2.2 Hematologic malignancies dataset
MinION runs were performed on six samples with hematologic malignancies selected from our sample bank with signed informed consent. Two samples were from patients diagnosed with acute myeloid leukemia (AML) and four samples from myeloproliferative neoplasm (MN) patients (See Supplementary Methods for more details).
3 Results
3.1 Nanopore sequencing and RC approach
The current ONT flow-cells, the cartridges where DNA samples are inserted, contain 2048 individual protein nanopores arranged in 512 channels, each containing four pores and sensors. While the earliest MinION flow-cells (R6.0) allowed to generate a total yield in the order of tens of Mb, the more recent R9.4 and R9.5 improved the throughput to 10–20 Gb allowing to sequence a full human genome at 3–4× of sequencing coverage.
A typical MinION run usually takes 48 h, and our experience with R9.4.1 flow-cells on MinION and GridION devices demonstrates that the sequencing throughput generates an average of 20 000 reads within the first 10 min and reaches 100 000 reads after 1 h and almost 500 000 reads at 6 h (Fig. 1a). Remarkably, thanks to the sequentiality of the nanopore process, these reads can be exploited for further analysis during the sequencing process.
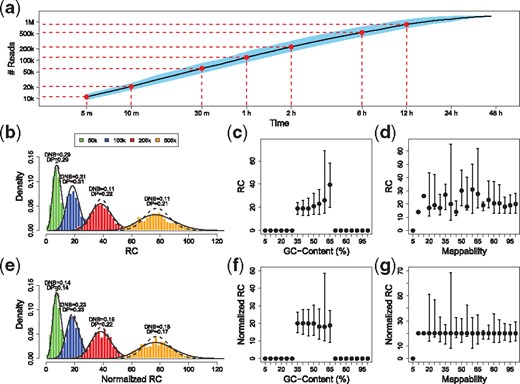
Nanopore sequencing throughput and RC distribution. Panel (a) shows the average number of reads (both pass and fail reads) generated during a typical MinION/GridION sequencing run with R9.4 flow-cells. Data are averaged across 10 runs performed on human samples with R9.4.1 flow-cells on MinION and GridION devices (5 MinION and 5 GridION runs). Panels (b) and (e) show the histograms of RC data for different time points of a nanopore sequencing run with the superimposed Poisson (dashed lines) and negative binomial (solid lines), before (b) and after (e) normalization. The distance between RC and Poisson (DP) and negative binomial (DNB) distributions are calculated with the Kolmogorov–Smirnov statistic D. Panels (c) and (d) report the correlation between RC data and GC-content % and mappability. Panels (f) and (g) show the effect of median normalization approach on GC-content % and mappability
Recently (Magi et al., 2017), we demonstrated that nanopore sequencing is a uniform process that generates sequences randomly and independently without classical sources of bias such as guanine-cytosine (GC)-content and mappability. Thanks to these properties, nanopore data can be used to detect genomic regions involved in CNVs/CNAS with the RC approach, outperforming SGS/Illumina data in terms of both sensitivity and specificity.
The RC approach is based on the simple idea that during the sequencing process the reads are randomly and independently sequenced from any location of the genome. Under this assumption the number of reads mapping into a window of the reference genome should be proportional to the number of times the region appears in the DNA sample and the copy number of any genomic region can be estimated by calculating the RC of reads aligned to consecutive and non-overlapping windows of the genome.
To study the properties of RC data distribution, we exploited the sequencing data produced in our own experiments with the R9.4.1 chemistry. In particular, for each run, we generated datasets that represent the sequencing process at different time points (5, 10, 30 min, 1, 3, 6 and 12 h) and calculated RC for different window sizes followed by analysis of their correlation with local GC-content and mappability (defined as the inverse of the number of times that a sequence originating from any position in the reference genome maps to the genome itself).
The correlation between RC and GC-content % has been previously reported in several papers for SGS data and it is mainly caused by the amplification step of the sequencing process, while mappability bias is due to the fact that the genome contains many repetitive elements and aligning reads to these positions may lead to ambiguous mapping.
The results summarized in Figure 1b are in accordance with those reported in Magi et al. (2017) and show that RC data are slightly affected by GC and mappability biases and can be well approximated by means of a Poisson distribution without the need to use the more complex negative binomial distribution (the Kolmogorov–Smirnov statistics for Poisson and Negative binomial are very similar) as for SGS data.
However, despite the small effect of these two biases, RCs need to be normalized to make data comparable within and between samples and their effect can be well minimized by using the median normalization approach (Magi et al., 2012) (see Supplementary Methods). The results reported in Figure 1d and e demonstrate that median normalization approaches are able to mitigate the effect of the two sources of bias, equalizing the mean level of each bin to the same master mean and reducing the distance (Kolmogorov–Smirnov statistics) between RC and Poisson distribution.
3.2 RC data and copy number detection
Once the RCs have been corrected for local GC-content and mappability and ordered for genomic position, the data that we obtain are noisy signals in which deletions or duplications are identified as decrease or increase of RC across multiple consecutive windows. Owing to the noisy nature of RC genomic profiles, the detection of CNVs/CNAs requires very sophisticated algorithmic recipes capable to detect the boundaries (segmentation) of increased or decreased multiple consecutive RC windows.
To this end, we exploited a very powerful segmentation algorithm, based on SLM (Magi et al., 2010), previously developed by us for the analysis of genomic profiles generated by array-CGH and SGS data (see Supplementary Methods).
In order to understand the capability of normalized RC data to detect deletions and duplications as a function of number of read/sequencing time, we exploited the data produced by the nanopore WGS consortium (NWC) (Jain et al., 2018) (see Section 2 for more details) for the NA12878 sample and we generated seven nanopore datasets made of N reads (with N = 10 000, 20 000, 50 000, 100 000, 200 000, 500 000 and 1 000 000) that mimic the nanopore sequencing process at different time points (5, 10, 30 min, 1, 2, 6 and 12 h).
All the seven datasets were then aligned to the human reference genome (see Supplementary Methods) and elaborated by Xome-Blender (Semeraro et al., 2018) to generate synthetic duplications and deletions of different sizes (50, 100, 200, 500 kb, 1 2, 5, 10, 20 Mb). Finally, for each synthetic genome generated by Xome-Blender, we calculated RC for different window sizes (50, 100, 200, 500 kb, 1 and 2 Mb) and RC were further corrected for GC-content and mappability bias, median normalized to two-copies and then log-transformed.
All the genomic profiles were then segmented with SLM algorithm and with the state-of-the-art circular binary segmentation (CBS) approach (Venkatraman and Olshen, 2007). To assess the accuracy of the two methods in detecting CNVs at the boundaries (breakpoints detection) we computed the receiver operating characteristic curve as in Magi et al. (2010). The results summarized in Supplementary Figures S1–S24 evidence that our segmentation algorithm outperforms the CBS method in terms of both sensitivity and specificity for all the alteration sizes and number of reads we simulated.
As a further step, in order to evaluate the sensitivity and specificity of the two algorithms in detecting alterations of different length as a function of window size and number of reads we calculated true positive (TP) rate and number of false positive (FP) events as in Magi et al. (2013): a detected segment is considered a TP if it shows an overlap larger than 50% between the detected segment and the synthetic altered region, while it is considered a FP if there is no overlap with a synthetic altered region.
As expected, the results summarized in Figure 2A and B and Supplementary Figures S25–S48 show that higher the number of reads and higher is the resolution in detecting genomic alterations. In particular, sequencing datasets made of more than 500 000 reads gives a resolution below 1 Mb (allowing to detect CNAs as long as 500 kb), while datasets with <50 000 reads limit the resolution to alterations in the order of 10/20 Mb.
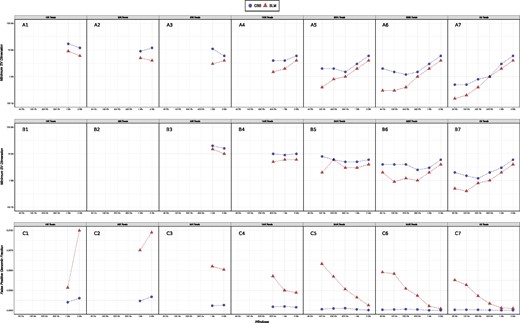
RCs and CNVs/CNAs detection. Panels A1–A7 (B1–B7) report the minimum detectable deletion size (duplication) for different window length and different number of sequenced reads. The minimum detectable size is calculated as the minimum size for which TP rate is larger than 0.9. Panels C1–C7 report the average genomic fraction of FP events detected for window length and different number of sequenced reads. Genomic fraction is calculated as the ratio between the total size of FP events and the size of the human genome (3 Gb)
In terms of sequencing time this means that 30 min of run are sufficient to study and detect genomic alterations in the order of tens of Mb, while for reaching the resolution of a microarray we need a 1 day run. Above analyses also show that deletions are detected with higher sensitivity than duplications and this is in accordance to the results previously obtained for SGS data and can be mainly ascribed to the fact that the variance of RC data is lower for 1-copy regions and it proportionally increases with copy number values: the larger is the variance and the smaller is the sensitivity of segmentation algorithms in detecting signal shifts.
Finally, our results show that, although SLM detects a slightly higher fraction of small FP events (Fig. 2C), it outperforms CBS in the detection of both deletions and duplications for all window sizes.
3.3 Allelic fraction prediction
The clonal theory of cancer progression (Nowell, 1976) states that cancer cells descend from a founder cell and that descendants acquire mutations through a process of selection and clonal expansion. For this reason, a tumor is made of cell populations, each containing a different complement of somatic mutations: clonal mutations from the founder cell and sub-clonal mutations that occurred after the most recent clonal expansion. In this scenario, the identification of low-allelic variants and the accurate estimation of their allele fraction are of fundamental importance for the study of sub-clonal evolution in cancer.
Since the sequencing process is a stochastic process in which reads are randomly and independently sampled from the genomes of a population of cells, the larger the number of reads (throughput) generated during a sequencing experiments the higher the probability that these reads contain/belong to variants with low allele fraction (belonging to small number of cells in the cell population).
Concerning small variants (substitutions and small insertions and deletions), the capability to estimate allele fraction is directly dependent on local coverage, since the higher the number of reads aligned to variant position the higher the probability to accurately estimate the proportion of cells containing the variant, especially when they are present in small fraction of cells (low-allelic fractions). For this reason, the identification of somatic variants with very low-allelic fraction in cancer is usually performed with panel/target sequencing at ultra-high sequencing coverages that can reach even 5000–10 000× (Duncavage et al., 2012).
On the contrary, since CNVs/CNAs involve large segments of genome, they cause alterations in the alignments of thousands to millions of reads, thereby providing many data points for allelic fraction estimation even for relatively small events and low sequencing coverages. However, at present, although several methods have been developed to reconstruct the sub-clonal architecture of samples, the majority of these tools including SciClone (Miller et al., 2014), TITAN (Ha et al., 2014) and PhyloWGS (Deshwar et al., 2015), combine CNA information with single nucleotide allelic frequency (B-allele fraction) thus limiting their use to high coverage data. Moreover, since all these methods have been properly devised for the analysis of cancer somatic alterations they require a matched control sample and cannot be used for single sample analysis.
In order to overcome the limits of currently available methods, we introduce a very simple approach that takes into account only CNA information, works with ultra-low sequencing coverage data and can be applied to both single and paired samples analyses. In ‘Nanopore sequencing and RC approach’ section we demonstrated that nanopore sequencing process is a stochastic process in which each read is sequenced randomly and independently from any location of the genome and that the number of reads mapping into a window of the reference genome is proportional to the number of times the region appears in the DNA sample following a Poisson distribution.
Under this assumption, for a sequencing run that generates N reads, we can expect sequences in a two-copies region of size L, in a one-copy region of size L and in a three-copies region of size L, where G is the total size of the genome ( bp for a human genome). These considerations can be extended to alterations that affect only a fraction x of the cell populations, where for a one-copy region of size L present in a fraction x of the cell population we can expect reads, while for a three-copy region we can expect .
Following these assumptions, the fraction x of each duplication (deletion) can be estimated by finding the x that maximizes () where NR is the number of reads in the region and A is the expected number of reads for a two-copies region of the same size (see Section 2 for more details). Similarly, we can extend this approach to paired sample analysis by using the Skellam distribution that is the distribution of the difference of two statistically independent Poisson-distributed random variables (see Section 2 for more details).
In order to evaluate the capability of our approach of predicting the allelic fraction of duplications and deletions of different size, we used Xome-Blender to generate synthetic genomes with different proportion of normal/tumor samples. In particular, by using the sequencing runs generated by the NWC (https://github.com/nanopore-wgs-consortium) for the NA12878 sample, we simulated nanopore WGS experiments with different number of reads N (N = 10 000, 20 000, 50 000, 100 000, 200 000, 500 000 and 1 000 000, that mimic the sequencing run at different time points: 5, 10, 30 min, 1, 2, 6 and 12 h) and genomic alterations (duplications and deletions of different sizes: 1, 2, 5, 10 and 20 Mb) at different allelic fractions (90, 80, 70, 60, 50, 40, 30, 20, 10 %).
Synthetic genomes were analyzed with four different window sizes (100, 200, 500 Kb and 1 Mb) and by applying our fraction prediction method, FractionPred, in single sample (Poisson distribution) and in paired sample (Skellam distribution) mode (by using as control a NWC run subsampled at the same number of reads of the simulated run). The results of these analyses, summarized in Figure 3 and Supplementary Figures S49–S53, clearly show that our model produces reliable estimation of allelic fraction.
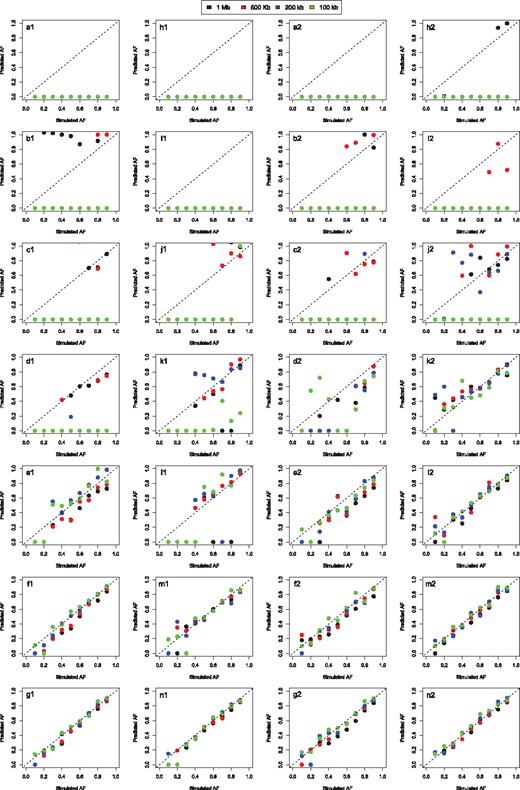
Allelic fraction prediction results. In panels are reported the correlations between the allelic fractions simulated by Xome-blender and the allelic fractions predicted by our novel probabilistic method FractionPred. Panels (a1–n1) report the results for single sample analysis, (a1–g1) for deletions and (h1–n1) for duplications, while panels (a2–n2) report the results for paired sample analysis, (a2–g2) for deletions and (h2–n2) for duplications. Each panel row report prediction results for different number of simulated reads: N=10 000 (a1, h1, a2, h2), N=20 000 (b1, i1, b2, i2), N=50 000 (c1, j1, c2, j2), N=100 000 (d1, k1, d2, k2), N=200 000 (e1, l1, e2, l2), N=500 000 (f1, m1, f2, m2), N=1 00 000 (g1, m1, g2, m2). Colors reported in legend represent the four window sizes used in the analyses
Globally, for (panels f1–g1, m1–n1, f2–g2 and m2–n2 of Fig. 3) FractionPred is capable to correctly estimate low-allelic fraction (10–20%) alterations. Conversely, when the number of reads decreases, our approach loses its power allowing only the estimation of high allelic fraction alterations (80–90% for N = 50–100 k, panels c1–d1, j1–k1, c2–d2, j2–k2). Similarly, the larger the size of genomic alteration the more accurate is the prediction of its allelic fraction (Supplementary Figs S25–S29): the allelic fraction of CNAs smaller than 5 Mb can be reliably predicted only with large number of reads (≥), while for large CNAs (≥ Mb) allelic fraction can be well estimated even with smaller number of reads (100 000). Remarkably, the estimation accuracy obtained with single and paired mode are very similar, demonstrating that we can perform molecular karyotyping without the need of matched normal sample.
3.4 Nano-GLADIATOR tool
The median normalization procedure, the SLM algorithm and the FractionPred method described in previous sections have been packaged in the Nano-GLADIATOR software tool. Nano-GLADIATOR is a collection of perl, python, R and fortran codes and its computational architecture has been derived from our experience in the development of CNVs/CNAs detection tools from SGS data (EXCAVATOR, EXCAVATOR2 and XCAVATOR). Nano-GLADIATOR allows to analyze WGS data generated during a MinION or GridION X5 run in two different modality that are ‘On-line’ and ‘Off-line’ mode (Fig. 4, see Supplementary Methods for more details).
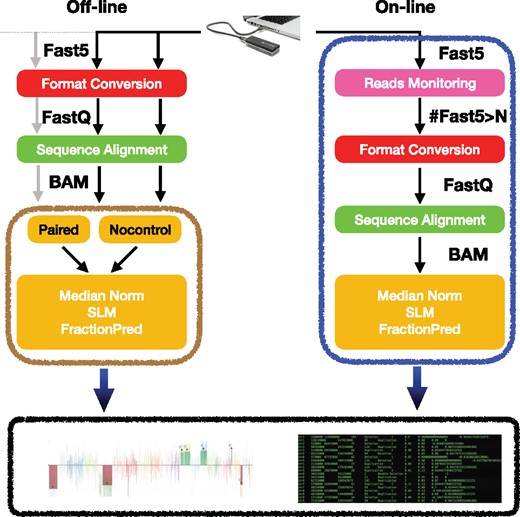
Nano-GLADIATOR workflow. Nano-GLADIATOR allows to analyze WGS data generated by MinION or GridION X5 devices in two different modality that are ‘On-line’ and ‘Off-line’ mode. In ‘On-line’ mode the tool is launched simultaneously to a nanopore experiment and takes as input the data flow generated by the sequencing process and when the number of reads reaches a predefined threshold it starts the preliminary analysis that consists in converting reads to FastQ (i), aligning to reference genome (ii), generating and normalizing RC data, segmenting RC profiles with SLM and then predicting allelic fraction with FractionPred with Poisson. In ‘Off-line’ modality Nano-GLADIATOR takes as input multiple BAM files and allows to analyze them in parallel with two experimental/computational strategies: ‘paired’ and ‘nocontrol’. In ‘nocontrol’ mode each sample is analyzed individually, while in ‘paired’ mode each test sample needs a matched normal sample. The output of the Nano-GLADIATOR tool is a tab-delimited file containing information for each segmented region and an interactive html file that shows log2RCNorm data, segmentation results and allelic fraction prediction for all analyzed chromosomes
3.5 Real data analysis
At present, there is no publicly available software tool that is capable to exploit the unique characteristics of ONT sequencing devices to detect CNVs/CNAs with the RC approach, as all the tools introduced in literature were developed to use data produced by SGS platforms. Moreover, the great majority of currently available methods, that include FREEC (Boeva et al., 2012), CNANorm (Gusnanto et al., 2012), HMMCopy (Ha et al., 2012) and BICSeq2 (Xi et al., 2016), were developed to detect somatic CNAs in cancer and need a pair of tumor and matched normal samples to be run.
To show the power of our novel tool to detect CNAs from nanopore data, we used it to analyze a publicly available dataset generated by Euskirchen et al. (2017) and an home-made dataset made of six MinION runs generated in our laboratory (Table 1). Euskirchen et al. (2017) explored the potential of ultra-low-pass WGS nanopore experiments to molecularly characterize the genome of Brain tumors Gliomas. To this end, they sequenced seven samples that were previously characterized with Illumina SNP-array data, by using 6 h runs of the MinION Mk 1B device and R9 or R9.4 flow-cells obtaining an average of 50 k reads for each sample (ranking from 15 to 80 k). Owing to the small number of reads generated during each experiment this dataset represents a very challenging benchmark for testing algorithms performance.
Hematologic malignancies table
| Sample code | Disease | Karyotype | Total reads | Pass reads | Time |
|---|---|---|---|---|---|
| Sample 1 | MN | del(7)(q22), del(12)(p13)del(12)(q23) | 100 000 | 85 340 | 1 h 12 m |
| Sample 2 | MN | del(20)(q) | 100 000 | 92 011 | 0 h 54 m |
| Sample 3 | AML | del(9)(q22) | 500 000 | 473 245 | 5 h 48 m |
| Sample 4 | MN | +8; +9 | 100 000 | 93 781 | 0 h 57 m |
| Sample 5 | MN | +6, +7, +8, +9, +15, +21q, +1q | 1 000 000 | 927 892 | 12 h 32 m |
| Sample 6 | AML | −Y | 100 000 | 64 726 | 1 h 22 m |
Note: Table reports information about the six hematologic malignancies samples used for ‘on-line’ analysis. For each sample, columns report the disease (AML and MN), the karyotype, the total number of reads generated during the MinION runs, the number of reads (pass reads) used for the analysis and the time (Time) at which Nano-GLADIATOR started the analysis.
To demonstrate the capability of Nano-GLADIATOR to exploit the sequentiality of the nanopore process and perform real-time molecular karyotyping of cancer samples (without the need of a matched control sample), we made six MinION experiments (four MNs and two AML samples, see Table 1 for more details) by using the R9.4.1 flow-cells (see Section 2 for more details about experimental protocol and primary analysis).
Although in their original paper Euskirchen et al. analyzed the Glioma dataset by using NA12878 nanopore data as matched control sample, we decided to run Nano-GLADIATOR in ‘nocontrol’ (without the need of a normal control sample) and with a window size of 1 Mb in ‘Off-line’ mode. Conversely, the six runs performed in our lab were analyzed in real time by using the ‘On-line’ mode: in four experiments we decided to perform CNAs detection after the generation of 100 000 reads (around 1 h of sequencing run, Table 1) with a window size of 1 Mb, while for the other two runs CNAs discovery was started after the generation of 500 000 (around 6 h) and 1 000 000 (around 12 h) reads, respectively, with a window size of 100 kb. Also in this case, Nano-GLADIATOR analysis was set in ‘nocontrol’ mode.
In order to validate the results obtained with MinION data, we used the Illumina SNP-array data generated by Euskirchen et al. (2017) for gliomas and Agilent aCGH 188 k for the six hematologic malignancies of our dataset. As a first step, to evaluate the accuracy of the genomic profiles generated by our method, we compared the median values of each segmented region with the obtained by SNP array and aCGH experiments performed on the same samples (see Supplementary Methods for more details).
The results summarized in Figure 5 show that even for ultra-low- (Fig. 5a) and low-throughput (Fig. 5d) sequencing runs (an average of 50 k reads for Euskirchen et al., and 100 k reads for our dataset) there is an high correlation (R = 0.7) between RCs and array genomic profiles that reaches R = 0.9 for high-throughput data (Fig. 5g), demonstrating the robustness of our experimental/computational strategy.
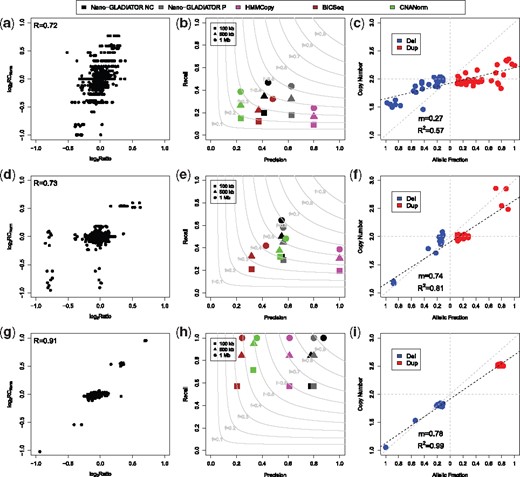
Nano-GLADIATOR results on real cancer Nanopore data. Panels (a), (d) and (g) show the correlation between the and the of genomic segments detected by our computational pipeline, for ultra-low-throughput (a) data in ‘Off-line mode’, low-throughput data (d) in ‘On-line’ mode and high-throughput data (g) in ‘On-Line’ mode. Panels (b), (e) and (h) report precision and recall obtained by the four tools in detecting CNAs for ultra-low-throughput (b), low-throughput (e) and high-throughput (h). The analyses of HMMCopy, BICSeq2 and CNANorm were performed in paired mode by using N12878 data as control, while Nano-GLADIATOR was used in both paired (P) and nocontrol (NC, with N12878 data as control) modes. Light gray curves represent F-measure levels (harmonic mean of precision and recall). Panels (c), (f) and (i) report the correlation between the allelic fraction predicted by FractionPred and the copy number values obtained by microarray data. Dotted black lines represent the linear regression model fitted on data. Dotted gray lines represent the theoretical 1:1 ratio between copy number and allelic fraction. For each region, copy number values from array data have been obtained by rescaling the median value of to two-copies with the following formula:
As a further step, to test the capability of our approach to identify genomic alterations, we calculated precision and recall by using array data as gold standard and we compared these results with those obtained by other three state-of-the-art tools (CNANorm, HMMCopy and BICSeq2, see Supplementary Methods for more details). To measure the performance of the four tools, we calculated precision as the ratio between the number of correctly detected events (the intersection between the tool calls and the validation set calls) and the total number of events detected by each method, while recall was calculated as the ratio between the number of correctly detected events and the total number of events in the validation set.
To demonstrate the versatility of our software tool, Nano-GLADIATOR was also ran in ‘paired’ mode by using as matched normal controls downsampled dataset of the NA12878 sequenced by the NWC (see Supplementary Methods for more details). The results reported in Figure 5b, e and h demonstrate that our approach obtains good results with respect to the other tools in terms of F-measure (tradeoff between precision and recall) for both low- and high-throughput experiment and this performance was obtained by using Nano-GLADIATOR in nocontrol and paired modes (see Supplementary Methods). Remarkably, the use of a matched normal sample (paired mode) slightly changes the performance of our tool in low and high-throughput runs, with the exception of ultra-low-throughput experiments where the precision increases from 0.4 to 0.6. In particular, in ‘On-line’ analysis, Nano-GLADIATOR was capable to identify more than 60% of gold-standard alterations larger than 1 Mb with a 1 h run, and 100% of gold-standard alterations with 6/12 h runs, recognizing complex chromosomal profiles that were missed by the other tools. For example, in the analysis of Sample 1, just after the first hour of sequencing, our tool was capable to detect five consecutive deletions of chromosome 6 that were not identified by CNANorm, HMMCopy and BICSeq2 (Supplementary Fig. S54).
As a final step, to show the accuracy of our approach in predicting the allelic fraction of CNAs with real nanopore sequencing data, we compared predicted fractions with the median values from aCGH (the rescaled copy number). In accordance with the results obtained in ‘Allelic fraction prediction’ section, the capability to correctly predict the allelic fraction of genomic alterations strongly depends on the experimental throughput.
In ultra-low-throughput dataset (with an average number of reads below 50 k, Fig. 5c) the slope of the linear regression line is m = 0.34 (far from the ideal value of m = 1), while for low- and high-throughput datasets (Fig. 5f and i), the slope increases to m = 0.74 and m = 0.78 (much closer to m = 1). Moreover, also the R-squared statistic increases with the number of analyzed reads, reaching for high-throughput dataset and demonstrating that the larger the number of analyzed reads, the higher the capability to correctly predict the allelic fraction of genomic alterations. Remarkably, for high-throughput dataset even small predicted fraction (0.1–0.2) strongly correlates with array data.
Taken as a whole, these results demonstrate that Nano-GLADIATOR is a very good tool for the detection of CNVs/CNAs with nanopore data: in ‘On-line’ mode it reaches a resolution that in the first hour of the sequencing process can reliably identify complex chromosomal alterations, while after 6 h it is capable to perform single sample molecular karyotyping in real time without the need of matched control samples and with a resolution comparable to currently available microarray platforms.
4 Discussion and conclusion
The development of nanopore strand-sequencing as a portable (MinION) or benchtop instrument (GridION X5) and its commercial diffusion in the scientific community through an independent beta-testing program (the MinION Access Program) is going to revolutionize genomics. At present, despite the limited number of papers published in scientific journals that make use of nanopore data, this technology has been successfully used for several applications that range from bacterial to human cancer genomics.
In just 4 years from the beginning of the MinION Access Program, the total throughput of a nanopore sequencing run raised from tens of Mb to 10–20 Gb and the read accuracy from 60 to 95%; thanks to these improvements and to the sequentiality of the nanopore process the novel R9.4.1 flow-cells are capable to generate around 100 000 reads every hour that can be readily used for human whole-genome applications.
Here we demonstrate that the nanopore sequencing is a uniform process that generates sequences randomly and independently without classical sources of bias such as GC-content and mappability and thanks to these properties nanopore data can be used to detect genomic regions involved in CNVs/CNAs and predict their allelic fraction with high accuracy by using the RC approach.
To fully exploit the properties of ONT devices and data, we developed a novel software tool, Nano-GLADIATOR, that is capable to analyze nanopore data in ‘On-line’ mode allowing to perform CNVs/CNAs detection and allelic fraction prediction in real time during the sequencing run. Nano-GLADIATOR combines a normalization scheme and state-of-the-art segmentation algorithm, previously developed by us for SGS data, with a novel probabilistic model that is capable to predict the allelic fraction of genomic alterations with high accuracy. Our tool also allows to handle nanopore data of multiple single samples or pairs of test/matched controls in ‘Off-line’ modality for the study of germline or somatic CNVs/CNAs.
To show the power and versatility of Nano-GLADIATOR to detect CNAs from nanopore WGS data, we used it in ‘Off-line’ mode to analyze an ultra-low throughput publicly available cancer dataset and in ‘On-line’ mode on the real-time analysis of six MinION runs on hematological malignancies samples. The results obtained by these analyses clearly demonstrate that the algorithms at the base of our tool outperform other state-of-the-arts methods in terms F-measure in the detection of altered genomic regions. Moreover, the ‘On-line’ modality of Nano-GLADIATOR is capable to resolve complex chromosomal rearrangements with data generated in the very first hours of the sequencing process and without the need of matched normal sample.
These results, combined with rapid library preparation kits that allow to obtain ready to sequence genomic DNA in <10 min, are going to revolutionize the turnaround times for the diagnostic use of molecular karyotype. In the near future, with the advent of novel Flongle adapter https://nanoporetech.com/products/flongle and the improvement of flow-cells throughput it will be possible to perform low-cost and high resolution molecular karyotype within an hour from sample extraction, allowing nanopore sequencing to be exploited for ultra-fast precision oncology applications and non-invasive/invasive prenatal diagnosis. At present, we are improving the ‘On-line’ modality of Nano-GLADIATOR to analyze multiple nanopore experiments simultaneously on the GridION device for the real-time detection of somatic CNAs (paired mode).
Funding
This work was supported by the Associazione Italiana per la Ricerca sul Cancro [AIRC Investigator Grant 20307, ‘Third Generation Cancer Genomics’]; and by AIRC 5x1000 call ‘Metastatic disease: the key unmet need in oncology’ to MYNERVA project, #21267 (MYeloid NEoplasms Research Venture AIRC). A detailed description of the MYNERVA project is available at http://www.progettoagimm.it.
Conflict of Interest: none declared.
References
Author notes
The authors wish it to be known that, in their opinion, Alberto Magi and Davide Bolognini authors should be regarded as Joint First Authors.

