


Abstract
Mass spectrometry (MS) is widely used for isotopic studies of metabolism and other (bio)chemical processes. Quantitative applications in systems and synthetic biology require to correct the raw MS data for the contribution of naturally occurring isotopes. Several tools are available to correct low-resolution MS data, and recent developments made substantial improvements by introducing resolution-dependent correction methods, hence opening the way to the correction of high-resolution MS (HRMS) data. Nevertheless, current HRMS correction methods partly fail to determine which isotopic species are resolved from the tracer isotopologues and should thus be corrected. We present an updated version of our isotope correction software (IsoCor) with a novel correction algorithm which ensures to accurately exploit any chemical species with any isotopic tracer, at any MS resolution. IsoCor v2 also includes a novel graphical user interface for intuitive use by end-users and a command-line interface to streamline integration into existing pipelines.
IsoCor v2 is implemented in Python 3 and was tested on Windows, Unix and MacOS platforms. The source code and the documentation are freely distributed under GPL3 license at https://github.com/MetaSys-LISBP/IsoCor/ and https://isocor.readthedocs.io/.
1 Introduction
Mass spectrometry (MS) is extensively used for isotopic studies of metabolism and other (bio)chemical processes. During the last decades, quantitative approaches based on isotope labeling experiments (ILE)—e.g. 13C-metabolic flux analysis—have been increasingly used in systems and synthetic biology to infer the topology and operation of biological networks. In such experiments, different labeled forms—isotopologues—of metabolites are quantified from their isotopic clusters in MS spectra. These clusters also contain information on all other isotopes that occur at natural abundance in the molecules. To extract meaningful labeling information—isotopologue distribution—the contribution of naturally-occurring isotopes has first to be removed (Midani et al., 2017). Several tools were developed to correct isotopic clusters measured with low resolution instruments (R < 1000) (Midani et al., 2017; Millard et al., 2012). Carreer et al. (2013) proposed a method for the correction of ultra-high resolution (R > 400 000) MS data. However, it is applicable to the correction of only a few elements with no more than two isotopes (C, N or H) and is restricted to ultra-high resolution instruments. Similarly, the correction method implemented in IsoCorrectoR (Heinrich et al., 2018) is restricted to the correction of either low resolution or ultra-high resolution data. AccuCor (Su et al., 2017) made possible the correction of MS data at any resolution in 13C, 2H or 15N-ILEs. However, AccuCor is also limited to a few elements and the proposed correction method fails in particular situations (see below). Hence, there was no method to ensure in all situations accurate correction of HRMS data collected with modern MS instruments.
Here, we present a major update of IsoCor to correct MS data, which ensures accurate correction in all cases since it can handle any chemical species, for any isotopic tracer, at any MS resolution.
2 Materials and Methods
State-of-the-art correction methods are based on a correction matrix that relates isotopologue distribution to the measured mass fractions. As detailed in Midani et al. (2017), each element (i, j) of the correction matrix must contain the abundance of all isotopic species of the molecule containing j tracer atoms which are unresolved from the mass fraction corresponding to the ith tracer isotopologue. van Winden et al. (2002) proposed an elegant formalism to construct low resolution correction matrices by multiplying correction matrices of individual elements. Su et al. (2017) extended this formalism for HRMS by accounting for isotopic mass defects, which denote the difference between the exact mass of an atom and the nearest integer (Thurman and Ferrer, 2010). When constructing the matrices for individual elements, Su et al. (2017) determine which isotopologues of a given element are resolved from the tracer isotopologues and should thus be corrected. However, information on the total isotopic mass defects of each isotopic species of the molecule—and thus information on the ability of the MS analyzer to distinguish them—is lost when elements are combined during matrix multiplication. This may result in overcorrecting the data when individual mass defects cumulate (e.g. 13C + 15N), as illustrated below and in Figure 1, or in under correcting the data when individual mass defects cancel each other out (e.g. 18O + 34S).
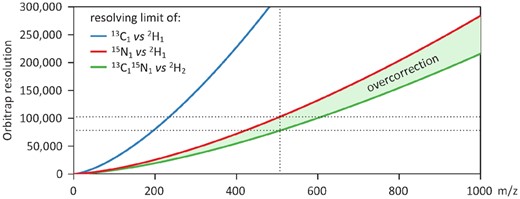
Example of overcorrection of isotopic data measured at high-resolution on an Orbitrap. For 2H labeling experiments, the resolving limits of 13C1 and 15N1 versus 2H1 isotopologues are shown in blue and red, respectively, as detailed in Su et al. (2017). Taking ATP as an example (at m/z = 506, vertical dotted line), mass fractions must be corrected for the contribution of individual 13C and 15N isotopes to M1 at resolutions below 323 000 and 102 000, respectively (i.e. below the resolving limits of 13C and 15N isotopes). State-of-the-art algorithms also correct for the combined contribution of all individually-unresolved isotopes, and will thus correct for the contribution of 1N1 to M2. However, the resolving limit of 1N1 from M2 is even lower than the resolving limits of individual isotopes (78 000, green line). 1N1 is thus resolved at resolutions between 78 000 and 102 000, and its contribution should not be corrected. State-of-the-art algorithms thus systematically overcorrect ATP mass fractions measured in this range of resolutions (green area), which unfortunately typically stands in the high-resolution area. Note that there is no such problem at ultra-high resolution or at low-resolution (Color version of this figure is available at Bioinformatics online.)
IsoCor v2 implements a novel algorithm to account for these effects (Fig. 2). Briefly, each element (i, j) of the correction matrix is obtained by (i) calculating the exact masses and corresponding abundances of all the isotopic species of the molecule containing j tracer atoms—using combinatorial probabilities (van Winden et al., 2002)—and (ii) summing the abundance of the species which cannot be distinguished from the mass fraction of the ith tracer isotopologue, according to the operating resolution of the instrument. This algorithm takes into account the ion’s charge when constructing the correction matrix, hence allowing correction of singly and multiply-charged ions. Elements (i, j) may also include (or not) the isotopic impurity of the tracer and natural abundance of the tracer element depending whether their contribution has to be corrected.
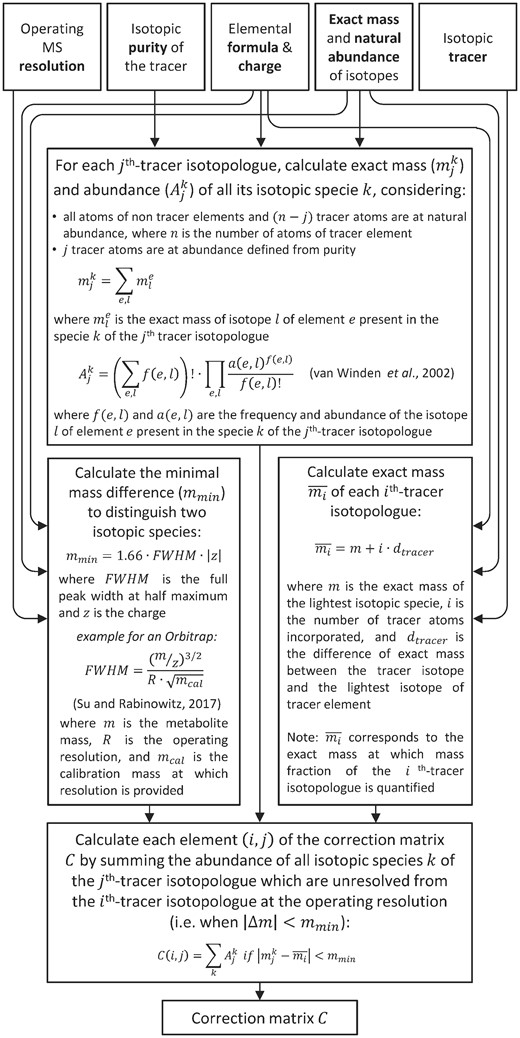
Algorithm implemented in IsoCor v2 to construct accurate correction matrices at any MS resolution (option ‘High-resolution’)
Finally, Equation (1) is solved using the L-BFGS-B algorithm (Byrd et al., 1995), with the lower boundary of corrected mass fractions constrained to 0 to avoid negative values. The cost function is defined as the sum of the squared weighted errors, and the stopping criterion is fixed to 10−10. The isotopologue distribution is obtained by normalizing the vector of corrected mass fractions to 1.
3 Results
As an illustrative example, we used IsoCor and AccuCor to correct 1880 15N-mass fractions (94 mass fractions from 22 metabolites in 20 samples) quantified on an Orbitrap at a resolution of 140 000 (dataset provided as example with AccuCor). Differences between the two correction methods are shown in Figure 3.
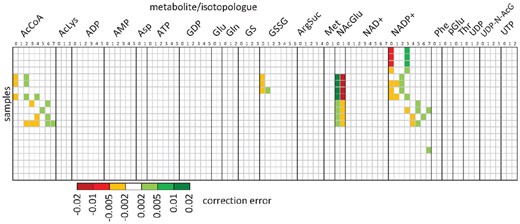
Comparison of AccuCor and IsoCor correction results. Differences between 15N-isotopologue distributions calculated by AccuCor and IsoCor from 94 mass fractions of 22 metabolites (columns) in 20 samples (rows)
The improvement brought by IsoCor v2 is highly dependent on the metabolite and on the sample, consistently with theoretical considerations. AccuCor is accurate in most of the tested cases (with errors <0.002), but the correction error increased up to 0.014—i.e. similar to the accuracy and precision that can be reached on an Orbitrap (Heuillet et al., 2018; Su et al., 2017)—for four metabolites (acetylCoA, glutathione disulfide, N-acetyl-glutamate and NADP+). Even low yet systematic isotopic biases may lead to significant flux errors or biased interpretations (e.g. when evaluating the goodness of fit), as previously reported (Antoniewicz et al., 2006; Mairinger et al., 2018; Su et al., 2017). Importantly, the discrepancy observed in this illustrative example should not be considered as a higher bound since it is directly related to the isotopic tracer, metabolite, or resolution. The algorithm improvement made in IsoCor ensures to prevent such biases in all situations.
4 Conclusion
We present a major update of IsoCor to process low- and high-resolution mass spectrometry data. IsoCor v2 allows correction to be applied to any chemical species and can be used to exploit any isotopic tracer at any resolution. IsoCor v2 includes a graphical user interface for intuitive use and a command-line interface to streamline its integration into existing pipelines. Moreover, IsoCor v2 implements a novel algorithm which ensures accurate correction of HRMS data compared to state-of-the-art tools. We discussed current correction methods and showed that they fail to fully account for the additive nature of isotopic mass defects when constructing the correction matrix. The resulting biases depend on each situation (in terms of metabolite, isotopic tracer, MS resolution and labeling pattern) but should be prevented to fully exploit the accuracy of modern mass spectrometers. Such biases may turn out to be critical for quantitative downstream applications such as 13C-fluxomics. With this contribution, we aim at strengthening the reliability of isotopic data and thereby the biological value of isotope labeling experiments.
Acknowledgement
MetaboHub (ANR-11-INBS-0010, metabohub.fr) is gratefully acknowledged.
Funding
This work was supported by the French National Research Agency (project ENZINVIVO, ANR-16-CE11-0022) and by the European Union (ERA-CoBioTech’s project C1PRO, ANR-17-COBI-0003-05).
Conflict of Interest: none declared.
References
Author notes
The authors wish it to be known that, in their opinion, Pierre Millard and Baudoin Delépine authors should be regarded as Joint First Authors.

