-
PDF
- Split View
-
Views
-
Cite
Cite
Charles E Breeze, Alex P Reynolds, Jenny van Dongen, Ian Dunham, John Lazar, Shane Neph, Jeff Vierstra, Guillaume Bourque, Andrew E Teschendorff, John A Stamatoyannopoulos, Stephan Beck, eFORGE v2.0: updated analysis of cell type-specific signal in epigenomic data, Bioinformatics, Volume 35, Issue 22, November 2019, Pages 4767–4769, https://doi.org/10.1093/bioinformatics/btz456
Close - Share Icon Share
Abstract
The Illumina Infinium EPIC BeadChip is a new high-throughput array for DNA methylation analysis, extending the earlier 450k array by over 400 000 new sites. Previously, a method named eFORGE was developed to provide insights into cell type-specific and cell-composition effects for 450k data. Here, we present a significantly updated and improved version of eFORGE that can analyze both EPIC and 450k array data. New features include analysis of chromatin states, transcription factor motifs and DNase I footprints, providing tools for epigenome-wide association study interpretation and epigenome editing.
eFORGE v2.0 is implemented as a web tool available from https://eforge.altiusinstitute.org and https://eforge-tf.altiusinstitute.org/.
Supplementary data are available at Bioinformatics online.
1 Introduction
DNA methylation (DNAm) is the main epigenetic mark assayed in the study of human diseases. The new EPIC BeadChip developed by Illumina can detect DNAm at over 850 000 genomic sites, extending the promoter-centric coverage of the 450k array to enhancers identified by the ENCODE and FANTOM5 projects (Andersson et al., 2014; ENCODE Project Consortium, 2012), constituting a powerful and robust new tool for epigenome-wide association studies (EWAS) (Moran et al., 2016).
The original version of eFORGE (Breeze et al., 2016) employs multiple layers of epigenetic information, including data for open chromatin sites (DNase I hotspots) and histone marks (H3K4me1, H3K4me3, H3K27me3, H3K9me3 and H3K36me3) to detect cell types driving EWAS signal.
The updated version of eFORGE extends and enhances the tool, adding new features, such as simultaneous analysis across 15 chromatin states, detection of transcription factor (TF) motifs associated with EWAS signal, cumulative DNase I footprint analysis, EPIC array support and a browser to analyze TF occupancy in EWAS loci. Notably, we incorporate many of these features into a new web-based suite, eFORGE-TF, to aid the multilevel characterization of TF-associated EWAS mechanisms.
2 Description
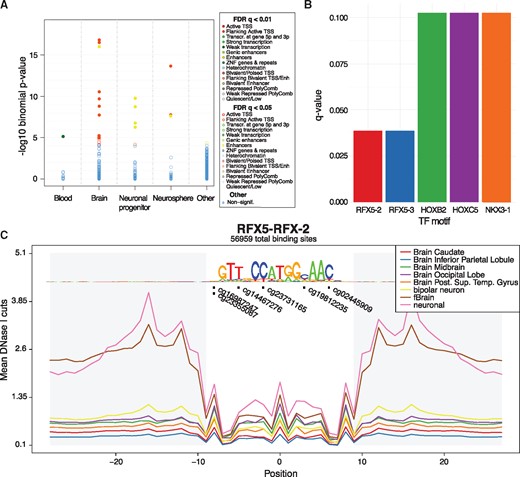
eFORGE v2.0 is a software tool written in Perl and Python. eFORGE takes a list of EWAS array probes, and tests them for overlap enrichment with epigenetic tracks using an extensive database of 815 individual datasets. eFORGE currently includes tracks for DNaseI hotspots, 5 histone marks and 15 chromatin states. Probes can be filtered using a 1-kb proximity filter, and can be input in either BED or probe ID format. Statistical enrichment analysis is performed using a binomial test against an array-specific background. eFORGE outputs key information including Benjamini–Yekutieli-corrected P-values, sample IDs and lists of probes overlapping tracks in each sample. Both static and interactive charts and tables are provided to view results (Fig. 1A).
eFORGE chromatin state enrichment analysis extends previous eFORGE analyses by breaking down cell type-specific signal into regulatory element classes (e.g. subcategories of promoters, enhancers and transcribed regions). Furthermore, the activity of many of these classes is known to be associated with the binding of sequence-specific TFs. Interestingly, DNAm changes can also result as a consequence of the binding of sequence-specific TFs (Smith and Meissner, 2013).
Output examples of eFORGE v2.0. (A) Enrichment in brain enhancers and TSS flanking chromatin states for the top 200 sites from an Illumina EPIC array study (Moran et al., 2016). (B) TF motifs with the highest enrichment for the top 1000 study probes, including two RFX5 motifs. (C) Distribution of study sites in aggregated RFX5 footprints from brain samples shows 6 of the 1000 top study probes overlapping 5 different positions within the motif (q-value =0.038, hypergeometric test, BY correction)
To break down cell type-specific signal into particular TF groups we have generated eFORGE-TF, a software suite that allows for TF analysis at three levels. First, it analyses the EWAS probe list for TF motif enrichment across all known TF motifs (Fig. 1B). This analysis can optionally be conditioned to DNase I footprints. Second, eFORGE-TF performs a cumulative analysis across an aggregated set of DNase I footprints to visualize DNAm changes in relation to particular basepairs of an aggregated footprint (Fig. 1C). Third, eFORGE-TF provides a locus-specific gallery to inspect individual probes using a combination of TF motifs and DNase I footprints. These three analysis levels provide a robust and comprehensive assessment of TF associations for a given EWAS probe list.
In each gallery panel, eFORGE-TF includes an interactive browser for locus-specific analysis. This browser overlays multiple levels of information, such as footprints, TF motifs and genomic coordinates, providing an in-depth view into the TF associations of a particular locus. Such a tool can aid both EWAS interpretation and epigenome editing approaches, which can benefit from the characterization of local TF binding sites (Voigt and Reinberg, 2013).
More details, including an example eFORGE analysis, are available (Supplementary Material).
3 Conclusion
This updated and improved version of eFORGE constitutes an extended and powerful tool for the analysis of Illumina EPIC and 450k array data.
Acknowledgements
We would like to acknowledge the IHEC Integrative analysis project for supporting this research.
Funding
C.E.B. was supported by a fellowship from the EU-FP7 project EpiTrain [316758]. Research in S.B.’s group was supported by the Wellcome Trust [99148]; Royal Society Wolfson Research Merit Award [WM100023] and EU-FP7 projects EpiTrain [316758]; EPIGENESYS [257082]; and BLUEPRINT [282510].
Conflict of Interest: none declared.
References
ENCODE Project Consortium (
Author notes
The authors wish it to be known that, in their opinion, Charles E. Breeze and Alex P. Reynolds should be regarded as Joint First Authors.


