


Abstract
Statistical dependencies are present in a variety of sequence data, but are not discernible from traditional sequence logos. Here, we present the R package DepLogo for visualizing inter-position dependencies in aligned sequence data as dependency logos. Dependency logos make dependency structures, which correspond to regular co-occurrences of symbols at dependent positions, visually perceptible. To this end, sequences are partitioned based on their symbols at highly dependent positions as measured by mutual information, and each partition obtains its own visual representation. We illustrate the utility of the DepLogo package in several use cases generating dependency logos from DNA, RNA and protein sequences.
The DepLogo R package is available from CRAN and its source code is available at https://github.com/Jstacs/DepLogo.
Supplementary data are available at Bioinformatics online.
1 Introduction
Sequence logos (Schneider and Stephens, 1990) are still the most prevalent way of visualizing sequence motifs. Sequence logos may be perceived either as a visualization of position weight matrix (PWM) models (Stormo et al., 1982), or as a compact representation of a set of aligned sequences. Like PWMs, sequence logos assume that the different positions of a motif are pairwise independent, which is not true for many types of motifs. For instance, dependencies are present in DNA-binding sites of transcription factors, one prominent example being CTCF (Eggeling et al., 2014), covariation of nucleotides appears in structured RNAs, or between amino acids of protein sequences.
Several attempts have been made to visualize dependencies in aligned sequence data. EnoLOGOS (Workman et al., 2005) and CircularLogo (Ye et al., 2017) visualize the strength of pairwise dependencies, but the exact dependency structure (i.e. information like ‘if position 5 is A then position 2 is likely C’) remains invisible. The visualizations of transcription factor flexible models (Mathelier and Wasserman, 2013), elastic net regularized logistic regression models (Yang and Chang, 2015), parsimonious context trees (Eggeling et al., 2017) or covariance models (Eggenhofer et al., 2018) provide extensive insights into dependency structures but are each closely tied to one specific class of statistical models.
Recently, we proposed dependency logos as an alternative way of visualizing dependencies in sequence data (Keilwagen and Grau, 2015). Dependency logos make dependency structures visually perceptible. They partition sequences by the symbols at those positions with the strongest dependencies. Dependencies between pairs of positions are measured by mutual information and the strength of the dependency at a certain position is defined as the sum of the N (user parameter) largest mutual information values to other positions. Similar to EnoLOGOS and CircularLogo, dependency logos include a representation of the strength of pairwise dependencies to guide the viewer towards the most prominent positions. They further comprise a traditional sequence logo to provide context and to assist the viewer in mapping symbols to colors. We present an annotated example of a dependency logo as Supplementary Figure S1, while further explanation of the method is given in Keilwagen and Grau (2015) and is also sketched in the package vignette. In addition, we provide a step-wise illustration of the partitioning algorithm in Supplementary Text S1.
DepLogo is applicable to DNA, RNA and protein sequences (Fig. 1),
the input data may contain gap symbols, allowing to apply DepLogo to multiple sequence alignments (Fig. 1A),
the strength of dependencies may be visualized by arcs or by a grid pattern connecting positions (Fig. 1A/B),
dependency structures are visualized by color charts, colored boxes representing data partitions or separate sequence logos for individual partitions (Fig. 1, Supplementary Fig. S2),
plotting functions are organized into high-level and low-level functions, allowing for a custom layout of sub-plots (Supplementary Fig. S3),
all plotting functions are highly customizable by a large number of user parameters and by custom implementations of plot functions (Supplementary Fig. S3),
auxiliary functions help to filter alignment columns by user-defined criteria or suggest distinguishable colors for different symbols (Supplementary Figs S4 and S5),
dependency logos may be annotated by a representation of sequence-assigned values, e.g. ChIP-seq peak statistics or other confidence measures (Fig. 1B).
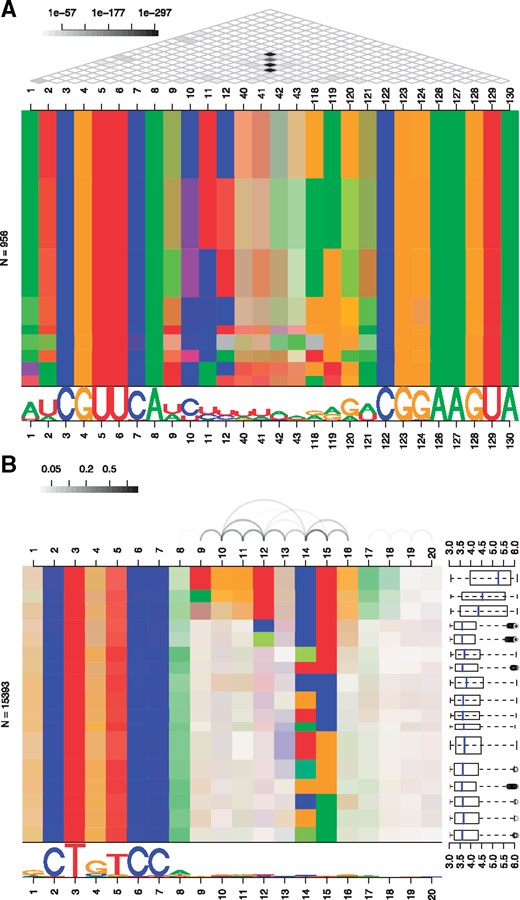
Examples of dependency logos. (A) Left stem loop of a riboswitch using a regular grid to represent dependency P-values. (B) Binding sites of the transcription factor NRSF predicted from ChIP-seq data with individual partitions annotated with ChIP-seq peak statistics
DepLogo comes with extensive documentation, a package vignette, example data and unit tests based on testthat (Wickham, 2011).
2 Use cases
We illustrate the utility of the DepLogo package for RNA, DNA and protein sequence data, also demonstrating the versatility of the different visualization options. In Figure 1A, we show a dependency logo of the alignment of the left stem loop of a glutamine riboswitch [RFAM (Kalvari et al., 2018) ID RF01739]. It is created from a vector of sequences x by (i) creating a DLData object, (ii) filtering alignment columns by the fraction of gaps and (iii) plotting the dependency logo with a grid pattern as follows:
data <- DLData(sequences = x,
symbols = alphabet.rna.gap$alphabet,
colors = alphabet.rna.gap$colors)
data.2 <- filterColumns(data, filter.by.gaps(0.1))
plotDeplogo(data.2, dep.fun = plotDepmatrix,
show.dependency.pvals = TRUE, maxNum = 4)
The dependency logo shows strong dependencies (i.e. covariation of nucleotides) between positions 9–12 and 118–121 as indicated by the black dots in the grid pattern at the top of the dependency logo. After partitioning the sequence data by the nucleotides at the most dependent positions, we can clearly derive rules like ‘if position 11 is U then position 119 is likely A’ or, more generally, complementarity of the nucleotides at those most dependent positions. Notably, these are exactly the bases that form a stem loop structure by complementary base pairing. A further example considering tRNA sequences is shown in Supplementary Figure S5.
In Figure 1B, we consider binding sites of the transcription factor NRSF/REST as predicted by Slim models (Keilwagen and Grau, 2015), which are capable of capturing long-range dependencies from ChIP-seq data. These data are also supplied as example data within the DepLogo package. Assuming that these data are stored in the data frame seqs, containing the sequences in the first and associated peak statistics in the second column, we call
data <- DLData(sequences = seqs[, 1],
weights = log1p(seqs[, 2]))
plotDeplogo(data, threshold = 0.03,
weight.fun = subBoxes)
In this case, we find the strongest dependencies among positions 9–16 of the extracted binding sites, which are represented by connecting arcs at the top of the dependency logo. We further recognize that the subset of sequences at the top of the dependency logo is highly conserved at these very positions as indicated by the strong colors of the corresponding blocks. We augment the plot by showing boxplots of the ChIP-seq peak statistics of the peak origins of the extracted binding sites. Notably, we find that sequences comprising the longer motif originate from peaks that are more strongly bound by NRSF according to the ChIP-seq data. In Supplementary Figure S6, we show examples for binding sites of the transcription factor c-Jun as predicted by Slim models, parsimonious Markov models (Eggeling et al., 2017) and Bayesian Markov models (Siebert and Söding, 2016) to illustrate that dependency logos are inherently model-agnostic.
Finally, we consider protein data, specifically the seed regions of Glycosyl transferases downloaded from Pfam (El-Gebali et al., 2019) (PFAM ID PF02885) shown in Supplementary Figure S4. Here, we find several co-varying positions with complex dependency structures.
3 Discussion
We present DepLogo, an R-package for visualizing dependency structures in aligned sequence data. DepLogo is applicable to all types of biological sequences, including DNA, RNA and protein sequences, but may also be applied to other types of sequential, categorical data using custom alphabet definitions. With parameter-rich plotting functions and a modular design of low-level sub-plots, DepLogo can be easily adjusted to specific data and application domains to generate publication-quality plots that represent the wealth of dependency structures that may be found in biological sequence data.
Conflict of Interest: none declared.
References

