


Abstract
High-throughput molecular profiles of human cells have been used in predictive computational approaches for stratification of healthy and malignant phenotypes and identification of their biological states. In this regard, pathway activities have been used as biological features in unsupervised and supervised learning schemes.
We developed SIGN (Similarity Identification in Gene expressioN), a flexible open-source R package facilitating the use of pathway activities and their expression patterns to identify similarities between biological samples. We defined a new measure, the transcriptional similarity coefficient, which captures similarity of gene expression patterns, instead of quantifying overall activity, in biological pathways between the samples. To demonstrate the utility of SIGN in biomedical research, we establish that SIGN discriminates subtypes of breast tumors and patients with good or poor overall survival. SIGN outperforms the best models in DREAM challenge in predicting survival of breast cancer patients using the data from the Molecular Taxonomy of Breast Cancer International Consortium. In summary, SIGN can be used as a new tool for interrogating pathway activity and gene expression patterns in unsupervised and supervised learning schemes to improve prognostic risk estimation for cancer patients by the biomedical research community.
An open-source R package is available (https://cran.r-project.org/web/packages/SIGN/).
1 Introduction
Messenger RNA (mRNA) expression is an important feature representative of the biological state of a cell or cell population. Activity of tissue-specific genes, master regulatory factors, tumor suppressor and oncogenes can play important roles in variety of healthy and disease phenotypes (Campbell and Marlow, 2013; Chatterjee and Vinson, 2012; Spitz and Furlong, 2012). External stress, such as drug treatment, hypoxia or other microenvironmental conditions of a tissue affect the mRNA transcription in cancer cells (Bindra et al., 2005; Razorenova and Giaccia, 2010).
Enrichment of pathways and their activity have been used as features in machine learning frameworks to predict identity of cells, mechanism of action of drugs or mechanism of resistance of cancer cells (Karr et al., 2012; Michelson and Young, 2011; Silberberg et al., 2012). To facilitate this process, we developed SIGN (Similarity Identification in Gene expressioN) as an open-source R package. The expression profiles of biological samples can be transformed to features at the pathway level using pathway enrichment scoring approaches like single-sample Gene Set Enrichment Analysis (GSEA) (Barbie et al., 2009; Subramanian et al., 2005) and Gene Set Variation Analysis (GSVA) (Hänzelmann et al., 2013). These features are then used in a centroid classification scheme for supervised learning tasks. We further introduce the transcriptional similarity coefficient (TSC), an estimator of gene expression pattern similarity of pathway activity between biological samples based on the RV statistic (Smilde et al., 2009). We used SIGN to classify breast tumors into subtypes and predict survival of patients in the Molecular Taxonomy of Breast Cancer International Consortium (METABRIC) cohort (Curtis et al., 2012). We show that SIGN yields higher performance with respect to the top performing approaches from the community DREAM challenge for breast cancer survival prediction (Margolin et al., 2013).
2 Materials and methods
We applied SIGN for subtype clustering and patient survival prediction using the transcriptomic profiles of patient tumors. The underlying centroid classification within SIGN is used to stratify patients with good survival from poor survival patients relying on gene expression profiles of their corresponding tumors. We further hypothesized that gene expression patterns, biological pathways as the relative expression of genes within the pathway, are determinants of cell identity. We defined TSC as a new way for comparing patterns of expression of biological pathways between tumors. Widely used pathway databases, such as KEGG and Reactome as well as Gene Ontology (GO) terms can be used as set of pathways in SIGN. GO terms in level C5 with 10–30 number of genes are used in this study to identify the similarity between samples based on their gene expression pattern (Liberzon et al., 2011). We limited the number of genes in GO terms to exclude large GO terms (at the top of GO term hierarchy) that are parents of the GO terms in our study (at the bottom of the GO hierarchy).
2.1 Transcriptional similarity coefficient
2.2 Breast cancer subtype similarity
We used TSC as the measure of similarity of ESR1 and ERBB2 gene module activities (Haibe-Kains et al., 2012) between breast tumor samples in the discovery cohort of METABRIC. The similarities between the samples were used to identify total Euclidean distance between the samples and cluster them accordingly.
2.2 Survival analysis
2.3 Research reproducibility
SIGN is publicly available as an open-source R package (https://cran.r-project.org/web/packages/SIGN/) and the results of this article can be reproduced using the cloud-based computational reproducibility platform CodeOcean (http://bit.ly/2PMwegY).
3 Results
We leveraged the METABRIC dataset of breast cancer patients to test whether TSC can be used to recapitulate subtyping of breast cancer patients. We used TSC comparing expression patterns within signatures of luminal, basal and HER2+ breast cancer subtypes (Desmedt et al., 2008; Gendoo et al., 2016; Haibe-Kains et al., 2012) between tumor samples in discovery cohort of METABRIC. Clustering of the tumor samples relying on the identified TSCs agreed with different breast cancer subtyping methods, SCMOD2 (Haibe-Kains et al., 2012) and PAM50 (Parker et al., 2009), as well as histopathological status of ER and HER2 (Fig. 1A).
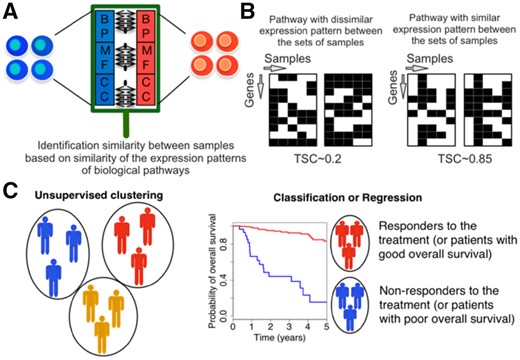
Schematic representation of Similarity Identification in Gene expressioN (SIGN) and transcriptional similarity coefficient (TSC). (A) Gene Ontology (GO) terms (BP: biological processes; MF: molecular functions; CC: cellular components), or other pathway datasets, are used to identify similarity between samples. (B) TSC is used to identify similarity of expression pattern of the genes within a given pathway between two sets of samples. (C) Collection of TSCs pathways between two sets of samples are used in unsupervised or supervised learning schemes
Comparing three subtypes of breast cancer including using TSC illustrated ability of TSC for identifying true similarities between breast tumor samples (Fig. 2A).
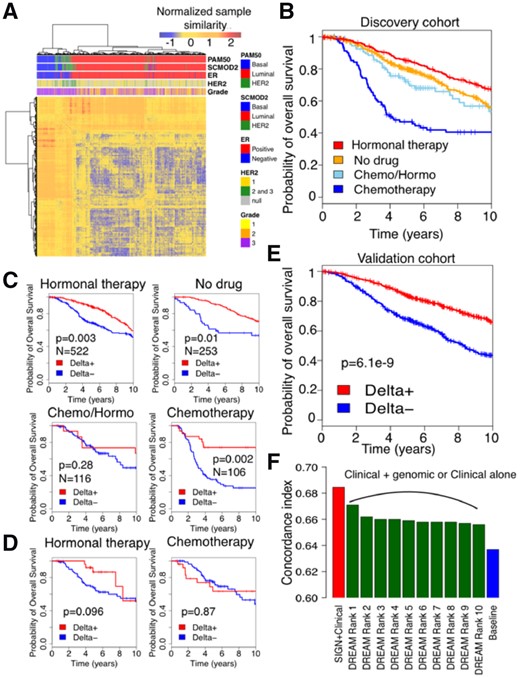
Patient stratification performance for discovery and validation cohort in Molecular Taxonomy of Breast Cancer International Consortium (METABRIC). (A) Clustering of tumor samples in discovery cohort of METABRIC using ESR1 and ERBB2 gene signatures (Gendoo et al., 2016) and TSC as the measure of distance between samples. (B) Survival of patients under different treatment regimens in discovery cohort of METABRIC. (C) Performance of SIGN on METABRIC discovery cohort stratified by treatments (log-rank test). (D) Performance of SIGN on predicting survival of patients under Chemotherapy+Hormonal therapy (Chemo/Hormo) in discovery cohort of METABRIC. (E) Performance of SIGN on METABRIC validation cohort. (F) Performance of SIGN with respect to the top 10 ranked methods in DREAM challenge (Bilal et al., 2013) in predicting patient survival in validation cohort in METABRIC using Discovery cohort. Baseline is cox model of clinical features
We further used overall survival as an endpoint to examine ability of SIGN, as a classification framework, using TSC as a measure of similarity in stratifying patients based on their risk. Breast tumors are traditionally categorized to different subtypes in clinical setting using their histopathological or genomic information (Curtis et al., 2012; Sotiriou et al., 2006). The patients in each subtype are then assigned to different therapeutics available and approved for that subtype (Table 1) (Goldhirsch et al., 2011). Hence, patients under different therapeutic regimen have different underlying biology and will have different survival rate (Fig. 2B). For example, patients with luminal breast cancer receive hormonal therapy and have higher survival rate with respect to patients with basal-like tumor type that receive chemotherapy (Table 1; Fig. 2B). To account for treatment differences, we applied SIGN, using TSC as measure of gene expression pattern similarity between patient gene expression profiles under similar therapeutic regimen in the discovery cohort of METABRIC.
Number of patients in each breast subtyping group, identified using SCMOD2 gene signatures (Haibe-Kains et al., 2012), in discovery cohort of METABRIC
| Subtype | Hormonal therapy | No drug | Chemo/Hormo | Chemotherapy |
|---|---|---|---|---|
| Luminal | 430 | 191 | 68 | 7 |
| HER2 | 40 | 16 | 13 | 29 |
| Basal | 26 | 33 | 22 | 64 |
| Subtype | Hormonal therapy | No drug | Chemo/Hormo | Chemotherapy |
|---|---|---|---|---|
| Luminal | 430 | 191 | 68 | 7 |
| HER2 | 40 | 16 | 13 | 29 |
| Basal | 26 | 33 | 22 | 64 |
We defined poor and good survival groups as the patients who die the earliest after diagnosis and the patients who survived the longest (10% of the cohort in each category). We then used the poor and good survival patient cohorts to train the model and check validity of the model in stratifying patients. We considered the rest of the population, patients with intermediate survival, as test set to assess the performance of SIGN in patient stratification. For each patient, the difference between the similarity with the poor and good groups is computed so that patients with positive Delta are predicted to have higher survival than the patients with negative Delta. We assessed the prognostic value of Delta using the log-rank test for each treatment group separately (Fig. 2C). SIGN yielded significant prognostic value for all the treatment groups of patients, under different therapeutic regimen, except the patients who received both hormonal therapy and chemotherapy (referred to as Chemo/Hormo; Fig. 2C). The patients under Chemo/Hormo are patients with aggressive luminal breast tumor who received chemotherapy upon showing low response to hormonal therapy. Tumors in this cohort of patients have high heterogeneity, and different underlying biology is potentially responsible for low response rate or even recurrence after hormonal therapy (Shipitsin et al., 2007). We examined use of patient tumor profiles under only hormonal therapy or chemotherapy for predicting survival of patients under Chemo/Hormo. Tumor profile of patients under hormonal therapy were more informative, with respect to patients under chemotherapy, for predicting survival of patients under chemo/hormonotherapy (Fig. 2D).
We validated performance of SIGN trying to predict survival of patients in the validation cohort of METABRIC (Curtis et al., 2012). SIGN could significantly predict survival of breast cancer patients in the validation cohort (Fig. 2E). We further compared the performance of SIGN with the best 10 predictive models from the DREAM challenge (Bilal et al., 2013), to predict breast cancer patient survival using gene expression profiles of tumors, that showcased SIGN as the best model (Fig. 2F). We further showed SIGN outperformed than the best 10 predictive models from the DREAM challenge to predict breast cancer patient survival. The baseline model is the cox regression model trained and tested using clinical features, such as ER status, HER2 status, tumor size, age, grade, Lymph node status and assigned treatment (Bilal et al., 2013). Moreover, PAM50 subtypes of breast tumor samples in discovery cohort of METABRIC were not significant predictors of survival if added to the baseline clinical model (P-value > 0.4).
In conclusion, SIGN is a classification tool that can be applied to predict cell identity and stratify patients based on their survival. With the increasing amount of gene expression and transcriptomic data, SIGN can be used in other applications, such as patient stratification across other cancer types, identification of different cell phenotypes and identification of mechanism of action of drugs using their genomic perturbation data (El-Hachem et al., 2017).
Acknowledgements
The authors thank the Molecular Taxonomy of Breast Cancer International Consortium (METABRIC) for sharing their valuable data with the scientific community.
Funding
This study was conducted with the support of the Cancer Research Society and the Ontario Institute for Cancer Research through funding provided by the Government of Ontario. S.A.M.T was supported by Connaught International Scholarships for Doctoral Students, Genome Canada and the Ontario Research Funds. V.S.K.M. was supported by the Cancer Research Society. B.H.K. was supported by the Gattuso-Slaight Personalized Cancer Medicine Fund at Princess Margaret Cancer Centre, the Natural Sciences and Engineering Research Council and the Canadian Institutes of Health Research.
Conflict of Interest: none declared.
References

