


Abstract
A variety of in silico tools have been developed and frequently used to aid high-throughput rapid variant classification, but their performances vary, and their ability to classify variants of uncertain significance were not systemically assessed previously due to lack of validation data. This has been changed recently by advances of functional assays, where functional impact of genetic changes can be measured in single-nucleotide resolution using saturation genome editing (SGE) assay.
We demonstrated the neural network model AIVAR (Artificial Intelligent VARiant classifier) was highly comparable to human experts on multiple verified datasets. Although highly accurate on known variants, AIVAR together with CADD and PhyloP showed non-significant concordance with SGE function scores. Moreover, our results indicated that neural network model trained from functional assay data may not produce accurate prediction on known variants.
All source code of AIVAR is deposited and freely available at https://github.com/TopGene/AIvar.
Supplementary data are available at Bioinformatics online.
1 Introduction
To identify disease-associated genetic variants for precision targeting is a major task for personalized medicine. Currently, genetic testing is often performed in a clinical laboratory to aid diagnosis and treatment decisions in various types of genetic disease (Richards et al., 2015). Advances in sequencing technologies have resulted in the generation of extensive amounts of sequencing data with high sensitivity, leading to an exponential discovery of new variants (Ritchie and Flicek, 2014). The rapidly enlarging pool of variants constantly provides new candidates for valuable findings; but meanwhile introduces a great challenge for genetic counseling: to recognize the true disease-causing variants amongst an almost million other irrelevant, harmless candidates. This requires an ability to correctly and promptly interpret or predict the clinical significance of different variants based on multiple patient-specific features (age, family history, etc.) and variant-specific features (the location of the variant, the functional change that the variant causes, the mutation type of the variant, etc.). The process of variant interpretation has proven to be complicated and relies heavily on human expertise, as it involves gathering diverse information from different sources (databases, annotation tools, predictive software, etc.) and weighting each individual piece of evidence to acquire a comprehensive estimate with sufficient confidence (Li and Wang, 2017).
Currently the gold standard for variant classification is the updated guideline (Richards et al., 2015) published in 2015 by the American College of Medical Genetics and Genomics and the Association for Molecular Pathology (ACMG-AMP). The guideline provides expert guidance and recommendations on terminology and interpretation criteria for a given variant. These criteria were implemented into a computational tool called InterVar by Li and Wang (2017) to facilitate standardized variant classification. Although the ACMG-AMP guideline is widely accepted and followed by genetic counselors and/or interpreters, its interpretation criteria rely heavily on prior knowledge of a given genetic variant (e.g. variant frequency in general population, variant database records, functional studies, published experimental evidence, segregation analysis, etc.). However, in the real world, there are many more variants with insufficient information to support their pathogenicity classification. These variants are known as ‘Variants of Uncertain Significance (VUS)’. VUS are not considered as useful information for clinical decision-making, which can cause confusion to physicians and patients, although over time these VUS may be resolved into other categories when supporting evidence is available.
There are mainly two approaches to infer, or predict, the pathogenicity of VUS. One is computational methods (known as ‘in silico prediction tools’), the other is functional assays. The first generation of in silico tools are based on conservation models [e.g. SIFT (Kumar et al., 2009), Polyphen (Adzhubei et al., 2010)] or statistic models [e.g. LRT (Chun and Fay, 2009), FATHMM (Shihab et al., 2013)], whereas the second generation often combines several models, and/or utilizes machine-learning algorithms [e.g. MutationTaster (Schwarz et al., 2014), CADD (Kircher et al., 2014), EIGEN (Ionita-Laza et al., 2016) and REVEL (Ioannidis et al., 2016)]. Although a great improvement in prediction accuracy on known datasets, their ability to predict pathogenicity of VUS have not been systemically verified due to lack of experimental data suitable for validation. Nevertheless, in silico tools remain as popular informative measures which are fast and usually open-access, allowing high-throughput variant interpretations. Functional assays are in vitro experiments that measure a variant’s functional impact on a gene/pathway level. Many different assays have been developed based on different principles (Findlay et al., 2018), such as pathway rescue, transcription activation, protein abundance and transcript abundance. Recently developed multiplex assays such as VAMP-Seq (Matreyek et al., 2018) and saturation genome editing (SGE) (Findlay et al., 2014, 2018), have improved the throughput of functional assays to thousands of variants per experiment, making a whole-gene level coverage possible. Advances in SGE has enabled measurement of functional impact at single-nucleotide resolution (Findlay et al., 2018), allowing direct bench-marking with in silico methods. Although functional studies are considered as powerful support of pathogenicity (Richards et al., 2015), these functional data are not always concordant with expert-reviewed classifications, and so far functional data are only restricted to partial exons of several genes e.g. BRCA1, PTEN, TPMT, EGFR (Findlay et al., 2018; Kohsaka et al., 2017; Matreyek et al., 2018).
From a user point of view, two questions are of interest about in silico methods: (i) Can they achieve comparable performance to human experts on known (validated) datasets? (ii) How is the concordance between an in silico tool and a functional assay? From a developer point of view, it would be interesting to test the hypothesis that (iii) can the combination of limited functional assay data and machine learning methods create a universal and highly accurate model?
To study these questions, we have performed a series of exploratory experiments. We took advantages of neural network methods and developed an in silico method, AIVAR (Artificial Intelligent VARiant classifier), which showed superior concordance with human experts on known datasets. We found low concordance between functional assay data and AIVAR as well as two other in silico tools, CADD (Kircher et al., 2014) and PhyloP (Hubisz et al., 2011). We also explored combining limited functional assay data with neural network methods to build a universal model, although negative results were observed indicating possible discrepancies between known expert-reviewed variant data and functional assay data.
2 Materials and methods
2.1 A summary of datasets
Table 1 summarizes all datasets used within this study. Details of the construction of each dataset are provided in the Supplementary Materials. Note that mutual exclusiveness of the training and validation/testing data was strictly maintained throughout the study.
An overview of datasets used in this study
| Name of dataset | No. of variants | Usage | Source | Deposit |
|---|---|---|---|---|
| Clin3stars | 9259 | Training/Testing | Clinvar | Supplementary Table S1 |
| Clin3stars_BRCA1 | 3214 | Training/Testing | Clinvar | Supplementary Table S1 |
| Clin2stars | 39 968 | Training | Clinvar | Supplementary Table S2 |
| Clin23stars | 49 227 | Training | Clinvar | Supplementary Table S3 |
| Clin23stars+4labs | 71 113 | Training | Clinvar | Supplementary Table S4 |
| Clin_total | 207 796 | Training | Clinvar | Supplementary Table S5 |
| TopGeneDB | 1226 | Validation | Internal | Supplementary Table S6 |
| Lincoln_BRCA1/2 | 2567 | Testing | Lincoln et al. (2017) | Supplementary Table S7 |
| SGE_BRCA1 | 3264 | Training/Testing | Findlay et al. (2018) | Supplementary Table S8 |
Note: Contents of all datasets can be found in Supplementary Tables S1–S8 (in order).
2.2 Variant features and variant annotations
AIVAR uses a total of 61 features for learning and prediction. See Supplementary Table S9 for a full list of features. ANNOVAR (Wang et al., 2010) v2017-07-17 was used for variant annotations on genome assembly version hg19/GRCh37. All features unless particularly specified were obtained from ANNOVAR annotation databases.
Functional/structural/regional annotation features: refGene annotations (Pruitt et al., 2014), InterPro (Hunter et al., 2012) protein classifications, UCSC hg19 repeat database (Kent et al., 2002), tfbsConSites (Wingender et al., 1996), wgRNA (Griffiths-Jones et al., 2006; Xie et al., 2007) and targetScanS (Kent et al., 2002).
Populational features: allele frequency from control population databases (all races) including 1000 Genomes (Gibbs et al., 2015), ExAC (Lek et al., 2016), HRC (McCarthy et al., 2016), cg69 (Drmanac et al., 2010), gnomAD (Lek et al., 2016), esp6500 (NHLBI Exome Sequencing Project, http://evs.gs.washington.edu/EVS/).
Predictive features: multiple in silico pathogenicity prediction scores from widely-used software including LRT (Chun and Fay, 2009), VEST3 (Carter et al., 2013), RadialSVM and LR (Dong et al., 2015), GERP++ (Davydov et al., 2010), PhyloP (Hubisz et al., 2011), SiPhy (Garber et al., 2009), CADD (Kircher et al., 2014), dbscSNV (Liu et al., 2016) and EIGEN (Ionita-Laza et al., 2016).
Whether or not the variant is recorded in dbSNP147 (Sherry et al., 2001) and gwasCatalog (MacArthur et al., 2017).
Other features: variant mutation type and whether the variant causes a loss-of-function effect on the gene product.
2.3 Feature transferring
Text feature must be transferred into digital features for machine learning. For example, at the column ‘Mutation Type’, we defined INSERTION = 1, DELETION = 2, SNV = 3, SUBSTITUTION = 4, OTHER = 0. See Supplementary Table S9 for a full description of transferring rules that we defined in this study.
2.4 Model training and validation/testing
The AIVAR model was implemented in Python 3.6.4 using Keras (https://keras.io/) with 1.5.0 TensorFlow (Rampasek and Goldenberg, 2016) backend on Linux CPU. Training and validation datasets were loaded into a 61-dimension array (for 61 features) as input to the model. The input layer contains 64 neurons, a bias unit and a relu activation. The input layer is then followed by 3 hidden-layers with the same structure of 64 neurons + a bias unit + a relu activation. A dropout of 20% of neurons was performed before a 2-dimensional output layer with a softmax activation. The ‘categorical crossentropy’ was used as the loss function, and Adam was used as the optimizer with a learning rate of 0.2. We used a batch size of 2048 with 200 epochs for training. Model validation/testing is performed with default settings.
3 Results
3.1 AIVAR neural network implementation
The design of AIVAR is shown in Figure 1. AIVAR is a 3-hidden-layer neural network model trained with a set of 61 extracted features in a supervised-learning manner (see Section 2). The feature set consists of functional, structural, populational, predictive and other features. The model outputs the predicted probability of a given variant to be within the pathogenic/likely pathogenic (P/LP) or benign/likely benign (B/LB) category. Note that VUS are deliberately excluded from the training set to avoid a third classification, so that the prediction outcome of AIVAR is either P/LP or B/LB. By default, AIVAR classifies each variant with a 0.5 probability cutoff, i.e. if the probability of a given variant to be in the P/LP category is over 0.5, it will be classified as P/LP by AIVAR. The default 0.5 cutoff was used in the study unless otherwise specified. We have confirmed that AIVAR is highly unlikely to produce a tie 0.5:0.5 probability (never observed in million times of classifications).
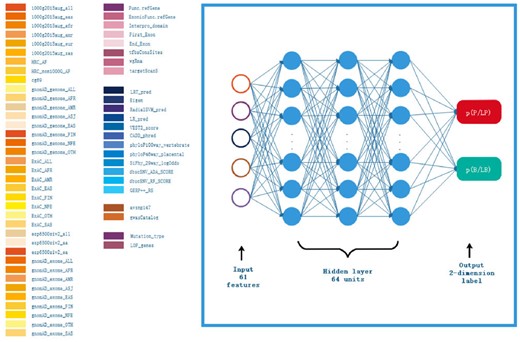
Schematic representation of the AIVAR neural network model. The input layer consists of 61 features (listed on the left); each of the 3 hidden layers consists of 64 units; the output layer is a 2-dimension label specifying the probability of the given variant to fall in the P/LP or B/LB category, which together sum up to 1. By default, a given variant will be classified by AIVAR with a 0.5 probability cutoff
3.2 AIVAR achieved comparable performance to human on known data
We first assessed the feasibility of AIVAR with our internal variant database TopGeneDB, which consists of 1226 variants (704 P/LP + 522 B/LB) curated from over 5000 individuals who had completed the multi-gene hereditary cancer panel at TopGene between 2015 and 2017. We generated several AIVAR models with different training sets: Clin3stars (Clinvar expert-reviewed variants, 9259 variants in total), Clin2stars (Clinvar multiple submitted, non-conflicting variants, 39 968 variants), Clin23stars (Clin3stars U Clin2stars, 49 227 variants), Clin23stars + 4labs (Clin23stars U variant data submitted by Clinvar’s top4 submitters, 71 113 variants), Clin_total (Clinvar all non-VUS data without any quality filters, 207 796 variants) and compared their performances on predicting the TopGeneDB validation set (Table 2). Throughout the study, P/LP was defined as ‘positive’ and B/LB was defined as ‘negative’; mutual exclusiveness of the training and validation/testing data was strictly maintained by removing overlapping variants in the larger dataset. The trained AIVAR model obtained accuracy above 98.0% by cross-validation on all Clinvar-derived datasets, indicating consistency within them. The Clin3stars set has the highest data quality but the smallest data quantity, resulting in a relatively low performance. The Clin_total set has the biggest size, but the data quality was not guaranteed, and thus the performance was reduced. The Clin23stars model outperformed the others with a slight advantage by having a high-quality training set with enough data quantity. Once the quantity was enough, performance did not go any further with a bigger-size training set (Clin23stars + 4labs) of similar quality.
Performances of AIVAR models generated with different Clinvar training sets on the TopGeneDB validation set
| Train set | Accuracy | Sensitivity | Specificity | PPV | NPV |
|---|---|---|---|---|---|
| Clin3stars | 91.68% | 99.01% | 81.80% | 88.01% | 98.39% |
| Clin2stars | 97.15% | 98.86% | 94.83% | 96.27% | 98.41% |
| Clin23stars | 97.88% | 99.15% | 96.17% | 97.21% | 98.82% |
| Clin23stars+4labs | 97.55% | 99.43% | 95.02% | 96.42% | 99.20% |
| Clin_total | 96.74% | 99.29% | 93.30% | 95.23% | 98.98% |
Note: All Clinvar training data were obtained from Clinvar version 2018-10-30. For each model, training-validation was performed three times and the medium accuracy performance was shown on the table. PPV: positive predictive value; NPV: negative predictive value.
We further evaluated the above Clin23stars AIVAR model with a manipulated BRCA1/2 dataset derived from Lincoln et al. (2017). The original dataset were curated from seven trusted sources and were highly concordant (per-variant concordance 98.5%); we removed VUS and all variants with conflicting interpretations; the resulted consensus BRCA1/2 set (denoted as ‘Lincoln_BRCA1/2’) consists of 2567 non-VUS variants (1215 P/LP + 1352 B/LB). This dataset is thought to represent current human expertise with consensus of interpretation. AIVAR achieved 96.96% accuracy and 99.18% sensitivity, outperforming multiple first and second generation in silico tools (Table 3).
Performances of different software on the Lincoln_BRCA1/2 test set (2567 variants)
| Method | Accuracy | Sensitivity | Specificity | PPV | NPV |
|---|---|---|---|---|---|
| AIVAR (2567) | 96.96% | 99.18% | 94.97% | 94.66% | 99.23% |
| REVEL_0.75 (632) | 89.08% | 47.25% | 96.12% | 67.19% | 91.55% |
| CADD_16 (1076) | 85.78% | 87.55% | 84.07% | 84.21% | 87.43% |
| Mut_Tas (2526) | 81.75% | 99.67% | 66.10% | 71.98% | 99.55% |
| Mut_Ass (540) | 64.81% | 80.33% | 62.84% | 21.59% | 96.17% |
| FATHMM (555) | 67.21% | 52.11% | 69.42% | 20.00% | 90.81% |
| SIFT (900) | 49.00% | 36.41% | 59.63% | 43.23% | 52.62% |
| Pph-2 HDIV (548) | 59.85% | 89.71% | 55.63% | 22.26% | 97.45% |
| Pph-2 HVAR (544) | 72.43% | 69.23% | 72.86% | 25.71% | 94.58% |
Note: Numbers in brackets specify the number of variants that were defined by the particular software. The cutoff value for AIVAR was 0.5. REVEL_0.75: the best performance of REVEL was obtained on the test set when the cutoff value was set to 0.75. CADD_16: the best performance of CADD was obtained on the test set when the cutoff value was set to 16. CADD scores were obtained via ANNOVAR database, while other bench-marking in silico prediction scores were obtained directly from their online versions. PPV: positive predictive value; NPV: negative predictive value; Mut_Tas: MutationTaster; Mut_Ass: MutationAssessor; Pph-2: Polyphen-2.
Performance of AIVAR was also compared with the automatic version of InterVar (InterVar-auto, version-20180118, without manual adjustment; Fig. 2), which implements 18 criteria of the ACMG-AMP guideline. AIVAR showed superiority on overall high concordance with the Lincoln_BRCA1/2 set. Although a considerable amount of discordant classifications (377/1407) in the P/LP category, InterVar-auto was shown very accurate on calling benign variants—all benign classifications were concordant with Lincoln_BRCA1/2. 39.81% (1022/2567) of the non-VUS variants were classified as VUS by InterVar-auto, in which 18.10% (185/1022) were labeled as pathogenic/likely pathogenic in Lincoln_BRCA1/2. These suggested that automatic implementation of expert guidelines without additional manual adjustment could lead to about 40% of the variants classified as VUS, due to lack of sufficient evidence.
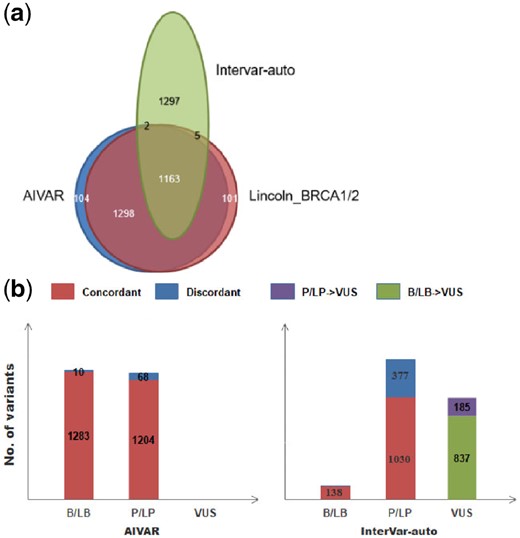
AIVAR versus InterVar-auto on the Lincoln_BRCA1/2 test set. (a) Venn diagram: a schematic representative of the proportions of consensus classifications and discordant/conflicting classifications by AIVAR, Lincoln_BRCA1/2 and InterVar-auto. AIVAR showed large overlap (concordance) with Lincoln_BRCA1/2, while InterVar-auto showed a substantial amount of discordance. (b) Bar charts show proportion of variants classified into B/LB, P/LP, VUS by AIVAR and InterVar-auto; concordant and discordant predictions (with Lincoln_BRCA1/2) of each category are indicated in red and blue color, respectively; InterVar-auto produced substantial amount of VUS classification that were originally classified as either P/LP (purple) or B/LB (green) by human expert groups, according to Lincoln et al. (2017)
3.3 Low concordance between functional assays and in silico predictions
We next explored the concordance between functional assay data and in silico tool predictions. We compiled a functional assay dataset (non-redundant; intermediate-score variants removed; denoted as ‘SGE_BRCA1’) from the SGE assay data of Findlay et al. (2018), calculated correlations and made one-to-one comparison scatter plots among SGE function scores, AIVAR, CADD and PhyloP scores (Fig. 3). Here we defined variants that were predicted ‘loss-of-function’ by SGE as an equivalent to P/LP, variants predicted ‘functional’ by SGE as an equivalent to B/LB; the SGE_BRCA1 set contains 626 P/LP + 2638 B/LB variants. Although all of the three tested in silico tools showed low correlations with SGE function scores, AIVAR (R = −0.6053713, P < 2.2 × 10⁻¹⁶, Pearson coefficient test) showed the strongest correlation among the three (CADD: R = −0.4698369, P < 2.2 × 10⁻¹⁶; PhyloP: R = −0.4234059, P < 2.2 × 10⁻¹⁶; Pearson coefficient test). The scatter plots also did not show significant evidence of correlations between SGE scores and any of the three in silico tools tested (Fig. 3). Correlations within in silico tools were also not strong (Fig. 3), with CADD versus PhyloP (R = 0.6225547, P < 2.2 × 10⁻¹⁶, Pearson coefficient test) showed a slightly stronger trend of correlation (AIVAR versus CADD: R = 0.6079489, P < 2.2 × 10⁻¹⁶; AIVAR versus PhyloP: R = 0.5966475, P < 2.2 × 10⁻¹⁶; Pearson coefficient test). Using the SGE classifications as benchmark, we computed Receiver Operating Characteristics curve of the three in silico tools. Interestingly, AIVAR achieved slightly better performance when trained with the BRCA1-only subset of Clin23stars (auc = 0.87, accuracy = 82.81%, cutoff: 0.500), compared with AIVAR trained with Clin23stars full set (auc = 0.85, accuracy = 78.30%, cutoff: 0.990; Figure 4 and Supplementary Table S10). This slight drop of performance was deemed not very likely to be caused by class-imbalance of the training data, since the full Clin23stars set has a class distribution more similar to that of the SGE_BRCA1 set than its BRCA1-only subset (Supplementary Table S10). Collectively, as the optimized prediction accuracy was less than 85%, the concordance between the tested in silico tools and the SGE function scores were considered non-significant.
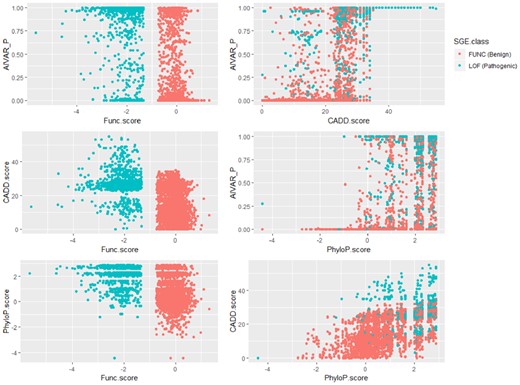
One-to-one comparison scatter plots to show the extent of concordance between SGE function scores and three in silico tools: AIVAR, CADD and PhyloP. Low concordances were indicated between SGE function scores and any of the three in silico tools; concordances within the three in silico tools were also not strong. CADD and PhyloP scores were obtained together from the original SGE dataset of Findlay et al. (2018). AIVAR_P: probability of the given variant being pathogenic/likely pathogenic, predicted by AIVAR
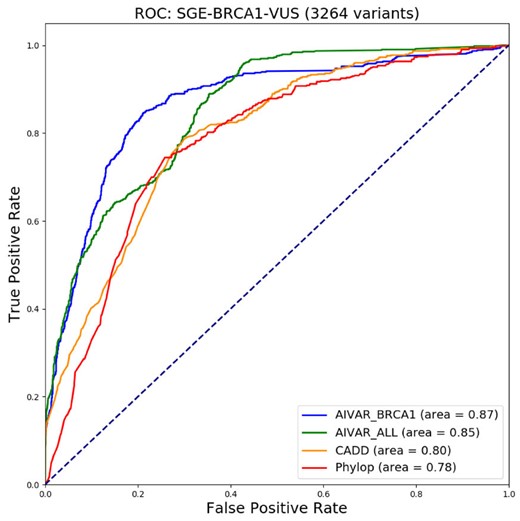
Receiver operating characteristic (ROC) curves for comparisons of AIVAR, CADD and PhyloP on the SGE_BRCA1 test set. The ‘AIVAR_BRCA1’ model was trained only with the BRCA1 subset of Clin23stars, while ‘AIVAR_ALL’ was trained by the full Clin23stars set. Area under the curve (AUC) values are provided at the bottom right for each software used
3.4 Limited functional assay data + neural network ≠ an accurate universal model?
We further explored the possibility that the combination of limited functional assay data and machine learning methods might create a highly accurate universal model. We exchanged the training and test sets, using SGE_BRCA1 to train AIVAR and asked the resulted model to predict on Clin3stars and Lincoln_BRCA1/2. AIVAR obtained 91.0% accuracy by cross-validation on SGE_BRCA1, indicating relatively low consistence within the dataset. Interestingly, the results indicated that AIVAR trained with SGE functional assay data was not good at predicting expert-reviewed variants (Table 4). Specifically, the low accuracy, low sensitivity and low negative predictive value (NPV) were caused by high numbers of false negatives; on the other hand, the numbers of false positives were low, resulting in high specificity and high positive predictive value. The effect of class-imbalance in SGE_BRCA1 (as training data) was deemed non-significant, as similar performances were resulted from AIVAR trained by two approximately class-balanced subsets of SGE_BRCA1 (Table 4). Rather, the high number of false negatives may be caused by too few positive (626 P/LP variants) data in SGE_BRCA1, since reducing negative data only changes the positive/negative ratio but never increase the exposure of AIVAR to positive events. Attempts to enhance positive experience by manually increasing the weight of the 626 P/LP variants at training was proven ineffective, as no improvement on performances were observed (data not shown). However, due to the limited quantity of the current SGE_BRCA1 set, we could not ruled out the possibility that a larger-size SGE assay dataset may improve the performances. Nevertheless, these results did not support the hypothesis that functional assay data plus machine learning is the solution to the genome-wide prediction problem.
Performances of the SGE_BRCA1 (whole or subset)-trained AIVAR models on different test sets
| Train set | Test Set | Accuracy | Sensitivity | Specificity | PPV | NPV |
|---|---|---|---|---|---|---|
| SGE_ | Clin3stars | 47.66% | 24.32% | 98.79% | 97.79% | 37.34% |
| BRCA1 | Clin3stars_BRCA1 | 42.28% | 15.35% | 99.42% | 98.24% | 35.63% |
| − whole 626: 2638 | Lincoln_BRCA1/2 | 67.67% | 34.24% | 97.71% | 93.06% | 62.31% |
| SGE_ | Clin3stars | 48.81% | 27.50% | 95.49% | 93.03% | 37.55% |
| BRCA1 | Clin3stars_BRCA1 | 42.41% | 17.90% | 94.37% | 87.08% | 35.15% |
| − subset1 626: 800 | Lincoln_BRCA1/2 | 69.22% | 41.81% | 93.86% | 85.96% | 64.22% |
| SGE_ | Clin3stars | 49.05% | 27.81% | 95.59% | 93.25% | 37.67% |
| BRCA1 | Clin3stars_BRCA1 | 44.06% | 18.22% | 98.83% | 97.07% | 36.31% |
| − subset2 626: 580 | Lincoln_BRCA1/2 | 69.69% | 43.05% | 93.64% | 85.88% | 64.66% |
Note: Ratios at the ‘train set’ column indicate the ratio of P/LP versus B/LB variants. Clin3stars_BRCA1: the BRCA1 subset of Clin3stars; PPV: positive predictive value; NPV: negative predictive value.
4 Discussion
In this study, we took advantage of neural network methods to study the concordance among human experts, in silico predictions and functional assays on classifying genetic variants. Our results indicated that an optimized in silico method can achieve comparable performance to human experts on known variant sets; however, high-performance in silico tools may not yield concordant predictions to functional assay data. Moreover, neural network model trained with functional assay data may not necessarily produce accurate predictions on known expert-verified variants.
The major difficulty of implementing expert guidelines into computational tools is that the context-specific information for a given variant (e.g. donor’s family history and trio genotype, etc.) that could possibly alter its interpretation is not always publicly available and hard to be automated, thus resulting in insufficient evidence for the variant, and eventually leading to a VUS classification. Our results showed that, as a convenient automatic implementation of the ACMG-AMP guideline for high throughput purpose, the unadjusted InterVar-auto, despite highly accurate on predicting benign variants, has a major limitation of producing many (∼40%) VUS classification on expert-verified non-VUS.
When a VUS classification results from current guidelines, in silico predictions and functional assays are currently the two major methods to provide a certain degree of reference. In silico prediction tools have been implemented in many sequence analysis pipelines and are widely used for informative purposes by laboratories/individual interpreters, but their real-world performances can vary greatly on the same set of variants. The discordance among different in silico predictions may cause confusions to the users, and how reliable are these computational tools has long been questioned. Indeed, we found great differences in performance among in silico tools. As a whole, the second generation (machine-learning based) methods outperformed the first generation (conservation models, statistic models) ones. Substantial variability was still observed in performances within different machine-learning based methods, which may be caused by differences in the machine-learning algorithms, the model design and the choice of training dataset. In terms of a neural network model like AIVAR, the selection of features, the quantity and the quality of the training data are key determining factors of performance. The feature selection of AIVAR was under the simple assumption that deleterious variants and harmless/neutral variants have distinct characteristics; these characteristics might reflect on many aspects, such as protein structure/function, sequence conservation, population frequency and splicing effects. AIVAR’s feature set consists of functional, structural, population features and multiple in silico prediction scores, allowing a comprehensive coverage of features that represent the variants’ full spectrum of characteristics. Also, there must be enough data for training. As shown in Table 2, the Clin3stars alone (containing 9259 variants in total) did not yield a good performance, although its quality was expected to be the highest. Interestingly, once there was enough training data, the performance did not seem to go any further when adding more training data of similar quality to the model, as shown by the performances of AIVAR trained with Clin23stars and Clin23stars + 4labs. The quality of the training data is no doubt, vital to a successful model. Unlike the effects of quantity, the effects of quality were inconspicuous in Table 2, probably because we had removed all variants with conflicting classifications in each training set, and that the vast majority of Clinvar (Landrum et al., 2016) data proved to be reliable. Like any other machine-learning algorithms, AIVAR will inherit any errors and biases introduced by its training set (despite careful selection of expert-reviewed data which were assumed to be true). For example, any misinterpretations of biological facts that have been implemented into the current ACMG criteria could have a profound effect on AIVAR, since the output of ACMG-based interpretation (i.e. classification of the variants) were directly ‘learned’ by the algorithm. The choice of sequence variant annotator could also affect AIVAR’s performance, with ANNOVAR being the best among comparisons (data not shown), probably because most of the data input (e.g. in silico scores, expert interpretations) were generated based on ANNOVAR annotations.
Computational prediction and functional assessment were expected to have (more or less) some degree of concordance, because they are both essentially pathogenicity prediction approaches. In this study, although demonstrating high-performance on known validated data, AIVAR—together with two other in silico tools tested—CADD (Kircher et al., 2014) and PhyloP (Hubisz et al., 2011)—displayed non-significant concordance with functional assay prediction on BRCA1 VUS data. It should be noted that VUS in essence are not distinct from their non-VUS counterparts—‘VUS’ is a temporal classification due to insufficient observation, but never meaning a different spectrum on pathogenicity. A VUS can turn out to be strongly pathogenic or harmless, just like the known pathogenic/benign ones. Since there are no intrinsic differences between VUS and non-VUS, we expected AIVAR to work as good as it does on non-VUS when encountering VUS. One possible explanation about the discordance between in silico prediction and functional assay is that computational models are based on certain distributions, which may not reflect the distribution of the functional assay data—in the case of SGE_BRCA1 (Findlay et al., 2018), the variants were saturated (all possible SNPs) in 13 exons of BRCA1, resulting in an extremely concentrated distribution (compared with variants sparsely distributed throughout a whole genome). A supportive observation was that AIVAR trained with the BRCA1 subset of Clin23stars predicted SGE_BRCA1 slightly better than the full Clin23stars model, which indicated the non-BRCA1 content of Clin23stars may not be helpful in improving AIVAR’s concordance with the SGE BRCA1 assay. If the SGE prediction on BRCA1 VUS proves to be accurate, then probably there should be a reassessment of the following questions: does specificity have to be obtained by sacrificing universality? In other words, should an in silico prediction tool only be specialized in one or several genes in order to achieve maximum optimization? And how good can these maximally optimized models function?
It is important to note that while function is a component of pathogenicity assessment, functional assay results should not be interpreted as an equivalent to pathogenicity. In this study, SGE_BRCA1 was used as an ‘approximate substitute’ for a VUS dataset, in which the variants’ pathogenicity had been verified experimentally. So far a variety of functional assays have been developed, testing different pathways and biological functions that a gene (e.g. BRCA1) is known to involve in. The problem being that, results from a single functional assay that targets only a certain pathway may not be sufficient for a comprehensive assessment of pathogenicity, especially when molecular studies of the gene/protein/disease are not well-established. This is evidenced in the work of Shaikh et al. (2017), where the combination of three different assays (glycosylation and membrane expression, auto phosphorylation, Y496 phosphorylation) failed to identify a pathogenic NTRK1 variant which completely abolished PLCγ signaling. Moreover, even if a given variant is proved to cause deleterious effects on certain biological functions by multiple in vitro assays, compensatory mechanisms can still exist in vivo rendering a non-disease phenotype (Chen et al., 2016). Therefore, genetic evidences (e.g. segregation, linkage) are required for the determination of pathogenicity, and functional assays alone are informative but may not be sufficient for a definitive conclusion (Sobrido, 2017). Nevertheless, functional assays as an experimental approach are still considered more reliable than in silico predictions, especially on classifying VUS. Our investigation confirmed that SGE results were highly consistent (98% concordance) with expert curations in Lincoln_BRCA1/2, although only a small portion (52 variants) of data were overlapping between the two sets for comparisons. Interestingly, the accuracy by cross-validation on SGE_BRCA1 was relatively low (91.0%, compared with Clin3stars > 99.5%), suggesting possible inconsistency within the SGE data. Nevertheless, since a small number of known variants were used for bench-marking in the Findlay et al. (2018) study, more variants with known pathogenicity will be required for a further evaluation of this method. Benchmark studies of concordances among different functional assays on the same variants are also awaited.
One intrinsic drawback of functional assays is the difficulty in generalization to a whole-genome scale. There are two possible solutions: to literally conduct functional assays on all possible SNPs, or to build prediction models based on limited data. The former will require great advances in techniques that allow a single assay to fit in all genes, and of course great efforts, to cover even the whole exome—up to now, even the few best characterized genes [e.g. BRCA1 (Findlay et al., 2018), PPARG (Majithia et al., 2016)] have not been 100% full-length covered by functional assays. A compromise would be to conduct assays only on known disease-associated genes, which reduces the scale to thousands but still a massive amount of work. Modeling on existing data seems to be more realistic, and the hypothesis of ‘pre-computation’ with limited functional data has been proposed (Starita et al., 2017). We have explored such possibility in this study, by training the neural network model with BRCA1 variants from the SGE functional assay data (SGE_BRCA1), each labeled with classification (benign, pathogenic) indicated from their function scores. We expected the resulting model to work on known variants in BRCA1, but the accuracy of 42.28% on Clin3stars_BRCA1 and 68.58% on Lincoln_BRCA1/2 were far away from satisfactory (Table 4). As a direct comparison, AIVAR trained with Clin23stars_BRCA1 yielded 82.81% accuracy on SGE_BRCA1. This suggested that, machine-learning from human-verified data predicts functional assay results with medium accuracy, but much better than the other way around. With the assumption that both SGE assay and expert interpretation criteria provide accurate prediction, the small number of positive (P/LP) variants within the SGE_BRCA1 set might be the major limiting factor of performance. Unfortunately, currently the Findlay et al. (2018) SGE study has already been the largest, and probably the only one with a single-nucleotide resolution. If this lack of positive data for training is the true cause of the low sensitivity, then the problem could be solved when more functional data are available. Another possible explanation (as discussed above) could be the difference in data distribution, that the variant within SGE_BRCA1 were positioned too close to each other, which could result in over-fitting problems. It is also possible that the generally used interpretation criteria for expert-verified data may not fit in the functional assay data, because the latter is mostly VUS and may have a lot of missing feature values, such as population frequencies and in silico predictive scores. However, attempts to ‘de-noise’ of these features (e.g. removal of in silico scores from the feature set) did not yield any improved results (data not shown). Also, discrepancy in accuracy by cross-validation between the SGE functional data and the Clin3stars indicated possible difference in data quality. The above possibilities should be better handled in order to improve the model performance. Nevertheless, our exploratory experiments provided some preliminary results of a ‘pre-computation’ of variant pathogenicity likelihood using supervised neural network model trained with limited functional assay data. We expect future studies to benefit from this early experience.
Acknowledgements
The authors would like to thank Dr Wenlong Jia, Dr Brian Thomas, Dr Yi Feng and Dr Daxian Zeng for reading the manuscripts and offering valuable comments. We also want to express our sincere gratitude to Dr Xingchang Huang, Dr Qingbiao Li, Dr Pengcheng Wang and Dr Yida Li for their technical guidance on machine learning.
Funding
This work was supported by the Nanjing Medical Science and Technology Development Project (YKK15082).
Conflict of Interest: Xiaoting Li was employed by Top Gene Tech (Guangzhou) Co., Ltd. when the work was conducted and completed, but no longer by the time of manuscript submission. Other authors declare no competing interests.
References
Author notes
The authors wish it to be known that, in their opinion, Jiaqi Luo, Tianliangwen Zhou, Xiaobin You, Yi Zi, Xiaoting Li and Yangming Wu should be regarded as Joint First Authors.

