


Abstract
Tumor purity is a fundamental property of each cancer sample and affects downstream investigations. Current tumor purity estimation methods either require matched normal sample or report moderately high tumor purity even on normal samples. It is critical to develop a novel computational approach to estimate tumor purity with sufficient precision based on tumor-only sample.
In this study, we developed MEpurity, a beta mixture model-based algorithm, to estimate the tumor purity based on tumor-only Illumina Infinium 450k methylation microarray data. We applied MEpurity to both The Cancer Genome Atlas (TCGA) cancer data and cancer cell line data, demonstrating that MEpurity reports low tumor purity on normal samples and comparable results on tumor samples with other state-of-art methods.
MEpurity is a C++ program which is available at https://github.com/xjtu-omics/MEpurity.
Supplementary data are available at Bioinformatics online.
1 Introduction
Tumor purity is a critical feature for tumor data analysis. Imprecise estimation of tumor purity complicates downstream analysis and often leads to the incorrect interpretation of oncogenesis. For instance, a homozygous deletion combined with 50% tumor purity might be considered as a heterozygous deletion combined with 100% tumor purity.
Currently, methods like PurBayes (Larson and Fridley, 2013) and ABSOLUTE (Carter et al., 2012) require matched normal and tumor samples to calculate tumor purity. However, it is inconvenient and costly to include normal tissues in clinical practice. LUMP (Aran et al., 2015) and ESTIMATE (Yoshihara et al., 2013) examine immune cells and stromal cells for tumor purity estimation but their calculations often yield imprecise result due to ignoring other cell types in tumor samples. Recently Infiniumpurify (Zheng et al., 2017) and PAMES (Benelli et al., 2018) take tumor only Illumina Infinium Human Methylation 450K (450k) data as input. However, they rely on a set of tumor samples and report moderately high tumor purity on normal samples (Supplementary Fig. S1), which does limit their clinical application.
For clinical tumor purity estimation, it is desired to develop an algorithm to accurate estimate tumor purity for each single tumor sample. Here, we propose MEpurity, a beta mixture model (BMM) based algorithm (Ma and Leijon, 2011), to estimate tumor purity using 450k data of single tumor sample. It has been shown that alternation of DNA methylation during tumorgenesis reflects the clone architecture of tumors (Brocks et al., 2014). Based on this and analogous to the hieratical accumulation of the somatic SNV during tumorgenesis (Ding et al., 2012), we hypothesize that cells in the tumor founding clone acquire methylation changes compared to normal cells as well as additional methylation alterations emerge when each subclone diverges from the parent clone (Supplementary Fig. S2). The methylation changes acquired in the founding clone indicate the tumor purity.
2 Materials and methods
2.1 Methods
In MEpurity, we first use a set of normal samples, which are independent of tumor samples, to select stable CpG sites. Then, we detect differentially methylated CpG sites (DMCs) for each tumor sample and calculate the alpha value (details in following) of each DMC. We use BMM to cluster these alpha values and the cluster with the largest mean alpha values represents the founding clone. The tumor purity is estimated by the mean alpha value of the founding clone cluster. The workflow of MEpurity is depicted in Figure 1A.
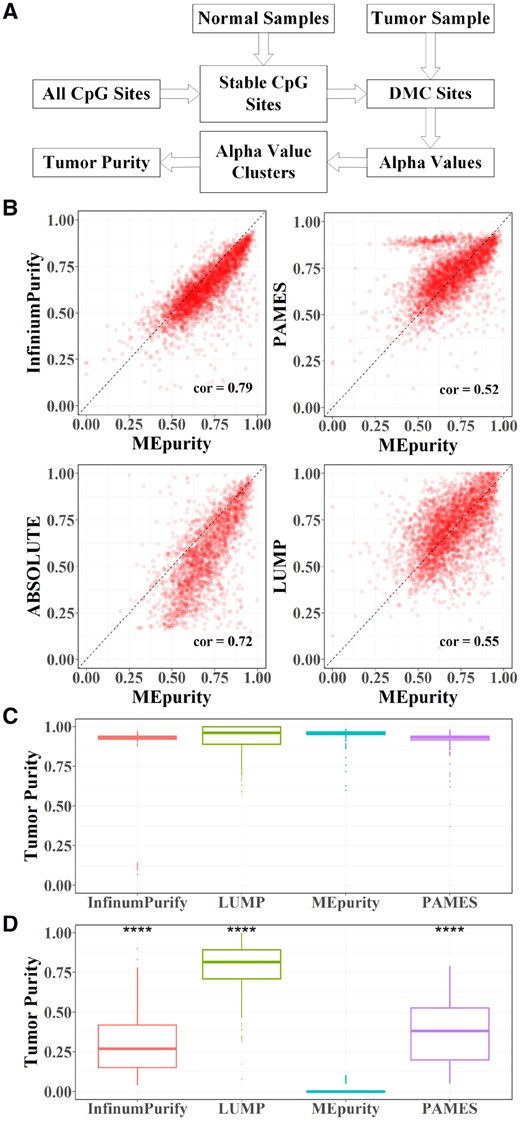
MEpurity workflow and performance comparison. (A) The workflow of the MEpurity; (B) Comparisons of MEpurity with ABSOLUTE, Infiniumpurify, PAMES and LUMP on tumor samples; (C) Comparisons of MEpurity with ABSOLUTE, Infiniumpurify, PAMES and LUMP on cancer cell line samples; (D) Comparison of tumor purity estimation by different methods on normal samples, *** means P-value < 0.0001
2.1.1 Selection of the most stable CpG sites
DNA methylation heterogeneity does present in normal samples due to different cell types (Houseman et al., 2016). In order to reduce the DNA methylation heterogeneity in normal samples, we select CpG sites with the most stable methylation level across normal samples in our study. For 450k data, the methylation status of each CpG site forms a beta distribution, in which beta value represents the fraction of methylated alleles. We calculate the mean and standard deviation of beta values at each CpG site i in a pool of normal samples and select top n CpG sites with the smallest as the most stable CpG sites (n is a user-defined parameter and the default value is 70000).
2.1.2 Tumor sample specific DMC detection
We define sample specific DMCs as the selected most stable CpG sites with significant DNA methylation changes in each tumor sample. We argue that for most stable CpG sites, the beta values largely follow normal distribution on normal samples. Although the beta value distribution for certain sites may deviate from the normal distribution, the assumption is close enough to be true in practice to be used heuristically. We compare the beta value of ith stable CpG site in the tumor sample with its beta value distribution in the pool of normal samples by calculating z-score (). We detect DMCs as stable CpG sites with z > k, where k is a user-defined parameter (default is 20).
2.1.3 Calculation of alpha value
Let represent the beta value of cells with the same methylation level as in normal cells at ith DMC, represent the beta value of tumor cells with altered methylation level at ith DMC, and represent the percentage of tumor cells with their methylation status altered. Thus the beta value in the mixed sample (tumor sample) at ith DMC is . For the ith DMC, we calculate its alpha value based on the estimated and and the observation of (Supplementary Materials). Here we emphasize that is a measurement of DNA methylation change at ith DMC with a bounded value between 0 and 1. We demonstrate that alpha value is a reliable indicator of tumor purity (Supplementary Fig. S3).
2.1.4 Clustering of alpha values and calculating tumor purity
We next cluster alpha values to detect the largest mean alpha value for tumor purity estimation. First we adopt multivariate beta distribution to fit the alpha values and then apply BMM model (Ma and Leijon, 2011) to detect clusters. We calculate the mean alpha value for each cluster, and use the largest one to represent the tumor purity (Details described in Supplementary Materials).
2.2 Datasets
We downloaded the 450k data of 722 normal samples and 3693 tumor samples (Supplementary Tables S1 and S2) with tumor purity estimated by ABSOLUTE from TCGA (Aran et al., 2015). In addition, we downloaded 450k data of 374 human cancer cell lines (Iorio et al., 2016) used in Benelli et al’s study (Benelli et al., 2018) from Gene Expression Omnibus (GEO) portal (GSE68379) to validate MEpurity and to make comparison with PAMES (Benelli et al., 2018), Infiniumpurify (Zheng et al., 2017) and LUMP (Aran et al., 2015).
3 Results
3.1 Runtime and memory
MEpurity is implemented in C++. It takes about 9 s and 150 MB memory with single core to process a sample.
3.2 Comparison with other tools
3.2.1 Tumor purity estimation on tumor samples and cancer cell lines
We applied MEpurity on 3693 TCGA tumor samples and compared the results with Infiniumpurify, ABSOLUTE, PAMES and LUMP (Fig. 1B). The tumor purity values of ABSOLUTE and LUMP were obtained from previous study (Aran et al., 2015). A correlation analysis indicates high consistency of tumor purity estimation between MEpurity and the state-of-the-art methods. In addition, we benchmarked the above tools with 374 human cancer cell line data with known tumor purity equal to 1 (Fig. 1C). We found that MEpurity (0.953 ± 0.035) reports highest mean and smallest standard deviation compared to other methods (Infiniumpurify: 0.902 ± 0.150; LUMP: 0.931 ± 0.084; PAMES: 0.921 ± 0.052), indicating MEpurity’s performance in high tumor purity samples. More detailed comparison results are in Supplementary Tables S1 and S2.
3.2.2 Tumor purity estimation on normal samples
We compared the results of MEpurity, Infiniumpurify, PAMES and LUMP in TCGA normal samples (Fig. 1D). We found that purity estimated by Infiniumpurify, PAMES and LUMP in normal samples are significantly higher than purity estimated by MEpurity (P-value <0.0001), indicating MEpurity’s performance in low tumor purity samples. More detailed comparison results are in Supplementary Table S3.
Funding
K.Y. and X.Y. are supported by the National Science Foundation of China (31671372 and 61702406), the National Key R&D Program of China (2018YFC0910400 and 2017YFC0907500) and the National Science and Technology Major Project of China (grand no. 2018ZX10302205), X.Y. is supported by the General Financial Grant from the China Postdoctoral Science Foundation (2017M623178).
Conflict of Interest: none declared.
References

