


Abstract
Cell divisions start from replicating the double-stranded DNA, and the DNA replication process needs to be precisely regulated both spatially and temporally. The DNA is replicated starting from the DNA replication origins. A few successful prediction models were generated based on the assumption that the DNA replication origin regions have sequence level features like physicochemical properties significantly different from the other DNA regions.
This study proposed a feature selection procedure to further refine the classification model of the DNA replication origins. The experimental data demonstrated that as large as 26% improvement in the prediction accuracy may be achieved on the yeast Saccharomyces cerevisiae. Moreover, the prediction accuracies of the DNA replication origins were improved for all the four yeast genomes investigated in this study.
The software sefOri version 1.0 was available at http://www.healthinformaticslab.org/supp/resources.php. An online server was also provided for the convenience of the users, and its web link may be found in the above-mentioned web page.
Supplementary data are available at Bioinformatics online.
1 Introduction
A cell needs to replicate its double-stranded DNA during its division, and then its genetic information is accurately passed to the next generation (Watson and Crick, 1953). The replication origin is where the genome replication process starts and requires precise regulations (Mott and Berger, 2007). Bacterial genome usually has one replication origin (Chodavarapu and Kaguni, 2016; Skarstad and Katayama, 2013), while eukaryotic genome has multiple replication origins to parallelly replicate the large genomes (Bogenschutz et al., 2014; Peng et al., 2015; Warner et al., 2017) and so does archaea (Ausiannikava and Allers, 2017). Many genetic elements have inherent sequence-level patterns that can be used to optimize a sequence-based element prediction system (Liu et al., 2017).
The replication origins may be precisely detected and bound by the origin recognition complex (ORC) (Lee and Bell, 1997). The replication origins of the well-studied budding yeast Saccharomyces cerevisiae have two characteristic sequence patterns. First, S.cerevisiae has highly specific sequence patterns in the replication origins (Liachko et al., 2010). ORC recognizes the T-rich 17 bp motif autonomously replicating sequence (ARS) and its consensus sequence (ACS), which may interact with the three neighboring B1/B2/B3 elements (Biswas et al., 2005; Liachko et al., 2010). The B1 element has an A/TTA/T motif within the 228 ARSs conserved across the six Saccharomyces species (Chang et al., 2011; Leonard and Mechali, 2013). The spacing between the B1 element and the ACS is essential for the ORC binding (Marahrens and Stillman, 1994). The B2 element is the binding residue for Cdc6p, the MCM-2-7 helicase (Wilmes and Bell, 2002; Zou and Stillman, 2000), while the B3 element bound to the ARS-binding factor 1 (Abf1) for the precise site specificity of replication (Marahrens and Stillman, 1992).
The second characteristics of S.cerevisiae replication origins is nucleosome exclusion (Nieduszynski et al., 2006). The nucleosome mapping result demonstrates that ∼180bp region overlapping the ARS1 replication origin is free from nucleosome binding. Nucleosome occupant regions have significant sequence motifs and tend to avoid the 200 bp regions upstream of the gene start codon and other regulatory regions (Yuan et al., 2005).
Various computational technologies have been utilized to detect the genomic replication origins (Peng et al., 2015). Nucleotides guanine (G) and cytosine (C) were observed to be differentially represented in the replication origin regions (Lobry, 1996). So the GC distributions were used to develop several tools like cumulative skew diagram (Grigoriev, 1998), Z-curve (Ou et al., 2003; Zhang and Zhang, 2002), base composition asymmetry (Gao and Zhang, 2008; Luo et al., 2014), etc. Nevertheless, the lack of negative samples may introduce false positives to these tools’ results.
Recent studies trained the replication origin predictors using both positive and negative samples, so that the number of both false positives and false negatives may be reduced. These samples were evaluated for their structural characteristics (Chen et al., 2012) and sequence statistical compositions (Robinson et al., 2014). Li et al. generated the pseudo-k-tuple nucleotide compositions (PseKNC) from the sample sequences and achieved 83.72% in the overall success rate of predicting replication origins in the S.cerevisiae genome (Li et al., 2015). The integration of dinucleotide physiochemical features (Zhang et al., 2016) and position-specific features (Xiao et al., 2016) with the original version of general pseudo amino acid composition (Chou, 2011) were demonstrated for their improved prediction accuracies of replication origin sites. A recent study considered the varied lengths of replication origins and GC asymmetry bias and proposed a replication origin prediction algorithm for four yeast genomes with the state-of-the-art prediction accuracies (Liu et al., 2018a).
This study hypothesized that the replication origin prediction models mentioned above may be improved by finding the best subset of the sequence features. So we carried out the supporting experiments for our hypothesis by following the five-step procedure, i.e. (i) well-defined benchmark dataset, (ii) formulating the sample sequence into features, (iii) selecting the features and optimizing the predicting classifier, (iv) cross-validating the model and (v) a user-friendly predicting tool. The experimental data demonstrated that the replication of original prediction models was reasonably improved.
2 Materials and methods
2.1 Benchmark dataset
This study chose to use the benchmark datasets of four yeast species curated from the database DeOri version 6.0 (Gao et al., 2012) and the corresponding genomic sequences were retrieved from the database GenBank (Benson et al., 2018). A comparative evaluation of a replication origin prediction algorithm was carried out on these four yeast species, i.e. S.cerevisiae, Schizosaccharomyces pombe, Kluyveromyces lactis and Pichia pastoris. The genomic locations of their replication origins were collected from the database DeOri version 6.0 (Gao et al., 2012). The negative samples were randomly extracted from the same genomes with the same length distributions as the positive samples. Only the sequences longer than 49 bp were kept for further analysis. Homologous redundant sequences with cut-off threshold 80% were detected and removed using the state-of-the-art sequence clustering software CD-HIT (Fu et al., 2012; Li and Godzik, 2006). The construction procedure of the four datasets was followed exactly as in Liu et al. (2018a).
The four benchmark datasets were denoted as D(Sc), D(Sp), D(Kl) and D(Pp) for the four yeast species: S.cerevisiae, S.pombe, K.lactis and P.pastoris. Saccharomyces cerevisiae had 340 replication origin samples in the positive dataset Dp(Sc) and 342 negative controls in the negative dataset Dn(Sc). There were 338 and 335 samples in the positive Dp(Sp) and negative Dn(Sp) datasets for S.pombe, respectively. Kluyveromyces lactis had 147 pairs of positive and negative samples in Dp(Kl) and Dn(Kl), respectively. The last genome Pichia pastoris had 305 non-redundant replication origins and 302 non-replication origins in the datasets Dp(Pp) and negative Dn(Pp). The final datasets may be found in Supplementary Materials S1–S4 of Liu et al. (2018a). The four datasets were summarized in Table 1.
Benchmark datasets
| Species | Dataset | P | N |
|---|---|---|---|
| Saccharomyces cerevisiae | D(Sc) | 340 | 342 |
| Schizosaccharomyces pombe | D(Sp) | 338 | 335 |
| Kluyveromyces latis | D(Kl) | 147 | 147 |
| Pichia pastoris | D(Pp) | 305 | 302 |
| Species | Dataset | P | N |
|---|---|---|---|
| Saccharomyces cerevisiae | D(Sc) | 340 | 342 |
| Schizosaccharomyces pombe | D(Sp) | 338 | 335 |
| Kluyveromyces latis | D(Kl) | 147 | 147 |
| Pichia pastoris | D(Pp) | 305 | 302 |
Note: The column ‘Species’ gave the names of the four genomes. The column ‘Dataset’ was the denotation of each dataset. The number of positive and negative samples in each dataset were given in the columns ‘P’ and ‘N’, respectively.
2.2 Experimental design
This study was organized into three main steps, i.e. feature extraction, feature selection and classification, as shown in Figure 1.
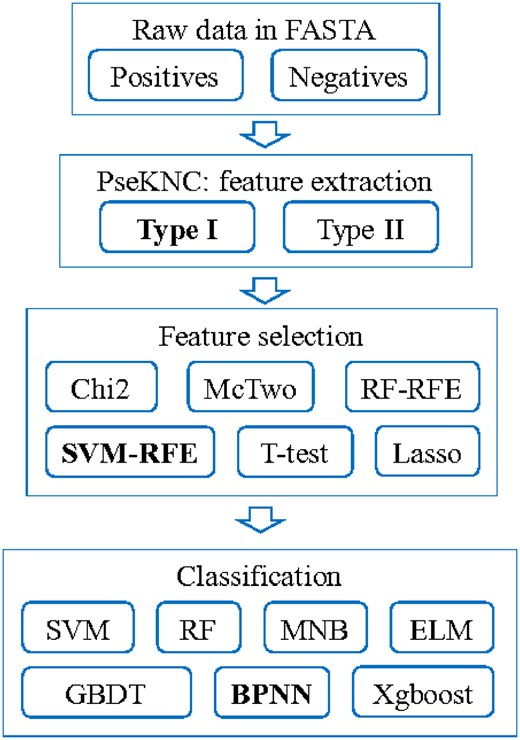
Flowchart of this study. Modules with the best performances were highlighted in bold
The PseKNC was widely used to describe the sequence level characteristics of DNA or RNA elements and have been successfully utilized for predicting various genetic elements, as similar in Liu et al. (2018b).
Six feature selection algorithms and seven classification algorithms were evaluated for building the prediction models of DNA replication origins. The prediction performance was evaluated by five metrics, i.e. sensitivity (Sn), specificity (Sp), overall accuracy (Acc), balanced accuracy (bAcc) and Matthews correlation coefficient (MCC) (Feng et al., 2018; Xu et al., 2018). Details may be found in Supplementary Materials due to the page limit.
3 Results and discussion
This study used the dataset D(Sp) to tune the parameters of the prediction model. A recent study investigated the prediction problem of DNA replication origins using the four datasets D(Sc), D(Sp), D(Kl) and D(Pp) (Liu et al., 2018a, b). They achieved the best LOO accuracy 0.965 on the dataset D(Sp), while the other three datasets D(Sc), D(Kl) and D(Pp) only got the LOO Acc = 0.730, 0.851 and 0.710, respectively. So this study assumed that a set of parameter values would perform well on all these four datasets if it could improve the previous model on D(Sp) with the best accuracy.
3.1 Find the best feature selection algorithm
Six feature selection algorithms were evaluated for their feature screening capabilities on predicting DNA replication origins, as shown in Figure 2. These algorithms were the filter feature selection algorithm χ-squared (χ2) test (Jin et al., 2006), the wrapper algorithm McTwo (Ge et al., 2016), random forest-based recursive feature elimination (RF-RFE) (Granitto et al., 2006), support vector machine-based recursive feature elimination (SVM-RFE) (Duan et al., 2005), Lasso (Deshpande et al., 2019; Kumar et al., 2017) and Ttest (Gharbali et al., 2018; Ye et al., 2017). The selected feature subset was evaluated for their back-propagation neural network (BPNN) classification performances averaged over 20 random runs of the 5-fold cross-validation strategy.
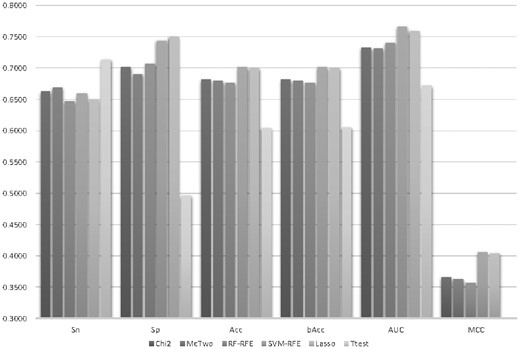
Classification performances of the classifier BPNN using features selected by six feature selection algorithms. The six feature selection algorithms were χ2, McTwo, RF-RFE, SVM-RFE, Lasso and Ttest. The horizontal axis gave the six performance metrics, i.e. Sn, Sp, Acc, bAcc, AUC and MCC. The vertical axis was the value of these performance metrics
Figure 2 illustrated that the feature selection algorithm SVM-RFE outperformed the other five algorithms in all the overall performance metrics, i.e. Acc, bAcc, AUC and MCC. SVM-RFE achieved about 0.02 improvements in Acc compared with χ2, McTwo and RF-RFE. Although McTwo achieved an improvement of 0.0092 in Sn compared with SVM-RFE, its Sp was 0.0413 smaller than SVM-RFE. SVM-RFE outperformed the second best feature selection algorithm Lasso with an improvement of 0.0012 in Acc. So SVM-RFE achieved an improvement of 0.0193 in Acc compared with McTwo. So the following sections used SVM-RFE to select a feature subset for predicting the DNA replication origins.
3.2 Find the best classification algorithm
Seven classification algorithms were evaluated for their capabilities of predicting DNA replication origins using the sequence features selected by SVM-RFE, as shown in Figure 3. The classifier SVM (Weston et al., 2001) has been widely applied in predicting biological elements (Beer, 2017; Zhang and Ma, 2019). The RF classifier determined the class assignment by summarizing the predictions of multiple random trees (Jang et al., 2018; Li et al., 2018). Multinomial naïve Bayes (MNB) calculated the a priori probabilities of a sample belonging to a class (Pan et al., 2018). The gradient boosting decision tree (GBDT) classifier optimized an additive classification model by the step-wise forward strategy (Liang et al., 2019; Wang et al., 2019). The BPNN was proposed by Rumelhart et al. in 1986 as a multilayer feedforward neural network (Rumelhart et al., 1986). Xgboost was a gradient-based classifier that has been used to predict many sequence-based bioinformatics problems (Deng et al., 2019; Qiang et al., 2018). Extreme learning machine (ELM) was a simplicity-based classifier and provides a very rapid learning speed for many datasets (Li et al., 2019; Zhang et al., 2019).
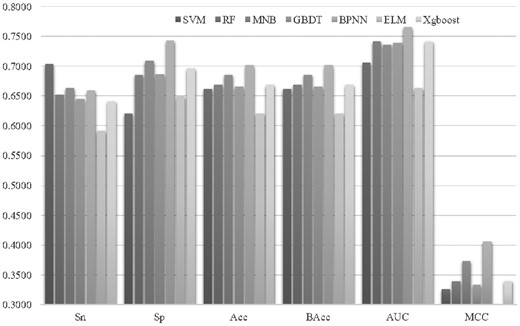
Classification performances of seven classifiers using features selected by SVM-RFE. The seven classification algorithms were SVM, RF, MNB, GBDT, BPNN, ELM and Xgboost. The horizontal axis gave the six performance metrics, i.e. Sn, Sp, Acc, bAcc, AUC and MCC. The vertical axis was the value of these performance metrics
The feature subset selected by SVM-RFE was evaluated for its classification performances using the seven classification algorithms mentioned above, and all the performance metrics were averaged over 20 random runs of the 5-fold cross-validation strategy. Figure 3 illustrated that BPNN outperformed all the other six classification algorithms on the SVM-RFE selected features in all the performance metrics except for Sn. At least 1.56% improvement in Acc was achieved by BPNN compared with the other six classification algorithms.
The classification algorithm SVM was the embedded classifier in the feature selection algorithm SVM-RFE, and SVM outperformed BPNN by 0.0439 in Sn, as shown in Figure 3. But SVM did not achieve a good specificity (Sp = 0.6203), and its overall accuracy (Acc = 0.6619) was 0.0397 smaller than that of BPNN (Acc = 0.7016). So the classification algorithm BPNN performed the best and was used in the following sections.
3.3 Optimize the parameters of SVM-RFE
The 5-fold cross validation strategy was used to calculate the prediction performances of the classifier BPNN on the training dataset (denoted as training performances), and then the test dataset was used to evaluate the model trained over the training dataset (denoted as testing performances). The parameters were tuned to optimize the testing performances by the step-wise zooming strategy.
The parameter C of SVM-RFE was tuned in four steps with different scaling resolutions, as shown in Figure 4. First, the BPNN classification performance metrics were calculated for each of the 10 choices C∈[1, 10] with step size 1, as shown in Figure 4a. The best testing accuracy was achieved for C = 2, while the best training accuracy was achieved for C = 3. So the screening region was switched to [0.1, 3] and the step size was set as 0.1, as shown in Figure 4b. The best classification performances of both training and testing datasets were achieved for C = 0.3. The next refining region was set to [0.21, 0.40] with step size 0.1, as shown in Figure 4c. The top three best testing accuracies were achieved for C = 0.29, 0.30 and 0.31. Therefore the final refining step screened the region [0.281, 0.320] with step size 0.001. The following sections used C = 0.294 with the best prediction accuracies for both training and testing datasets, as shown in Figure 4d.
![Optimizing the parameter C of SVM-RFE. (a) C∈[1, 10] with step size 1, (b) C∈[0.1, 3] with step size 0.1, (c) C∈[0.21, 0.40] with step size 0.01 and (d) C∈[0.281, 0.320] with step size 0.001. The accuracy curves of the training and testing datasets were plotted in solid and dashed lines, respectively](https://oup.silverchair-cdn.com/oup/backfile/Content_public/Journal/bioinformatics/36/1/10.1093_bioinformatics_btz506/3/m_bioinformatics_36_1_49_f4.jpeg?Expires=1716370694&Signature=kHZV9SrIZFHftR9vIQ7J4-zx9mhrgwfpGWkOi6fqsf1WE817vMeshy49LppBtpcPfKCgBnAXM-lS2isKa2BSLCI-PxtBNko470zLqHN-7n7-VvnWL2dgSnv4kx8IqpTbWjX3lrnksUMmQGEKlN82gz7BdoPJq~Ufj29kYys2Ml4R8mTZxQeiCUn9m6l1u0R55R7TnfjYPyIe1g5x8WvTHIgJALp6-fBKje9kFXgM7T4zORzxwHxbiN8z1k5PExDJcivvf50SbWQY0aS37UvdeO3lR22hQ-Gb8XY9dorQb4wvE7Y92SCxUr~3V5wQT7IRkCbCZqPMmOnPBO6j-V7Gdg__&Key-Pair-Id=APKAIE5G5CRDK6RD3PGA)
Optimizing the parameter C of SVM-RFE. (a) C∈[1, 10] with step size 1, (b) C∈[0.1, 3] with step size 0.1, (c) C∈[0.21, 0.40] with step size 0.01 and (d) C∈[0.281, 0.320] with step size 0.001. The accuracy curves of the training and testing datasets were plotted in solid and dashed lines, respectively
3.4 Double feature screening by the linear SVM weights
A double feature screening strategy was applied to the classifier SVM to find a feature subset with the best classification performance. Each round of feature screening normalized the SVM weights as percentiles, and only the features with weights no smaller than the threshold value were kept for further analysis. So the two threshold values T1 and T2 were evaluated for their classification performances.
Figure 5a illustrated that the first round of feature screening generated fewer features when T2 ≤ 0.5. After T2 > 0.5, the change of feature number had a different trend. No features were selected when T2 > 1.5 and T1 < 0.25. T2 = 1.5 and T1 = 0.2 also generated no features. Figure 5b suggested that more features did not mean better prediction accuracies. The best prediction accuracy of 0.7252 was achieved when T2 = 0.8 and T1 = 0.3. The data also suggested that T1 = 0.3 generated good prediction accuracy for different T2 values. So the following sections used T1 = 0.3 and T2 = 0.8.
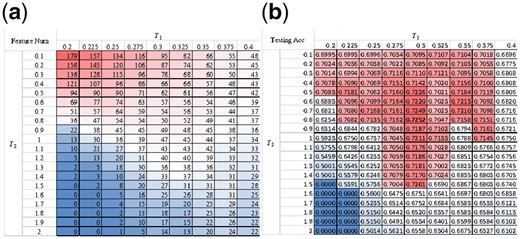
Performance comparison for different values of T1 and T2. (a) Feature numbers and (b) overall accuracy of the 5-fold cross-validation on the testing dataset
3.5 Find the best pair of neural network layer number and neuron number
Figure 6 illustrated that a smaller number of layers led to a better averaged testing Acc, and the best averaged testing Acc = 0.7230 was achieved for one-layer BPNN. However, the fluctuated testing Acc was not linearly correlated with the parameter a. The averaged testing Acc suggested that the parameter neuron feature ratio a = 1.2 achieved the best performance testing Acc = 0.7265. However, the best performing duet (d, a) was actually (1, 1.6), which achieved the testing Acc = 0.7285. The following section used (d, a) = (1, 1.6) for the other experiments.
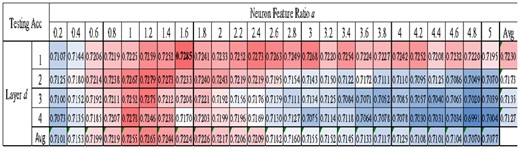
Performance comparison of different number of neurons and layers. The BPNN model was evaluated for its testing Acc using different choices of the two parameters. The last column gave the averaged testing Acc over the same row (of the parameter neuron feature ratio a). The last row gave the averaged testing Acc over the same column (of the parameter layer number d)
3.6 Dropout rate of BPNN
The parameter dropout rate played an essential role in optimizing a neural network (Wang et al., 2018), and the performance of a prediction model usually did not linearly correlate with the dropout rate (Bonn et al., 2018). Our data also illustrated this pattern that the prediction model might behave just like a random guess with the testing Acc = 0.5574 when the dropout rate was 0.99, as shown in Figure 7. After the dropout rate was increased to 0.10, the testing Acc reached a plateau until 0.50. The maximum value of 0.7285 was achieved when the dropout rate was 0.40. This value was used for the rest of this study.
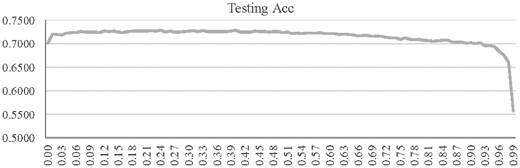
The testing Acc of the classifier BPNN with different dropout rates. The horizontal axis gave the dropout rate, and the vertical axis was the testing Acc
3.7 Final models and the comparison with the existing study
Twenty runs of BPNN with different random seeds and the best parameter choices mentioned above were carried out on the four datasets, as shown in Figure 8. BPNN runs very slowly. The first recall function was removed and the training iterations were reduced in half. Figure 8a suggested that the final models on the four datasets performed accurately and stably. The prediction accuracies of our final models were also positively correlated with those of the existing study (Liu et al., 2018a) on these four datasets.
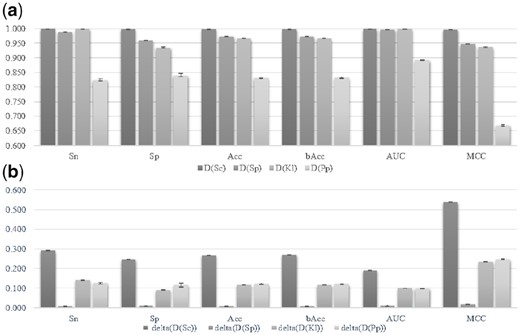
Performance evaluation and comparison of the final models. (a) The averaged value and standard deviation of 20 random runs of the leave-one-out validation on the four datasets D(Sc), D(Sp), D(Kl) and D(Pp). (b) The performance metrics of the final models minus those of the previous study. The error bars of both sub-figures were calculated from the 20 random runs
Our final models outperformed the previous study (Liu et al., 2018) in all the six performance metrics on the four datasets, D(Sc), D(Sp), D(Kl) and D(Pp), as shown in Figure 8b. This study only achieved a minor improvement in Acc (Acc = 0.973) on the dataset D(Sp), because the previous study already achieved a very good Acc = 0.965. At least 11% improvement in Acc was achieved for the other three datasets. The largest improvement of 0.269 in Acc was achieved on S.cerevisiaea, where the prediction accuracy was improved from 0.730 to 0.999. The performance variations were no more than 0.010 over the 20 random runs for all the four datasets. The previous study did not calculate multiple random runs, so the error bars were not compared with the previous study.
3.8 Evaluation of other PseKNC features and the biological implications
A further investigation was carried out to evaluate whether the other PseKNC feature groups may improve our models, as shown in Supplementary Figure S1. There are 12 feature groups for each of the types 1 and 2 of PseKNC. This study utilized the feature groups MW and NU of type 1. The experimental data suggested that the two feature groups MW and NU achieved the best prediction accuracies.
The selected features demonstrated statistical significance associated with the DNA replication origins and AT richness, as supported by the literature.
Details may be found in Supplementary Materials due to the page limit.
4 Conclusion
The main contribution of this study was to comprehensively evaluate multiple algorithms to select a subset of DNA sequence features with the best classification accuracies of the yeast DNA replication origins. The best duet of feature selection and classification algorithms was SVM-RFE and BPNN. The prediction models of the DNA replication origins of all the four benchmark yeast genomes were improved compared with the literature. The DNA sequence features chosen in this study demonstrated the AT-rich pattern, which supported the previous observations of the DNA replication origins.
Acknowledgements
The constructive comments from the anonymous reviewers were greatly appreciated.
Authors Contributions
F.Z. and X.F. conceived the project. F.Z., X.F., C.L., J.Z. and R.S. designed the experiments and carried out the analysis. W.Z., Y.W., G.W. and L.H. contributed to the experimental design and results and discussions. Q.W. established the online prediction server. All the authors contributed to the manuscript drafting and have approved the final version of the manuscript.
Funding
This work was supported by the Strategic Priority Research Program of the Chinese Academy of Sciences (XDB13040400); Jilin Provincial Key Laboratory of Big Data Intelligent Computing (20180622002JC); the Education Department of Jilin Province (JJKH20180145KJ) and the startup grant of the Jilin University. This work was also partially supported by the Bioknow MedAI Institute (BMCPP-2018-001), and by the Fundamental Research Funds for the Central Universities, JLU.
Conflict of Interest: none declared.
References
Author notes
The authors wish it to be known that, in their opinion, Chenwei Lou, Jian Zhao Fengfeng Zhou should be regarded as Joint First Authors.

