


Abstract
Annotating a given genomic locus or a set of genomic loci is an important yet challenging task. This is especially true for the non-coding part of the genome which is enormous yet poorly understood. Since gene set enrichment analyses have demonstrated to be effective approach to annotate a set of genes, the same idea can be extended to explore the enrichment of functional elements or features in a set of genomic intervals to reveal potential functional connections.
In this study, we describe a novel computational strategy named loci2path that takes advantage of the newly emerged, genome-wide and tissue-specific expression quantitative trait loci (eQTL) information to help annotate a set of genomic intervals in terms of transcription regulation. By checking the presence or the absence of millions of eQTLs in a set of input genomic intervals, combined with grouping eQTLs by the pathways or gene sets that their target genes belong to, loci2path build a bridge connecting genomic intervals to functional pathways and pre-defined biological-meaningful gene sets, revealing potential for regulatory connection. Our method enjoys two key advantages over existing methods: first, we no longer rely on proximity to link a locus to a gene which has shown to be unreliable; second, eQTL allows us to provide the regulatory annotation under the context of specific tissue types. To demonstrate its utilities, we apply loci2path on sets of genomic intervals harboring disease-associated variants as query. Using 1 702 612 eQTLs discovered by the Genotype-Tissue Expression (GTEx) project across 44 tissues and 6320 pathways or gene sets cataloged in MSigDB as annotation resource, our method successfully identifies highly relevant biological pathways and revealed disease mechanisms for psoriasis and other immune-related diseases. Tissue specificity analysis of associated eQTLs provide additional evidence of the distinct roles of different tissues played in the disease mechanisms.
loci2path is published as an open source Bioconductor package, and it is available at http://bioconductor.org/packages/release/bioc/html/loci2path.html.
Supplementary data are available at Bioinformatics online.
1 Introduction
A large number of high throughput experiments have been producing results that can be summarized as a list of genomic intervals. For example, peaks from ChIP-seq (Barski et al., 2007; Johnson et al., 2007; Robertson et al., 2007), humps from ATAC-seq (Buenrostro et al., 2013, 2015), DNase-seq (Song and Crawford, 2010), differential methylated regions (DMRs) from WGBS (Jaffe et al., 2012; Lister et al., 2008), or linkage disequilibrium (LD)-spanned neighborhood around significant disease-associated single nucleotide polymorphisms (SNPs) identified from Genome Wide Association Studies (GWASs) (Welter et al., 2014). Typically, thousands or tens of thousands of such intervals are in the list, hence it is impossible to explore them one by one. How to effectively and efficiently discover biological properties and reveal biological insights from these large number of genomic intervals is an important yet challenging task.
A common practice for interpreting such findings is a two-step process. First, link each of the genomic interval to its nearest gene, then study the properties of the list of genes derived from all the intervals, typically using methods such as gene ontology (GO) (Ashburner et al., 2000) term enrichment analysis (Huang et al., 2009) and gene set enrichment analysis (GSEA) (Subramanian et al., 2005). Examples of such approach are GREAT (McLean et al., 2010) and Enrichr (Kuleshov et al., 2016). The rationale behind such a method is because most of the biological knowledge we have collected so far focus on genes. A drawback of this approach is that many of the genomic intervals are tens or even hundreds of kilobase pairs away from their nearest gene hence the assignment will be difficult to justify. Recent findings from chromosomal conformation capture-based technologies have showed that a distant regulatory element may be put in touch with its target gene by chromosomal looping (Smemo et al., 2014). Conversely, in gene-dense genomic regions, typically multiple genes can be found within the 10 kb radius of a variant, making assigning the target gene by proximity comparable to random guessing. More importantly, since many genes exert their functions in a context-specific and tissue-specific manner, their property may not always be transferable to its nearby genomic interval. Both gene expression and epigenetic regulation are dynamic across different cell and tissue types (Torres et al., 2014; Wang et al., 2016), and such information is not considered in distance-based methods. Therefore, it is of great interest to explore the function of genomic intervals beyond inferring their functions simply from its closest gene.
Rather than using nearby genes as surrogates, an alternative strategy is to explore the enrichment of functional elements inside these genomic intervals. Examples include DNA sequence motifs, DNA conservation and CpG Islands. More recently, thanks to large consortium efforts such as ENCODE (Bernstein et al., 2012), REMC (Bernstein et al., 2010) and IHEC (Stunnenberg et al., 2016), increasing number of functional elements such as in vivo transcription factor binding sites detected by ChIP-seq experiments have been systematically cataloged. One can check whether their genomic intervals of interest are enriched with any type of functional elements (Griffon et al., 2015). The same idea can be extended to other types of biological meaningful genomic entities. For example, checking the enrichment of trait-associated SNPs (taSNPs) identified by GWAS can help link the set of genomic intervals to diseases or traits (Chen and Qin, 2016).
Similar to GWAS-identified taSNPs, another important type of functional variants is the expression quantitative trait loci (eQTL), which are variants that show evidence of association with the expression level of their target gene(s)—referred to as eGene(s) from now on. Transcription regulation is one of the most important types of functional annotation in the non-coding part of the genome, and eQTLs provide direct evidence of such connection. The existing eQTL catalogs (Dimas et al., 2009; Montgomery et al., 2010; Pickrell et al., 2010; Stranger et al., 2007) have seen significant boost in recent years thanks to the Herculean effort of the Genotype-Tissue Expression (GTEx) consortium (Aguet et al., 2017). GTEx provides a comprehensive eQTL catalog with high quality and sufficient power given the large sample sizes and extensive collection of tissue types. We felt that GTEx eQTLs provide a remarkably valuable resource to include in enrichment analysis for genomic intervals, given it provides a bona fide link to the genes these loci potentially regulate. Two aspects of the eQTL data can greatly improve the discovery of functional links between genomic loci and genes. First, the association between loci and genes does not depend on genomic distance, which has been shown to be unreliable (see Section 3). Second, unlike proximity-based gene assignment, which is static, eQTL information is tissue-specific, in that an eQTL may regulate its eGene, only in one or two specific cell or tissue types. Which make the biological interpretation much more specific and informative.
We believe that studying the enrichment of eQTLs at the pathway or gene set level, instead of at the individual gene level, is necessary. In any given tissue, only ∼20−30 eQTLs are found for each eGene in GTEx on average, and most of them are located near their eGene—since GTEx primarily focused on cis-eQTL. Therefore, eQTLs for a single gene do not spread out of the neighborhood of their eGenes, and not suitable to test the enrichment of eQTLs for each gene individually. On the other hand, most pathways or gene sets contain tens to hundreds of genes that are functionally related and spread across multiple chromosomes. Hence, checking the enrichment of eQTLs whose eGenes belong to the same pathway or gene set can help us to potentially build connections between the genomic intervals and pathways or functional gene sets that may lead to hypothesis of possible underlying biological mechanisms. Some recent works (Ahmed et al., 2017; Li et al., 2016) show potential to perform functional enrichment analysis using eQTL data. However, a systematic evaluation of tissue-specificity is still lacking. In this work, we describe loci2path, a computational tool as an R Bioconductor package to enables straightforward enrichment analysis of eQTLs in pathways/gene sets for a set of genomic intervals. The current version of loci2path utilizes the entire eQTL catalog from the GTEx v6p data release, which contains 1 702 612 unique eQTLs associated with 16 562 unique eGenes identified from 44 tissue types (Supplementary Table S1). As of pathways and gene sets, the current version of loci2path contains 6320 pathways from MSigDB (Liberzon et al., 2011) belonging to the BioCarta, KEGG and GO categories. To illustrate the utilities of loci2path, we test various trait-/disease-related genomic regions constructed from immune-related disease database immunoBase (www.immunobase.org) as query regions.
2 Materials and methods
2.1 Enrichment measurement
For one eQTL set and one gene set , we use the P-value from enrichment test (Fisher’s exact test) to evaluate the significance of the enrichment. The default enrichment test is carried out with gene-based mode, in which loci2path will firstly identify eGenes associated with eQTLs from covered by the query regions, then evaluate the significance of enrichment of these eGenes within a given gene set . In loci2path, the default enrichment testing procedure is to test the enrichment of eGens, not eQTLs. This is because multiple eQTLs may be linked to the same eGene due to LD. As a result, many of the eQTLs may be redundant and should not be counted. The details of the enrichment testing procedure can be found in Supplementary File S1.
2.2 Assessment of tissue specificity
2.3 Tissue specificity measured by average tissue number
2.4 Output
All the enrichment scores, counts used in the calculation and tissue/gene set identifiers are organized in a table as output. Each row of this result table contains data of a pair of eQTL set and gene set . All the rows are ranked by P-values calculated from the Fisher exact test by default.
2.5 Multiple-test correction using adjusted P-value
Adjusted P-value is calculated using ‘BH’ method (Benjamini and Hochberg, 1995) from function p.adjust() in R. We use 0.01 as the default threshold, which corresponds to nominal P-value threshold of 1e−4. We choose this P-value threshold based on experience. From our observation, we found this P-value threshold is a reasonable choice to select roughly the top 1% of the pathways on average within each tissue.
2.6 Rank-based permutation test
The number and composition of eGenes vary substantially across different tissues. Therefore, results of parametric tests such as Fisher’s exact test are sensitive to such variations when applied across tissues types. In order to adjust for multiple testing under such a scenario, we propose to apply a non-parametric, rank-based permutation test to evaluate the significance of enrichment. The enrichment test method we devised is similar to the one used in Enrichr (Kuleshov et al., 2016). Details of the rank-based permutation test is described in Supplementary File S1.
2.7 Datasets
GTEx eQTL. In this study, we collected the full set of eQTLs from the GTEx project, which are composed of eQTL studies from 44 tissue types. GTEx eQTL data were downloaded from GTEx via the link: http://www.gtexportal.org/static/datasets/gtex_analysis_v6p/single_tissue_eqtl_data/GTEx_Analysis_v6p_all-associations.tar. Entrez ID is used as the default gene identifier. If the gene identifier is different between eQTL study and the gene set, they are all converted to Entrez ID. Unmapped genes are not included.
MSigDB pathways. Pathway and gene sets for this study were downloaded from the MsigDB website: http://software.broadinstitute.org/gsea/downloads.jsp. Entrez ID was used as the identifier of genes across all the gene sets.
Gene annotation. Genome coordinates of all the entrez genes on reference genome hg19 were obtained using UCSC Known gene table, retrieved with Bioconductor/GenomicFeatures package. This is the most updated version (downloaded 24 October 2016). There are in total 23 056 genes, only 21 063 of the MSigDB Entrez ID can be matched onto this set (∼65%). By manually checking the missing genes, a majority of these records were withdrawn pseudo genes, therefore they are excluded in the downstream analysis.
Gene expression. Tissue-specific gene expression level was obtained from GTEx data portal. The median RPKM table (GTEx_Analysis_v6p_RNA-seq_RNA-SeQCv1.1.8_gene_median_rpkm.gct) is used to quantify gene expression. Gene expression data for the 44 tissues were downloaded from GTEx portal from the file named ‘GTEx_Analysis_v6p_RNA-seq_RNA-SeQCv1.1.8_gene_median_rpkm.gct.gz’. This file contains median gene expression values (measured in RPKM) by tissue.
3 Results
3.1 Overview of loci2path
The components and workflow of loci2path are shown in Figure 1. We utilize eQTL data from the GTEx project, and pathway information from MSigDB for this study. In the beginning, loci2path takes in a set of genomic regions as input. We next count the total number of eQTLs that fall in these intervals for each pathway (or gene set) and tissue-type combination. This is then followed by enrichment test and tissue-specificity evaluation. In order to evaluate tissue specificity, we calculate the frequency that an enriched pathway is detected across all tissues. The result contains two pieces of information: (i) enriched pathways connected to the queried loci, ranked by enrichment; (ii) the tissue type in which this enrichment is detected. Users can customize the query result by sorting pathways based either on enrichment test P-values or DTS (see Section 2). Additional summary data, such as the numbers of eGenes or eQTLs, the size of the pathway, are also presented which may be used to filter the results. A list of output fields can be found in Supplementary Table S2, and a sample of query output for can be found in Supplementary File S2.
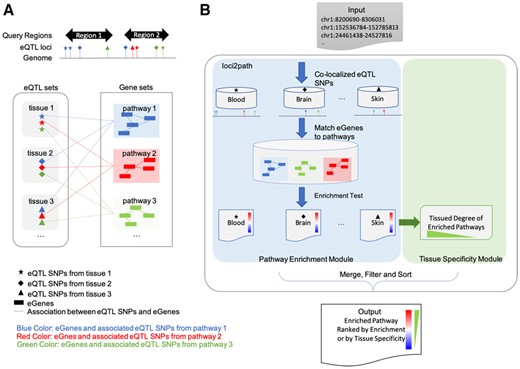
Overview of loci2path. (A) Illustration of the loci2path software. We use shapes to mark tissue or cell types, and colors to differentiate pathways. In the eQTL box, eQTL locations from different tissues are shown in different shapes. In the pathway box, genes from different pathways are shown in different colors. Dash lines represent the association between eQTL and eGenes. (B) illustration of loci2path workflow. (Color version of this figure is available at Bioinformatics online.)
In order to visualize both the pathway enrichment and the tissue specificity, loci2path presents the main query result as a heatmap. The rows of the heatmap are enriched pathways; the columns are tissues. Rows and columns are arranged by hierarchical clustering. The color for each cell indicates the degree of enrichment, rendered from red to blue as negative log P-values vary from high to low. We show in the following analysis that this visualization method helps to reveal interesting enrichment patterns and offer clues on potential links between genetic variations and disease pathogenesis.
Examining the relationships among eQTLs, eGenes and tissue types composition in GTEx data reveals that only about 25% of the times that the closest gene of an eQTL turned out to be its eGene (Fig. 2A). This result highlights the danger of simply assigning the target genes by genome proximity. On the other hand, around 10% of the eQTLs are located in loci where multiple genes are located within a 10-kb neighborhood (Supplementary Fig. S1), in which case assigning the target gene by proximity is very unreliable. Next, we explore the tissue-specificity of eQTLs and eGenes. The DTS for a gene is decided by the number of tissues in which this gene is detected as eGene (see Section 2). We find that around 30% of eQTLs are detected in only one tissue (i.e. tissue specific), while more than half of all eQTLs are detected in one or two tissues (Fig. 2B). However, the proportion of tissue specific eQTLs vary drastically among different tissues (Fig. 2C).
![Summary of eQTLs and tissue specificity. (A) The percentage of eQTLs whose eGene is its nearest gene. The three bars represent three different ways to define the nearest gene. For an eQTL-eGene pair, three types of distance are considered: (1) distance to the gene promoter (defined as −2000 ∼ +200 bp of the transcription start site (TSS); (2) distance to the gene body [from TSS to the transcription end site (TES)]; (3) distance to promoter and gene body (from 2000 bp upstream of TSS to the TES). (B) The breakdown of all eQTLs according to the number of tissue(s) in which the eQTL is found to be significant. The percentages are: 1: 38.7%; 2: 14.5%; 3: 8.4%; 4: 5.7%; 5: 4.0%; 6: 3.3%; 7: 2.6%; 8: 2.3%; 9: 1.9%; 10: 1.7%; >10: 16.8%. (C) Distribution of degree of tissue specificity (DTS) of eQTLs within each tissue. Each bar shows the composition of eQTLs with different DTS. Tissues are ordered with an increasing average DTS](https://oup.silverchair-cdn.com/oup/backfile/Content_public/Journal/bioinformatics/36/3/10.1093_bioinformatics_btz669/5/m_btz669f2.jpeg?Expires=1716367846&Signature=ml0BEo7EQs9xbi14oeNc8MmDawBsrcr9GXD2Z4ZIP9qrfmNZyfuRdwxV1geoAm1LAZfVabPjRsKYJo7KKCZvPkfsPrnnJbfMlHfKVcId4EcsrXH23ZxjQsjcxhmTiVFZGk06DhCcpvttASXchX1-DsISSJ6WkQoyl0-N2wivUdAS500v4U4DahuFToc3v7R26~YdLyfntUF7uhPBRev-LE6e1KLzd3sLvH1oCLxDg3aK7av-zQxKrjRE4fEgxdx~gwsFXj4pudgQLcYewz5oh~hrTz7QpACDxKMqS8BRPcxTajvlT0-~pkkP-K0oH3imljOBZ7X9VdX-r7QvCQ5wGA__&Key-Pair-Id=APKAIE5G5CRDK6RD3PGA)
Summary of eQTLs and tissue specificity. (A) The percentage of eQTLs whose eGene is its nearest gene. The three bars represent three different ways to define the nearest gene. For an eQTL-eGene pair, three types of distance are considered: (1) distance to the gene promoter (defined as −2000 ∼ +200 bp of the transcription start site (TSS); (2) distance to the gene body [from TSS to the transcription end site (TES)]; (3) distance to promoter and gene body (from 2000 bp upstream of TSS to the TES). (B) The breakdown of all eQTLs according to the number of tissue(s) in which the eQTL is found to be significant. The percentages are: 1: 38.7%; 2: 14.5%; 3: 8.4%; 4: 5.7%; 5: 4.0%; 6: 3.3%; 7: 2.6%; 8: 2.3%; 9: 1.9%; 10: 1.7%; >10: 16.8%. (C) Distribution of degree of tissue specificity (DTS) of eQTLs within each tissue. Each bar shows the composition of eQTLs with different DTS. Tissues are ordered with an increasing average DTS
3.2 GTEx eQTL data from 44 tissues
We downloaded all significant eQTLs from the GTEx data portal. The number of eQTLs and eGenes are summarized in Supplementary Table S1. This dataset contains eQTLs identified from 7051 samples representing 44 different tissue types collected from 449 donors (Aguet et al., 2017). From Supplementary Table S1, we noted that the numbers of eQTLs and eGenes vary among tissues. The number of eQTLs ranges from 34 898 (Uterus) to 577 857 (Thyroid) and the number of associated eGenes ranges from 542 (Vagina) to 6990 (Tibial Nerve). The sample size is a major factor of the wide range of eQTL/eGene numbers (Supplementary Table S1), though other factors such as tissue-specific gene expression (Aguet et al., 2017) and postmortem interval (Ferreira et al., 2018) might also contribute to such differences. The 44 tissue types contain clusters of homogeneous tissues, such as multiple types of brain, skin, muscle and artery cells.
3.3 MSigDB pathways
We collected pre-defined gene pathways (or gene sets) from the MSigDB (Liberzon et al., 2011; Subramanian et al., 2005). In this study, we query loci2path for enrichment of three categories of MSigDB pathways: GO term gene sets, KEGG pathways and BioCarta pathways. GO terms offer a comprehensive resource for functional annotation of genes. In this study, we collected all three GO gene set categories from MSigDB’s class C5 gene sets including BP-biological process, 4436 gene sets; CC-cellular component, 580 gene sets; MF-molecular function, 901 gene sets. In addition, we included BioCarta pathways to accommodate more details of interactions among gene members regardless the hierarchical relationships among gene sets that are comprehensively defined in GO. In total, 217 BioCarta gene sets from MSigDB’s C2: curated gene sets were downloaded. We also collected 186 KEGG pathways to detect metabolism-related functions. Details of the pathway resources are listed in Section 2.
3.4 Query regions from immunoBase
To illustrate the utility of loci2path, we first test it on genomic regions containing genetic variants that are known to be associated with immune-related diseases. For each disease, we use risk regions defined by immunoBase (https://www.immunobase.org/) as the input. ImmunoBase provides a curated data source for immunologically related human diseases. This collection of findings from GWASs and fine mapping studies using the immunoChip serves as a valuable resource to study immunological disorders (Cortes and Brown, 2011; Polychronakos, 2011). Then the neighborhood around each GWAS variant based on local LD is added and overlapping neighborhoods are merged to form disease risk regions. For example, the input regions for psoriasis are constructed by merging regions within the ±0.1centimorgan genetic linkage ranges around disease-related variants (https://www.immunobase.org/region/table/PSO/). Using these data, Chun et al. identified autoimmune-disease-related risk signal enriched in gene regulatory regions in a tissue-specific manner (Chun et al., 2017). In our study, we conduct a pathway enrichment analysis leveraging eQTL information which allows us to study the tissue-specificity of functional enrichment within pathways. We choose to investigate all the 12 core immune diseases originally targeted by the immunoChip consortium. The genomic range of query regions are summarized in Supplementary File S3.
3.5 Tissue specificity captures distinct modules of pathogenesis in psoriasis
Psoriasis (OMIM ID: 177900) is a common, chronic skin disorder with a complex genetic and environmental etiology characterized by epidermal hyper-proliferation, vascular remodeling and inflammation (Nestle et al., 2009). Many genetic studies (Greb et al., 2016; Gudjonsson and Elder, 2007; Hwang et al., 2017) including GWAS studies (Strange et al., 2010) and meta-analyses (Tsoi et al., 2015) have been conducted and tens of genomic loci have been identified as psoriasis associated. In ImmunoBase, 45 loci are included in 35 regions covering a total of 10.69 million base pairs (MB). A heatmap of highly enriched pathways is shown in Figure 3 (∼0.01 FDR based on rank-based permutation test, see Section 2; equivalent P-value threshold on Fisher’s exact test is 1e−4). A complete query result table after filtering is presented in Supplementary File S4.
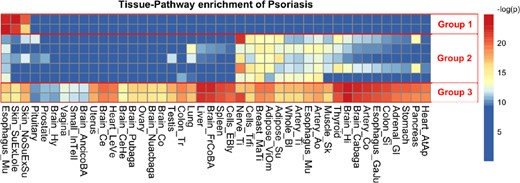
Query result of psoriasis risk regions. Heatmap of eQTL enrichment in different tissue-pathway combinations for psoriasis. Each row of the heatmap represents a pathway; each column represents a tissue type. Each cell shows the significance of enrichment indicated by –log(P-value). Red color indicates strong enrichment, while blue indicates no enrichment. Three groups of nine pathways with distinct DTS are selected to generate the heatmap and highlighted with red boxes and numbered as groups 1 − 3. (Color version of this figure is available at Bioinformatics online.)
From the heatmap shown in Figure 3, we notice that among all the GO pathways that have been identified to show significant enrichment of eQTLs inside these 35 regions, three different groups of GO pathways are present with substantial difference in their enrichment patterns across tissue types. Pathway group 1 are enriched only in epidermis tissue types, including two skin tissues and mucosa. Pathway group 2 show enrichments in several tissue types that harbor dendritic cells with fuzzy block edge but are absent from the majority of brain tissues. It is interesting to see that the main function of these pathways is down regulating immune-response; and dysfunction of such pathways have been linked to autoimmune diseases such as psoriasis. Pathway group 3 are all major histocompatibility complex (MHC) I peptide presentation pathways, and they are enriched across all tissue types. The pathways from these three group are listed in Table 1.
Enriched pathway groups of psoriasis risk regions
| Group | Pathways | Shared eGenes |
|---|---|---|
| 1 | Keratinization (50)a | LCE3C, LCE3D, LCE3E LCE1E, LCE3A |
| Peptide cross linking (56) | ||
| 2 | Negative regulation of cell killing (18) | HLA-B, MICA, LGALS9 |
| Regulation of cell killing (63) | ||
| Negative regulation of innate immune response (38) | ||
| Regulation of leukocyte-mediated immunity (53) | ||
| Negative regulation of natural killer cell mediated immunity (12) | ||
| 3 | Antigen processing and presentation of endogenous peptide antigen (14) | HLA-B, ERAP2, HLA-C, ERAP1 |
| Antigen processing and presentation of endogenous antigen (17) |
The numbers of genes within each pathway is shown in the parenthesis.
In Figure 4A, we use LCE cluster 3 genes as an example to show the spatial relationships among query region, eQTLs, eGenes and additional GWAS evidence in the genome. Figure 4B shows that DTS analysis yield the same three categories, in accordance with the patterns shown in the heatmap. When extracting member genes from each category we discover distinct composition of gene members, and we also notice distinct clusters of gene functions within each group. Figure 4C shows the most frequent genes from each pathway group. Group 1 are dominated by late cornified envelope (LCE) family genes. Multiple LCE genes are co-localized in the 1q21.3 region and was defined as the LCE cluster 3 genes. The deletion of the gene LCE3B and LCE3C has been previously identified as a risk factor for psoriasis (De Cid et al., 2009). However, within this gene-dense region, assigning the closest gene to an eQTL as its target is rather unreliable. Group 2 includes genes involved in innate immune response. For example, MICA is the gene coding NK cell attracting peptide (Menier et al., 2002); NOS2 encodes the cytokine inducible enzyme (Stuart et al., 2010); and LGALS9, a versatile factor in immune homeostasis, is reported to be down-regulated and dysregulate helper T-cell signaling in psoriasis patients (De La Fuente et al., 2012; Golden-Mason and Rosen, 2017). Group 3 have some distinct members involved in antigen processing and presentation, such as ERAP1 and ERAP2, together with Class 1 MHC encoding gene HLA-B and HLA-C. The non-tissue-specific feature among these genes is not surprising, since peptide presentation is a global event across all cells. Variations of these genes will result in the altered antigenic MHC complex that triggered the downstream T-cell activation associated with autoimmunity (Goris and Liston, 2012).
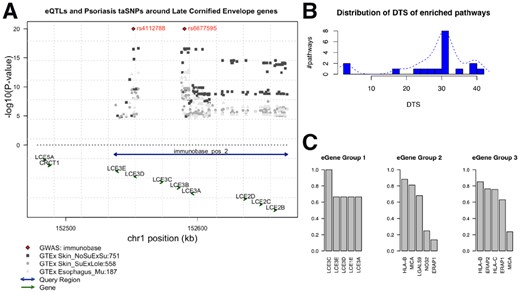
Psoriasis-related functional groups revealed by tissue specificity. (A) Genome browser view of the LCE cluster 3 gene locus as an example to illustrate the spatial relationships among query regions, eQTLs, eGenes in the genome. Arrows located toward the bottom indicate genes, with arrows showing the direction of its transcription. Double-arrow line indicates an input query region. Diamond dots at the top represent GWAS loci associated with psoriasis, according to the immunoBase. Gray dots are GTEx eQTLs, with height denotes the P-value in negative log scale. Different shapes and shades represent different tissue origin. Numbers next to the tissue name abbreviation indicate the number of eQTLs associated with the eGene. (B) Distribution of DTS for enriched pathways using psoriasis risk regions as query. The x-axis is the DTS values for an enriched pathway. The y-axis is the average number of pathways with the corresponding DTS score. For the same pathway enriched in different tissues, the DTS are averaged. We observe three clusters of DTS, which are in concordance with the pathway clusters found in the eQTL enrichment heatmap in Figure 3. (C) Most frequent eGenes from the three groups of enriched pathways using psoriasis risk regions as query. Top five most frequent eGenes from each pathway group are shown. The y-axis is the percentage of pathways within each group that has the corresponding gene as their member gene. For example, in Group 1, six tissue-pathway enrichment records (including two unique pathways; three tissues) were detected by loci2path; LCE3C is a member gene of all the pathways in these six records; LCE3E appears in four out of the six records
After a systematic review of psoriasis pathogenesis, we noticed that these three pathway categories are in concordance with the three major modules of the tentative pathogenesis model of psoriasis, as described by Bergboer et al. (Bergboer et al., 2012). Group 1 pathways are related to skin barrier and keratization module. Group 2 pathways relate to innate immune systems. Group 3 pathways are general immune response pathways of adaptive immune system. It is interesting to note that a well-studied epistasis between HLA and ERAP1 is captured in group 3 pathways (Bergboer et al., 2012; Goris and Liston, 2012). HLA encode individual specific MHC, and ERAP1 code the enzyme involved in trimming HLA class I-binding peptide. Variation in this ERAP1 would affect whether the peptide can be presented to MHC1, thus revealing the mechanism of psoriasis risk within certain population of a specific HLA subtype.
We compared with the query result from GREAT (McLean et al., 2010), using the same set of query regions, and GO terms as pathway gene sets. We found that more than 50% of the top enriched pathways (with P-value <1e−5) from GREAT also appear in loci2path query result. However, we noticed that GREAT fail to detect the skin tissue-specific pathways. Furthermore, loci2path adds tissue specificity information from eQTL data. A complete list of shared pathways, together with unique pathways from both tools are listed in Supplementary File S4.
3.6 Shared risk pathways among 12 core immune disease
Next, we extend our query to all 12 core immune diseases collected by immunoBase. A full list of the names for these diseases and their abbreviations used in this study are listed in Supplementary Table S3. A full list of the disease risk regions (obtained from immunoBase) as input are listed in Supplementary File S3.
We again organize and present the results in heatmaps with rows represent pathways, and columns represent the 12 immune diseases, in order to examine the inter-relationships among the 12 complex immune diseases. We generate three such heatmaps from three immune-related tissues: blood, thyroid and spleen. And we query against two collections of gene sets: BioCarta pathways and GO term gene sets from MSigDB (see Section 2).
From the heatmaps, we observe interesting patterns. First, enrichment patterns across 12 diseases show significant differences across the three tissue types, suggesting that tissue information is important in eQTL studies. Among the three tissues, pathways in the blood show the highest level of enrichment, suggesting the rich potential of repository of immune cells (leukocytes and lymphocytes), in spite of a relatively smaller repository of eQTLs in the blood compared with the thyroid. One surprising example is for autoimmune thyroid disease; no pathway shows enrichment in the thyroid. Additionally, we found that Ankylosing spondylitis and autoimmune thyroid disease show distinct patterns from the other 10 diseases. Further examination of the query regions for these two diseases shows that these regions does not include the region contains the HLA gene complex, which resides on a 3 MB stretch within chromosome 6p21, while all other immune diseases have risk regions overlapping the HLA complex region. Thus, it explains that the different patterns shown in the heatmap.
Within the BioCarta pathways (Fig. 5A), we observe that the Crohn’s disease (CRO) and Ulcerative colitis (UC) share very similar enrichment patterns. This is expected since these are two subtypes of inflammatory bowel disease (IBD) thus sharing numerous enriched pathways. Among the shared enriched pathways, Salmonella pathway is related to bacteria entering membrane of salmonella infected cells, which plays an important role in the onset of IBD (Henderson and Stevens, 2012; Schultz et al., 2017). In addition, several pathways contain members of the Rho genes family: RhoA, Rac and Cdc42 are commonly enriched as well. this is consistent with previous findings that the Rho kinase signal pathway is involved in the three essential beginning stages in the chronic pathogenic procedure of IBD (Huang et al., 2015). Also, pathway Actin Filament Y, one component of cytoskeleton, plays vital role in the disruption of epithelial barriers under inflammatory conditions (Ivanov et al., 2010).
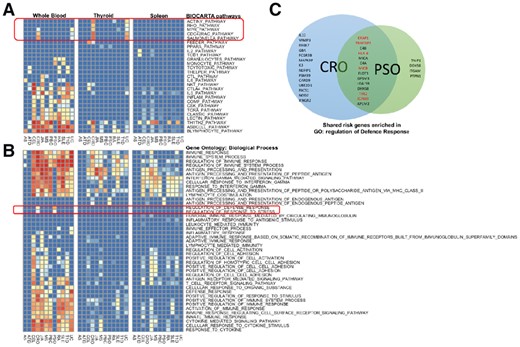
Query results for immune-related diseases. (A) eQTL enrichment heatmaps of BioCarta pathways from three tissue types and 12 immune-related diseases. All 12 sets of immune diseases risk regions were queried against the BioCarta pathway collection in blood, thyroid and spleen tissue types, resulting in three heatmaps. In the heatmaps, each row represents a pathway, and each column represent a disease. IBD-specific pathways are marked with a red box. (B) eQTL enrichment heatmap of GO pathways. Queries were performed in the same way as in (A). Two enriched Biological Process GO terms are specific to psoriasis and CRO, which are highlighted with a red box. (C) Venn’s diagram of gene members of the two distinctly enriched pathways. Twenty-seven genes and 18 genes are targets of eQTLs found inside CRO and PSO disease risk regions, respectively. Among them, 14 genes are in common. Among these 14 shared genes, the ones have been reported in the literature as risk genes of both diseases are highlighted in red
As shown in Figure 5B, in addition to the similar enrichment patterns we found in BioCarta pathways, we also found two unique GO gene sets that are shared by both CRO and PSO but not others. These two gene sets are labeled ‘defense response’ and ‘response to stress’, respectively. When mapping them onto the GO hierarchy, we found that the GO term ‘defense response’ is a leaf node of the GO term ‘response to stress’. Therefore, all the member genes in the ‘defense response’ gene set also belong to its parent node, the ‘response to stress’ gene set. We extracted all the member genes from the larger and upper level gene set with GO term ‘response to stress’ and show them in the Venn diagram (Fig. 5C). We found that in this gene set, 50% of eGenes derived from CRO-related query regions and 70% of the eGenes derived from PSO-related query regions are the same. Further literature research reveals that several genes among them have been identified as common risk genes between CRO and PSO. For example, variants located in the TRAF3IP2 gene contribute to the susceptibility to immune diseases involving the skin or the gut (Ciccacci et al., 2013). JAK family kinase TYK2 functions as mediator of IL-12 and IL-23, which are key factors in the pathogenesis of PSO and IBD. Effective inhibitor of TYK2 provides an attractive therapeutic strategy for such diseases (Miao et al., 2016). ICAM-3 plays an important role in neutrophils to amplify NK cells by producing Interferon-gamma, with supporting evidence from both PSO and CRO patient samples (Costantini et al., 2011). The tissue location of neutrophils also suggests the reason that the enrichment within blood is the most significant among the three tissue types in the heatmap. For the rest of MHC-peptide antigen presenting genes, these shared genes function in defense response pathways, and variants associated with these genes will affect the normal immune defense mechanism by altered antigenicity and immune-regulatory pathways.
3.7 Reduce the impact of imbalanced tissue sample size
Owing to the availability of different tissue types, the sample sizes across the 44 tissue types in GTEx varies considerably, from as low as 70 (Uterus) to as high as 361 (Muscle Skeletal); see Supplementary Table S1. The imbalanced sample size among different tissue types has a significant impact on the number of eQTLs and eGenes identified (Pearson’s correlation between the number of eGenes, eQTLs and the number of sample sizes across 44 tissues is 0.93 and 0.91, respectively; see Supplementary Fig. S2A and B for scatter plots). On the other hand, we found the impact of the sample size on the number of significant pathways identified is less strong. Using psoriasis as an example (Results in Supplementary File S4), the Person correlation between the number of significant pathways identified and the sample sizes is 0.75 (scatter plot in Supplementary Fig. S2C). We believe that the rank-based permutation test can further reduce the impact of the imbalanced sample sizes on the detection of enriched pathways across tissues. To demonstrate this, we again using the psoriasis as an example (Results in Supplementary File S5), we found the Person correlation between the number of significant pathways identified and the sample sizes is only 0.06 (scatter plot in Supplementary Fig. S2D). We again summarized the enriched pathways in a heatmap. A portion of it is presented in Supplementary Figure S3. The rows and the columns in Supplementary Figure S3 are arranged exactly as in Figure 3. From Supplementary Figure S3, we can see similar enrichment patterns in three distinct groups as in Figure 3, indicating that using the alternative permutation test, we will make similar findings as using the default Fisher’s exact test for enrichment evaluation.
3.8 Software availability
R package loci2path is freely available from github.com/StanleyXu/loci2path and Bioconductor with package name ‘loci2path’. User can provide arbitrary query regions in R using the GenomicRanges data type in R. For query regions of 600 kb in total, using the complete 44 tissues GTEx eQTL set, query against the complete BioCarta pathway collection (217 gene sets) takes <1.5 min to finish on a MacBook Pro laptop computer with 2.9 GHz i5 CPU and 8 G RAM. Parallel query mode would further increase the speed on a multi-core computing platform, on which the performance varies due to the working load and availability of resource.
4 Discussion
We developed loci2path, a novel computational tool to annotate genomic regions using comprehensive tissue-specific eQTL information. Functional annotation of genomic regions focuses on gathering various types of functional events happened at these loci and prioritize the annotations. Considering that eQTLs provide valuable information to connect genomic intervals of interest to the potential target genes, we are able to conduct rigorous statistical tests to find pre-defined pathways in which these genes are enriched. Compared with analysis based on single gene that harbor risk of false associations, enrichment analysis provides robust assessment of function by integrating multiple genes with pre-defined pathways and brings insight to biologically meaningful results. We believe that loci2path would help researchers to identify accurate functionality annotation and specific tissue enrichment for query regions of interest.
We perform enrichment analysis using eQTL data to link genes to genomic loci. In this study, eQTL data from GTEx and pathways from MSigDB were collected to study functional enrichment of pathways/gene sets for risk regions harboring variants associated with immune diseases. We discovered that DTS from loci2path query result reveals three different but corroborating underlying pathogenesis modules in the query of psoriasis risk regions. We also discover that pathways that show distinct enrichment patterns in CRO and UC compared with other immune diseases are involved in different ways of pathogenesis of IBD. In addition, we identified common disease risk factors from shared enriched pathways among the three tissue types: population HLA type, variation in antigen-presentation and variation in innate immune response. This pattern shows more significant enrichment in blood, rather than the other two immune-related tissues, perhaps due to the large proportion of leukocytes participating in the immune-related diseases. Similarly, users can define arbitrary genomic regions of interest as query input. The potential applications of loci2path for arbitrary query regions include, but not limited to: regions containing trait-associated SNPs identified by GWAS; regions showing differential methylation levels between two groups; regions harbor different groups of transcription factor occupancy that plays different regulatory roles on target genes in certain diseases; or in general regions showing different patterns of epigenetic modifications captured by diverse experimental techniques, such as ChIP-seq and ATAC-seq.
Loci2path is related to GREAT (McLean et al., 2010) since both tools seek to assign biological meaning to a set of genomic regions by linking them to a set of genes. However, GREAT mainly rely on genomic proximity to make the connection, whereas loci2path use eQTL information to bridge loci and genes. Since eQTLs are tissue-specific, loci2path is able to provide functional annotation in a tissue-specific manner that is highly attractive. Given the difference between these two methods, we recommend using both GREAT and loci2path in real analyses to obtain a more comprehensive result.
The utilities of eQTLs for making biological interpretation have long been recognized in genetics and genomics research fields (He et al., 2013; Li et al., 2016; Watanabe et al., 2017). Compared with existing methods, a unique feature of loci2path is that the purpose is not to provide annotation to individual variants, but rather to provide annotation to the nearby neighborhood of the eSNP, through LD, as a locus having the potential of affecting the regulation of the eGene in specific tissue types. Therefore, although the examples we used in this study come from GWAS-identified trait-associated variants, loci2path can be used to annotate any collection of genomic regions such as called peaks in ChIP-seq studies (Heinz et al., 2010; Qin et al., 2010; Zhang et al., 2008) studies or DMRs from comparative WGBS studies (Feng et al., 2014; Hansen et al., 2012; Wu et al., 2015).
In the future, we plan to continue adding latest eQTL information to loci2pth. It is expected that consortia like GTEx will add more tissue types with increased sample size. Another feature we plan to add is alternative enrichment evaluation measures. Currently, we use a P-value cutoff to determine if an SNP is an eQTL when performing a parametric test or a permutation test. Hence some useful information is lost when we replace the actual P-value by a binary label. It would be highly attractive if we can directly utilize the P-values of these eQTLs when calculating the enrichment. However, there are several challenges lies ahead. First and foremost, P-values measure the significance of association between eQTLs and eGenes. Typically, an eGene is associated with multiple eQTLs, with different P-values. Owing to LD, it is difficult to identify which SNP is the true functional eQTL. In loci2path, we evaluate the significance of a pathway by checking the enrichment of significant eGenes (regardless of how many eQTLs the eGene has) in it. Therefore, without knowing which eQTL is real, it is difficult to come up with a quantitative measure for each eGene based on all the P-values from its eQTLs. Second, caution is needed when comparing P-values across tissue types due to different sample sizes. Third, working with P-values takes space and time, and makes the computation task much more challenging. We plan to further investigate proper ways to utilize P-values in enrichment analysis in the future. Same thought also applies to the order information of the query regions when available.
The loci2path software is written in R and published in Bioconductor. Vectored statistical tests and parallel processing makes it run ultra-fast to perform enrichment tests across eQTL data from multiple tissues. A standard S4 class data structure enable users to customize annotation resources. For example, one might extend the loci-gene connection from eQTL data to any arbitrary mapping relationships, such as known regulatory genomic loci and target genes. We believe that the accumulating eQTL data become increasingly useful as a rich information resource. Thanks to the increasing diverse tissue and cell types and enhanced statistical power due to larger sample sizes, the growing eQTL resource would greatly improve query quality of loci2path. Availability and user-friendly data portals are making research to explore these public resources with loci2path more and more convenient. Together with more refined pathways, there are more enrichment patterns for traits, diseases and health to be uncovered, and loci2path is a powerful tool in this task.
Acknowledgements
We thank two anonymous reviewers for their thoughtful and constructive comments. We thank Dr JT Elder for helpful discussion on the pathogenesis of Psoriasis. We thank the members of the Bioinformatics Interest Group at Emory for helpful discussion throughout the project.
Funding
This work was supported in part by National Institutes of Health grants R56 AG060757 and R56 AG062256.
Conflict of Interest: none declared.

