


Abstract
Gram-positive bacteria have developed secretion systems to transport proteins across their cell wall, a process that plays an important role during host infection. These secretion mechanisms have also been harnessed for therapeutic purposes in many biotechnology applications. Accordingly, the identification of features that select a protein for efficient secretion from these microorganisms has become an important task. Among all the secreted proteins, ‘non-classical’ secreted proteins are difficult to identify as they lack discernable signal peptide sequences and can make use of diverse secretion pathways. Currently, several computational methods have been developed to facilitate the discovery of such non-classical secreted proteins; however, the existing methods are based on either simulated or limited experimental datasets. In addition, they often employ basic features to train the models in a simple and coarse-grained manner. The availability of more experimentally validated datasets, advanced feature engineering techniques and novel machine learning approaches creates new opportunities for the development of improved predictors of ‘non-classical’ secreted proteins from sequence data.
In this work, we first constructed a high-quality dataset of experimentally verified ‘non-classical’ secreted proteins, which we then used to create benchmark datasets. Using these benchmark datasets, we comprehensively analyzed a wide range of features and assessed their individual performance. Subsequently, we developed a two-layer Light Gradient Boosting Machine (LightGBM) ensemble model that integrates several single feature-based models into an overall prediction framework. At this stage, LightGBM, a gradient boosting machine, was used as a machine learning approach and the necessary parameter optimization was performed by a particle swarm optimization strategy. All single feature-based LightGBM models were then integrated into a unified ensemble model to further improve the predictive performance. Consequently, the final ensemble model achieved a superior performance with an accuracy of 0.900, an F-value of 0.903, Matthew’s correlation coefficient of 0.803 and an area under the curve value of 0.963, and outperforming previous state-of-the-art predictors on the independent test. Based on our proposed optimal ensemble model, we further developed an accessible online predictor, PeNGaRoo, to serve users’ demands. We believe this online web server, together with our proposed methodology, will expedite the discovery of non-classically secreted effector proteins in Gram-positive bacteria and further inspire the development of next-generation predictors.
Supplementary data are available at Bioinformatics online.
1 Introduction
Bacterial species are commonly classified based on Gram staining. This method differentiates bacteria into Gram-negative and Gram-positive according to chemical composition and physical structure of their cell walls. Notably, unlike Gram-negative bacteria, Gram-positive bacteria are bounded by a single cytoplasmic lipid membrane, and in general surrounded by a cell wall that is composed of a very thick peptidoglycan layer. This type of bacteria has raised great interest, not only because it includes some pathogenic species that can cause serious infections in humans (Arias and Murray, 2012; Kline and Lewis, 2016; Smits et al., 2016), but also because the single-membrane (monoderm) property of Gram-positive bacteria makes them a useful tool in biotechnology applications. For instance, for the production of recombinant proteins for industrial and therapeutic use, secretion across a single membrane has proven to be a winning strategy (Anne et al., 2017; Bottai et al., 2017; Hamed et al., 2018; Lee and Kim, 2018; Tjalsma et al., 2000). Gram-positive bacteria can secrete proteins across their membrane and cell wall using the ‘classical’ secretion systems, which employ the Sec translocon or the Tat transporter. In contrast, any protein secreted by a pathway other than Sec/Tat has been historically considered a ‘non-classical’.
In eukaryotic cells there is a distinct, mechanistically defined non-classical secretion pathway that delivers a small subset of growth factors and cytokines across the plasma membrane without recourse to the endoplasmic reticulum and Golgi apparatus (Carta et al., 2013; Daniels and Brough, 2017; Prudovsky et al., 2008). In earlier work on non-classical protein secretion in Gram-positive bacteria, bioinformatics methods developed for predicting non-classically secreted proteins (Bendtsen et al., 2005; Restrepo-Montoya et al., 2011; Yu et al., 2010), made use of concepts and methods developed on mammalian secretory proteins (Bendtsen et al., 2004). For instance, using SecretomeP, Bendtsen et al. (2005) developed the first computational method to predict non-classically secreted proteins in Gram-positive bacteria based on a simulated dataset using theoretical considerations from eukaryotic systems. The study used neural networks based on six input features including threonine contents, transmembrane helices, gravy, protein disorder, secondary structure and a specially designed feature based on amino acid composition. They also conducted a literature search to curate known non-classical bacterial secreted proteins. In another recent work, Yu et al. (2010) trained a support vector machines (SVM)-based ternary classifier, SecretP, to predict bacterial secreted proteins using AAC, auto-covariance and other features. Their model was trained based on a smaller dataset of proteins annotated in the SwissProt database with ‘secreted’ and without ‘signal’, which they associate with non-classical secreted proteins. Their prediction results were dissatisfactory due to deficiency of non-classically secreted Gram-positive bacterial proteins. In a more-recent study, Restrepo-Montoya et al. (2011) developed an SVM-based classifier, termed NClassG+, to predict non-classically secreted Gram-positive bacterial proteins based on different sequence transformation vectors, such as frequencies, dipeptides, physicochemical factors and the position-specific scoring matrix (PSSM). It achieved a reasonable performance when tested on an independent set. While previous studies successfully stimulated the discovery of potential non-classical secreted proteins, the existing methods remain in need of improvement due to limited benchmark datasets, the lack of more informative features and use of single machine learning algorithms.
With the benefit of hindsight, and given the additional knowledge gained from numerous studies on the mechanistic details of how proteins are secreted by Gram-positive bacteria, it is important to re-evaluate previous prediction methodologies. Consequently, we started by summarizing the current knowledge about the various protein secretion pathways that can be considered ‘non-classical’, such as the flagella-export apparatus, fimbrilin/prepilin-protein exporter, ABC-transporter systems, holin system, the type VII secretion system, the WXG100 secretion system and membrane vesicle-based delivery (Anne et al., 2017; Desvaux and Hébraud, 2006; Forster and Marquis, 2012; Hamed et al., 2018; Lee and Kim, 2018; Tjalsma et al., 2000; Tsirigotaki et al., 2017; Unnikrishnan et al., 2017; Wang et al., 2016). Subsequently, we constructed the benchmark datasets by collecting all experimentally verified, non-classically secreted Gram-positive bacterial proteins. Accordingly, we assessed a number of more comprehensive features to accurately characterize protein sequences. Such features included a wide range of sequence-derived features as well as those based on evolutionary information or physicochemical properties. Next we trained predictive models based on a recently proposed machine learning algorithm, Light Gradient Boosting Machine (LightGBM) (Ke et al., 2017), with demonstrated high efficiency, scalability and accuracy. In addition, we developed a novel particle swarm optimization (PSO)-based parameter optimization strategy to further increase the performance of our models. Moreover, we investigated the integration of single machine learning-based models into a single ensemble model to enhance the prediction performance further. Based on previously well-optimized models, we constructed a two-layer LightGBM-based ensemble model to take advantage of the different feature groups. When assessed based on the independent test, the two-layer ensemble model demonstrated its superior predictive performance, and outperformed currently available toolkits. Finally, we developed an online server named PeNGaRoo as a preliminary screening of potential non-classically Gram-positive secreted bacterial proteins, which is accessible at http://pengaroo.erc.monash.edu/. We believe the proposed toolkit, together with the summary of ‘non-classical’ secreted protein, will facilitate future computational work in this field.
2 Materials and methods
The overall workflow of the PeNGaRoo methodology is illustrated in Figure 1. There exist several major stages in the development of PeNGaRoo, which are described in the following subsections.
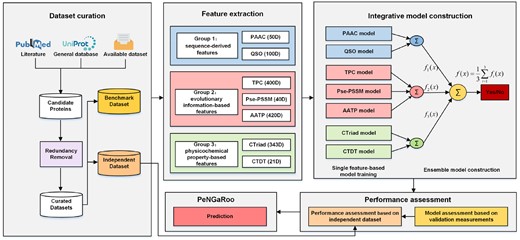
Overall framework of PeNGaRoo. The development of PeNGaRoo involved five major steps, including: (1) data collection and preprocessing, (2) feature extraction, (3) parameterization and ensemble model construction, (4) performance assessment and (5) web server development. Specially, (i = 1, 2, 3) denotes the prediction output of the one-layer ensemble model (i.e. group1, group2, group 3), while denotes the prediction output of the final two-layer ensemble model. The final output ‘Yes’ or ‘No’ indicates whether or not the inquiry protein is predicted as a non-classically secreted protein with the prediction threshold set to 0.5
2.1 Data collection and preprocessing
The construction of a high-quality benchmark dataset for training and validating the prediction model is a prerequisite of successful machine learning approaches. In this study, we used experimentally validated non-classically secreted proteins of Gram-positive bacteria, which were obtained from a recent work (Wang et al., 2016). Specifically, 253 non-classically secreted protein sequences were extracted from the literature, which have been identified by at least three different research groups in at least three different bacterial species (Wang et al., 2016) (Supplementary Table S1). For the negative training set, we chose the entire set of 1084 proteins (Firmicutes, annotated to be localized in the cytoplasm) in the work of Bendtsen et al. (2005). Subsequently, CD-HIT (Huang et al., 2010) was applied to the initial dataset to remove any redundancy at the cutoff threshold of 80% sequence identity to avoid any potential bias. We obtained 157 positive samples (Supplementary Table S1) and 446 negative samples. In view of the scarcity of the positive samples, we partitioned the dataset into training and independent test datasets by adopting the following procedure: nine-tenths of the above positive samples were used as the training dataset, while the remaining one-tenth were used as the independent dataset. As a result, the training dataset included 141 positive and 446 negative sequences.
In order to objectively evaluate the predictive performance of the proposed method, we further constructed an independent test dataset. For the positive samples, we included experimentally validated non-classical secreted proteins collected by previous studies and ours. For the negative samples, we collected proteins from UniProt Consortium (2015) by extracting those entries whose annotations contained the key words ‘cytoplasm’ or ‘cytoplasmic’ but did not have any annotations of ‘secreted’. After removing the overlapping sequences in the training dataset, we finally obtained 34 positive samples and 34 negative samples as the independent test dataset.
2.2 Feature extraction
Feature extraction plays a predominant role in developing reliable and accurate machine learning-based models (Wang et al., 2017a). This step has a direct impact on the efficiency and accuracy of biometric analysis and information extraction. In our effort to better characterize non-classically secreted proteins, we categorized the extracted features into three main groups, i.e. sequence-derived features, evolutionary information-based features and physicochemical property-based features.
2.2.1 Group 1: sequence-derived features
Previous works have indicated that the percentage, mode of combination and order of amino acids contain valuable information for predicting the protein properties (Wang et al., 2018). Accordingly, we extracted two types of sequence-derived features to encode such information, including pseudo-amino acid composition (PAAC) (Shen and Chou, 2008) and quasi-sequence-order descriptors (QSO) (Chou, 2000).
2.2.2 Group 2: evolutionary information-based features
An increasing number of studies have indicated that the evolutionary information in the form of PSSM can provide more information than the sequence alone in many biological classification problems (Liu et al., 2010; Muthukrishnan and Puri, 2018; Pu et al., 2007; Wang et al., 2018). In this study, we generated the PSSM profiles by performing PSI-BLAST search against the NCBI uniref50 database with the parameters j = 3 and h = 0.001. For a protein sequence with the length = L, the corresponding matrix of the PSSM profile has a size of L × 20. The (i, j)th element of the PSSM matrix denotes the score of the amino acid type j (j = 1, 2, …, 20) at the ith position of the protein sequence. We generated the PSSM-based features using the POSSUM software package (Wang et al., 2017b). In view of the effectiveness of different types of PSSM features, we chose and extracted the TPC, Pse-PSSM and AATP features to encode the evolutionary information.
2.2.3 Group 3: physicochemical property-based features
Incorporating additional information based on physicochemical properties has been shown to enhance the sequence representation and lead to improve the performance in previous studies (Dubchak et al., 1995). We thus included two types of physicochemical property-based features, i.e. Conjoint Triad (CTriad) and transition among CTD (CTDT).
2.3 Model training and optimization
2.3.1 LightGBM
LightGBM is a high performance, distributed gradient boosting decision tree machine learning implementation with two engineering optimization novelties: Gradient-based One-Side Sampling (GOSS) and Exclusive Feature Bundling (EFB), which has been recently developed by Microsoft Research (Ke et al., 2017). The GOSS algorithm uses instances with large gradients that contribute more to the information gain and randomly drops sample instances with small gradients. It leads to a more accurate gain estimation and massively reduces the number of data instances without losing much training accuracy. EFB employs a greedy algorithm to bundle many mutually exclusive features into a much denser form, which can effectively reduce the sparse feature space to avoid needless computation for zero feature values. Therefore, LightGBM has an outstanding computational efficiency and scalability when dealing with large datasets or high-dimensional features (Ke et al., 2017; Zhang et al., 2018). In this work, we trained the LightGBM models using the LightGBM package (https://github.com/Microsoft/LightGBM) implemented in the R language.
2.3.2 Parameter optimization
Different from conventional machine learning algorithms such as SVM (Cortes and Vapnik, 1995) that typically need to adjust only two or fewer parameters, LightGBM requires users to adjust a larger number of parameters to improve the predictive performance of the models and avoid potential over-fitting. In this work, we needed to tune up to 11 parameters (Supplementary Table S4), but it is difficult to use the grid-search parameter adjustment to accurately obtain the optimal solutions. Zhang et al. (2018) put forward the idea of parameter optimization and adopted the one-by-one parameter tuning strategy, which considerably reduced the computational time of parameter adjustment. Wang et al. (2019) adopted a Genetic Algorithm (GA)-based two-step parameter tuning strategy: they applied a GA algorithm to seek an approximate optimal solution in a region previously determined by the one-by-one parameter tuning strategy. While the solution has reported promising results, it will likely be only a locally optimal solution. Here, we proposed a novel parameter tuning strategy (Algorithm 1) based on PSO to seek a quasi-optimal solution in a global manner within acceptable computational time.
PSO-based parameter optimization
Input: ub: upper bound of 11 parameters
Input: lb: lower bound of 11 parameters
function modelEvaluation(11 parameters):
lightgbm.parameters ← 11 parameters
lgb_tr_mod ← lgb.cv(lightgbm.parameters, nfold = 10 …)
return (lgb_tr_mod.AUC)
PSO ← PSOInitialization()
fn: modelEvaluation()
maxStepLen: (ub − lb)*α
PSO ← psoptim(rep(NA, 11), fn, upper = ub, lower = lb, control = list(v.max = maxStepLen, …))
finally adjusted parameters ← PSO.par
Output: 11 finally adjusted and optimized parameters
PSO was originally proposed by Eberhart and Kennedy (1995) as a population-based search algorithm inspired by the social behavior of bird flocking or fish schooling. Compared with the GA algorithm, a significant advantage of PSO is that it can adjust the maximum step size at each iteration, making it possible to find an approximate optimal solution in a wide range of possible parameters (when time permits). Therefore, we applied PSO to directly find 11 approximately optimal parameter values from the high-dimensional search space (Algorithm 1). During this process, the 11 parameters with the corresponding upper bound (ub) and lower bound (lb) (Supplementary Table S4) were used as the input and assigned as upper and lower, respectively. The value of v.max was set to (ub − lb) * α (α = 0.2) for the purpose of balancing the calculation time and accuracy. Moreover, we constructed a function named modelEvaluation, whose return value was set as the fn value and determined as the area under the ROC curve (AUC) value of the LightGBM model based on 10-fold cross validation. The PSO package in R language was used for this purpose.
2.4 Data imbalance problem solving
The problem of imbalanced data classification may result in prediction bias that favors the prediction of the majority class, i.e. the class with most samples, potentially leading to an adverse impact on the overall predictive performance. To address this data imbalance problem, we generated N (N = 10 in our setting) balanced datasets, each of which was constructed by selecting all the positive samples and the equal number of negative samples randomly selected from the original unbalanced training dataset. We then built an ensemble model (termed as single feature-based LightGBM model) (Chen and Jeong, 2009; Wang et al., 2019) from N LightGBM classifiers by an equal-weight averaging their predictive scores. By this means, the problem of the imbalance dataset was converted into the multiple balanced data classification problem and solved thereafter.
2.5 Integrative model construction
Effectively leveraging multiple features that have been extracted from a set of data considerably influences the performance of a predictor. In this regard, the ensemble learning strategy has proved useful for improving the predictive performance and model generalization, as opposed to those that only use a combined set of features for a single model training (Wang et al., 2018; Wang et al., 2019; Zou et al., 2013). Therefore, instead of merging all the features into a higher-dimensional feature set prior to model training, we trained base models with each feature set, in order to learn different useful patterns from various feature sets, and also avoid the potential over-fitting problem, as each feature set has a lower dimension than the feature set that merges all features. Rather than using a direct integration of the base models (such as through majority voting and equal weight averaging), which might suffer from information redundancy within the same feature group, we adopted a two-layer ensemble model strategy, which has been successfully applied in previous studies (Wang et al., 2019).
Specifically, we employed LightGBM to train the model for each feature set first, and then constructed the one-layer ensemble models by an equal-weight averaging of the prediction outputs of different feature encodings within the same group (shown in Fig. 1 in different color blocks). Finally, the prediction scores of one-layer ensemble models were further integrated to generate an overall score of the final two-layer LightGBM-based ensemble model using same weights (group 1:group 2:group 3 = 1:1:1). In this way, we effectively utilized the information of each feature group without being affected by the number of features in each group.
2.6 Performance measurement
In order to assess the performance of the model prior to its application, we applied a validation test. Three commonly used validation methods, including k-fold cross-validation (CV) test, leave-one-out CV test and independent test, were employed to comprehensively and rigorously assess the prediction performance of the constructed models.
k-Fold CV is a statistical analysis method which has been widely utilized by researchers to evaluate the performance of a machine learning classifier (Kumar et al., 2015). Here, we performed a 5-fold CV test to evaluate the model performance. In such a test, the benchmark dataset is randomly split into five exclusive subsets of approximately equal size. At each validation step, a single subset is retained as the validation dataset for testing the model performance, whereas the remaining four subsets are used as the training dataset. This procedure is then repeated five times until each subset has been used. The model performances on the five test subsets are then averaged and the result is the overall performance of the models on a 5-fold CV test. In this study, we conducted randomized 5-fold CV tests for each of the N LightGBM classifiers, averaged their performance results and used the average performance as the final performance of the trained classifiers.
Leave-one-out CV test, also known as jackknife test (Chen et al., 2018; Sharma et al., 2015), can be regarded as an extreme case of k-fold CV, with k = n, where n denotes the total number of samples in the dataset. Similarly, each sample in the dataset is used as the test data, while the remaining n − 1 instances form the training set and are used to train the classifier. This procedure is repeated n times, until each of the samples has been used as the test data.
The independent test was conducted using the independent dataset separately from the training dataset to avoid any overlap between the training dataset and the independent test dataset (see Section 2.1 for the detailed construction procedure), thereby representing a more rigorous validation of the proposed models and providing a fair comparison with other existing toolkits.
2.7 Performance assessment
Moreover, the receiver-operating characteristic (ROC) curves are employed to provide an intuitive performance comparison. The AUC is also calculated and provided in the ROC plot, as a primary quantitative indicator of the overall performance of the model.
3 Experimental results
3.1 Performance evaluation on the 5-fold CV test
In this section, we conducted the 5-fold CV tests of our N (N = 10) LightGBM classifiers based on N balanced training datasets, and averaged the performances to generate the performance metrics for each single feature-based model as well as their ensemble models (i.e. one-layer ensemble models and final two-layer ensemble LightGBM model). In addition, the original LightGBM models were trained with the optimized parameters based on the PSO-based parameter tuning strategy, if not specified.
3.1.1 Effect of parameter optimization strategies
To investigate the effectiveness of the proposed PSO-based parameter optimization strategy, we compared the performance of the models trained using different feature encoding methods based on the PSO-based parameter optimization, the initial parameter setting, one-by-one parameter optimization and GA-based two-step parameter optimization. As can be seen from Figure 2 and Supplementary Table S5, the models trained based on the one-by-one and GA-based two-step parameter optimization strategies achieved a better performance than those based on the initial parameter setting except for the AATP and CTDT feature encoding methods. The results highlight the importance and value of developing an effective parameter optimization strategy for improving the predictive performance of LightGBM models, and also indicate the necessity to develop parameter adjustment algorithms. In addition, the PSO-based parameter optimization strategy achieved a robust and superior performance when compared with the one-by-one parameter tuning strategy and the GA-based two-step parameter tuning strategy. Overall, this proposed PSO-based parameter optimization strategy resulted in an improved model performance, while consuming longer but acceptable parameter tuning time.
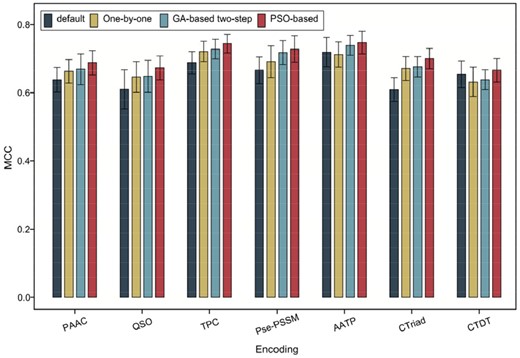
Performance comparison of LightGBM models trained using different feature encoding methods based on the PSO-based parameter optimization and those based on the initial parameter setting, one-by-one parameter optimization and GA-based two-step parameter optimization
3.1.2 Performance comparison between different feature encoding methods
For each feature encoding, we trained a single feature-based LightGBM model with the optimally tuned parameters and validated its performance by performing randomized 5-fold CV tests. As shown in Table 1, Supplementary Figure S1 and Figure 3, the models trained using PSSM-based feature descriptors (i.e. TPC, Pse-PSSM and AATP) achieved overall best performances compared to those trained using sequence-based and physicochemical property-based feature descriptors in term of five performance measures, SN (>0.913), ACC (>0.862), F-value (>0.868), MCC (>0.728) and AUC (>0.926). These results are consistent with previous studies that indicate PSSM-based features are critical and essential for prediction of protein attributes (Wang et al., 2017a; Wang et al., 2019; Zou et al., 2013). Among the different types of PSSM-based features, AATP appeared to be the most powerful feature encoding. The associated model achieved the highest values of SN (0.933), ACC (0.871), F-value (0.877) and MCC (0.747), respectively. This suggests that AATP captures the most informative patterns for identifying the non-classical secreted effector proteins from sequences. Following the PSSM-based features, the CTriad features outperformed the other remaining features in term of SN, ACC, F-value, MCC and AUC, possibly because CTriad describes well the informative composition of amino acid properties in protein sequence. The PAAC and QSO encodings achieved a comparatively lower performance, presumably because they only extracted limited patterns from protein sequences.
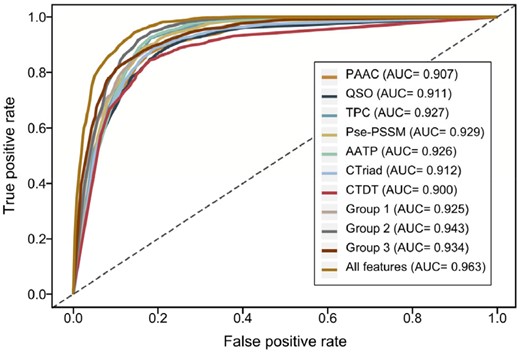
ROC curves of the models trained using different sequence encoding methods evaluated on the 5-fold CV tests. The AUC values were calculated and shown in the inset
Performance comparison of different LightGBM classifiers on the 5-fold cross-validation test
| Encoding | SN | SP | ACC | F-value | MCC | |
|---|---|---|---|---|---|---|
| Sequence-derived features | PAAC | 0.870 ± 0.016 | 0.819 ± 0.033 | 0.842 ± 0.020 | 0.844 ± 0.017 | 0.688 ± 0.036 |
| QSO | 0.862 ± 0.018 | 0.808 ± 0.030 | 0.836 ± 0.019 | 0.838 ± 0.017 | 0.673 ± 0.035 | |
| Group 1 | 0.879 ± 0.022 | 0.828 ± 0.022 | 0.852 ± 0.013 | 0.854 ± 0.012 | 0.707 ± 0.024 | |
| Evolutionary information-based features | TPC | 0.927 ± 0.017 | 0.813 ± 0.026 | 0.870 ± 0.015 | 0.875 ± 0.013 | 0.744 ± 0.027 |
| Pse-PSSM | 0.913 ± 0.030 | 0.811 ± 0.020 | 0.862 ± 0.020 | 0.868 ± 0.020 | 0.728 ± 0.039 | |
| AATP | 0.933 ± 0.021 | 0.808 ± 0.022 | 0.871 ± 0.017 | 0.877 ± 0.017 | 0.747 ± 0.033 | |
| Group 2 | 0.945 ± 0.016 | 0.814 ± 0.030 | 0.880 ± 0.021 | 0.885 ± 0.019 | 0.766 ± 0.040 | |
| Physicochemical property-based features | CTriad | 0.884 ± 0.022 | 0.815 ± 0.028 | 0.848 ± 0.016 | 0.852 ± 0.014 | 0.700 ± 0.030 |
| CTDT | 0.838 ± 0.021 | 0.827 ± 0.033 | 0.833 ± 0.017 | 0.831 ± 0.016 | 0.666 ± 0.034 | |
| Group 3 | 0.880 ± 0.025 | 0.840 ± 0.025 | 0.860 ± 0.015 | 0.861 ± 0.015 | 0.721 ± 0.029 | |
| All features | 0.940 ± 0.008 | 0.861 ± 0.029 | 0.900 ± 0.016 | 0.903 ± 0.014 | 0.803 ± 0.029 |
Note: Performance was expressed as mean ± standard deviation. The best performance value within each groups of feature-based models is highlighted in bold.
3.1.3 Effect of feature selection on various features
To validate whether the prediction performance could be further improved by training models based on the selected features, for each type of feature, we selected different sizes of feature sets using GainRatio (refer to the Supplementary Section SI1), including the top 50, 100, 150, 200, 250, 300, 350 and 400 features. We then compared the models trained with the selected features and original features. As a result, we found that the performance of the models trained using the original features was relatively better (Supplementary Table S6), indicating that LightGBM-based models could learn more informative patterns from the original features. Therefore, we used the original feature sets to construct the base models afterwards.
3.1.4 Performance of group-based ensemble models
To examine whether the ensemble learning strategy could significantly improve the model performance, we further assessed the performance of different classifiers, including single feature-based models, one-layer ensemble models and final two-layer ensemble model.
As can be seen from Table 1 and Supplementary Figures S2 and S3, all one-layer ensemble models achieved a better and more stable performance compared with the corresponding single feature-based models. In particular, all three ensemble methods consistently achieved the overall best performance in terms of the five metrics (i.e. SN, SP, ACC, F-value and MCC) with the only exception being sensitivity for physicochemical property-based features. Here, CTriad showed a slightly better performance than the ensemble method. The final two-layer ensemble model achieved a remarkably improved performance with an SP of 0.861, an ACC of 0.900, an F-value of 0.903, an MCC of 0.803 and an AUC of 0.963, respectively. The results indicate that although the PSSM-based ensemble model provided superior performance than the other two groups, the latter two groups contributed to the performance improvement of the final ensemble model by providing additional and complementary features.
3.2 Performance evaluation on the leave-one-out CV test
To further validate the robustness and scalability of the model, we also conducted a leave-one-out CV test to evaluate the model performance based on the same setting as the 5-fold CV tests. As expected, the obtained performance is highly consistent with the performance obtained from the 5-fold CV test (shown in Supplementary Table S7 and Fig. S4). This reinforces the need and value of leveraging different types of characteristic features from different aspects and integrating them into a unified computational framework to achieve a robust and improved performance.
3.3 Performance evaluation on the independent test
To further examine the performance and robustness of the classifiers, we performed the independent test on the independent test set and the corresponding results are discussed below.
3.3.1 Performance of group-based ensemble models
Using the independent test, we further assessed the predictive performance of single feature-based models and ensemble models. On one hand, as expected, the sequence-derived one-layer ensemble models achieved a better performance than the single feature-based models; on the other hand, both the physicochemical property-based and evolutionary information-based one-layer ensemble models achieved a lower performance than that of the best single feature-based model (Supplementary Table S8). We then compared the performance of the one-layer ensemble models and the final two-layer ensemble model that integrated all seven single feature-based models. The latter achieved the best performance in terms of SP, ACC, F-value and MCC. Again, these results are consistent with those obtained on the 5-fold CV test and leave-one-out CV test. Although one-layer ensemble models did not achieve an obvious performance improvement, the group-based models were not affected by the poor performance within the groups. These results demonstrate the usefulness and robustness of the model based on the ensemble learning strategy. To summarize, the results on the independent test highlight the importance and need to employ more comprehensive and discriminative feature encodings and integrate them into a consolidated framework to enhance the model design and performance.
3.3.2 Comparison with commonly used machine learning algorithms
Using the same model training and ensemble strategy, we repeated the model construction procedures to generate two-layer ensemble models based on four representative, commonly-used machine learning algorithms (i.e. K-nearest neighbor, SVM, random forest and multi-layer perceptron) (refer to the Supplementary Section SI2 for a detailed description). We evaluated the performance of the generated two-layer ensemble models on the independent dataset. The results in Supplementary Tables S9 and S10 show that the LightGBM-based two-layer ensemble model outperformed the equivalent models trained using the other four machine learning algorithms, suggesting that LightGBM is the most suitable choice for constructing the predictor for identifying non-classical secreted proteins in this study.
3.3.3 Comparison with existing methods
In this section, we benchmarked the performance of the proposed PeNGaRoo method (i.e. the final two-layer ensemble LightGBM model) against other state-of-the-art predictors. Although there exist three methods that have been developed for predicting non-classical secreted proteins in Gram-positive bacteria, only the SecretomeP web-server (Bendtsen et al., 2005) could be used to make a valid prediction. Therefore, we illustrate the key differences between PeNGaRoo and SecretomeP (Supplementary Table S11) and also compare their performance on the independent dataset. As can be seen from Figure 4 and Supplementary Table S12, PeNGaRoo clearly outperforms SecretomeP in terms of SN, ACC, F-value, MCC and AUC on the independent test. The reasons why PeNGaRoo achieves a better performance than SecretomeP includes: (i) all entries in the benchmark training dataset used by PeNGaRoo were experimentally validated, while SecretomeP only utilized limited numbers of experimentally validated non-classical secreted proteins available for constructing their models. As such, the accuracy of these methods was limited; (ii) PeNGaRoo explored different types of feature encodings in a more comprehensive and systematic way, while the feature extraction methods used by SecretomeP are relatively simple and (iii) the effective and robust LightGBM algorithm, coupled with our proposed parameter tuning strategy and the ensemble learning strategy contributed to the significant performance improvement of PeNGaRoo.
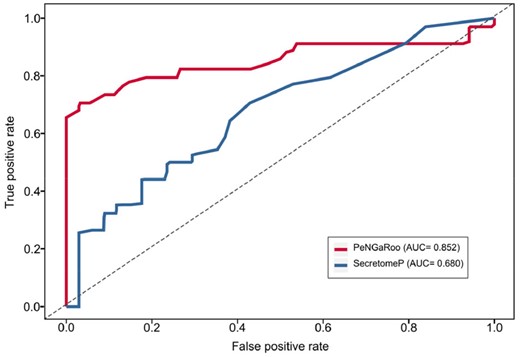
Performance comparison between PeNGaRoo and SecretomeP for predicting non-classical secreted proteins on the independent test
Furthermore, a previous study compiled a list of non-classically secreted proteins, and provided the detailed performance between SecretP and SecretomeP (Yu et al., 2010). Therefore, we compared the performance of PeNGaRoo with SecretP and SecretomeP by counting the correctly predicted numbers of positive samples in this list by each of the three methods. As can be seen from Supplementary Table S13, PeNGaRoo achieved the best performance and predicted 26 out of 32 positive samples. As a comparison, SecretomeP achieved the second-best performance and correctly predicted 10 positive samples. These results further validated the effectiveness and robustness of PeNGaRoo.
3.4 Web server implementation
To maximize user convenience, a user-friendly and publicly accessible web service has been established based on the final two-layer ensemble model for the wider research community to perform predictions of novel putative non-classical secreted proteins in Gram-positive bacteria. PeNGaRoo is hosted by the Monash University cloud computing facility, freely accessible at http://pengaroo.erc.monash.edu/. Upon submitting their protein sequences, users will easily retrieve their prediction results from the online result web page. To facilitate users’ follow-up analysis, the predicted proteins will be labeled as ‘Exp’ with a score of 1 if the query protein is a known, experimentally validated non-classical secreted protein; and otherwise, labeled as ‘Pred’ with a predicted score.
4 Discussion
Gram-positive bacteria secrete proteins across their membrane and cell wall either through mechanistically defined ‘classical’ pathways (the Sec translocon or Tat transporter), or by less well-defined ‘non-classical’ pathways. Identifying non-classical secreted proteins is important biomedically, e.g. for better understanding the host–pathogen interactions and pathogenesis mechanisms of Gram-positive bacteria, and biotechnologically, e.g. for optimizing features in heterologous proteins that will promote their secretion by Gram-positive host bacteria. In this study, we developed a new method termed PeNGaRoo for this purpose. First, we curated a reliable and high-quality benchmark dataset that contained experimentally verified entries. Based on this curated dataset, we systematically extracted and explored a wide range of features including sequence-derived features, evolutionary information-based features and physicochemical property-based features. Next, we employed the LightGBM algorithm in combination with a novel PSO multi-parameter optimization algorithm. We also integrated single feature-based LightGBM models into a unified ensemble framework to further improve the predictive performance of PeNGaRoo. Extensive benchmarking tests suggested that the two-layer ensemble predictor was significantly more effective in identifying non-classical secreted proteins compared to other existing methods. A publicly accessible web server based on the optimal ensemble models has been made available to maximize user convenience. PeNGaRoo is anticipated to be a useful tool for predicting non-classical secreted Gram-positive bacteria proteins and facilitating their functional elucidation.
In the future, PeNGaRoo will be continually maintained and updated in accordance with updates of newly discovered non-classical secreted proteins. Several studies indicate that the non-classical pathways are mechanistically diverse (Flieger et al., 2003; Nickel, 2003). As such, it would be of particular interest to examine if it is possible that certain common features possessed by a protein substrate might enable its secretion through one and/or more alternate secretion systems. Accordingly, the future updated version of PeNGaRoo will need to take into account the advances in the characterization of non-classical secretion systems in Gram-positive bacteria.
Funding
This work was financially supported by grants from the National Natural Science Foundation of China [61862017], the Natural Science Foundation of Guangxi [2018GXNSFAA138117, 2016GXNSFCA380005], the National Health and Medical Research Council of Australia (NHMRC) [1092262, 1144652 and 1127948], the Australian Research Council (ARC) [LP110200333 and DP120104460], the National Institute of Allergy and Infectious Diseases of the National Institutes of Health [R01 AI111965], the Collaborative Research Program of Institute for Chemical Research, Kyoto University (2019-32 and 2018-28). S.Y. was supported by the Outstanding Degree Thesis Cultivation Project of Guilin University of Electronic Technology [17YJPYSS14]. T.T.M.-L. and A.L.’s work was supported in part by the Informatics Institute of the School of Medicine at UAB. T.L. is an ARC Australian Laureate Fellow (FL130100038).
Conflict of Interest: none declared.
References
Author notes
Yanju Zhang, Sha Yu and Ruopeng Xie wish it to be known that these authors contributed equally.

