


Abstract
While next-generation sequencing (NGS) has dramatically increased the availability of genomic data, phased genome assembly and structural variant (SV) analyses are limited by NGS read lengths. Long-read sequencing from Pacific Biosciences and NGS barcoding from 10x Genomics hold the potential for far more comprehensive views of individual genomes. Here, we present MsPAC, a tool that combines both technologies to partition reads, assemble haplotypes (via existing software) and convert assemblies into high-quality, phased SV predictions. MsPAC represents a framework for haplotype-resolved SV calls that moves one step closer to fully resolved, diploid genomes.
Supplementary data are available at Bioinformatics online.
1 Introduction
High-throughput sequencing has dramatically increased the number of individual humans that have been sequenced. While these studies typically identify millions of single-nucleotide variants (SNVs) and small insertions or deletions (indels), next-generation sequencing (NGS) technologies still struggle to characterize many forms of structural variation (SV), including those in highly polymorphic regions, large-scale deletions, insertions, inversions and tandem repeat (TR) expansion/contraction (1000 Genomes Project Consortium et al., 2015; Chaisson et al., 2015; Pendleton et al., 2015; Ummat and Bashir, 2014).
Recently, third-generation sequencing technologies have emerged, producing far longer reads than NGS. For example, single molecule real-time sequencing from Pacific Biosciences (PacBio) provides read lengths exceeding 10 kb. In addition, barcoding and optical mapping technologies provide genomic data on even longer intervals (Cao et al., 2014; Zheng et al., 2016). In the case of 10x Genomics (10x) barcoding based ‘linked-reads’, this gain in distance information comes with a concession on the direct, ordered contiguity of the input data. The integration of such technologies holds the potential for fully haplotype-resolved SVs in any individual.
Here, we present MsPAC, a tool that leverages the increasingly robust bioinformatics toolkit available for working with long-reads to combine long-read sequencing and long-read SNV phasing information. Starting from a PacBio aligned read bam file and a 10x phased SNV vcf file (Fig. 1), MsPAC provides sequenced-resolved and phased SVs, assemblies for each haplotype, and multiple sequence alignments (MSA) between haplotypes with locations of SVs annotated.
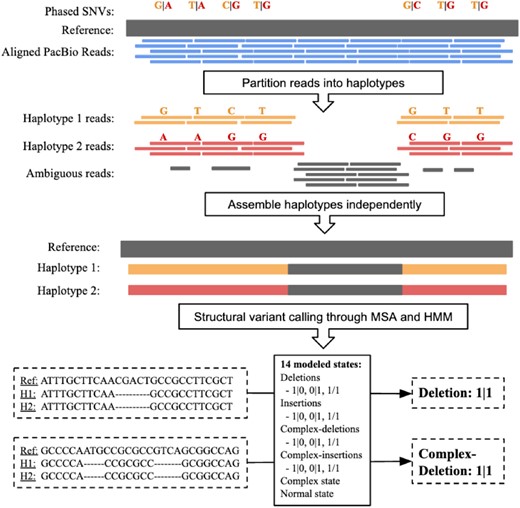
MsPAC workflow. Input reads are partitioned into haplotypes using phased SNVs. Next, partitioned reads are assembled independently. For each interval, the reference sequence and assembled contigs are multiple sequences aligned. Lastly, an HMM evaluates the MSA to return the final SV callset
2 Materials and Methods
2.1 Long-read partitioning
2.2 Haplotype assembly
We create a set of intervals, , by fragmenting the genome into the phased haplotype blocks defined by 10x. An interval has a set of reads, , that are contained in or overlap the interval. Given the haplotype labels embedded in the read group, the reads are partitioned by haplotype, optionally allowing ambiguous reads () to be included in the read sets for haplotypes 1 and 2. Each haplotype-partitioned read set, , is independently assembled, using canu (Koren et al., 2017). Relaxed parameters are used to force low-coverage error-correction and eliminate contig filtering (contigFilter=‘2 1000 1.0 1.0 2’ corMinCoverage = 0 -pacbio-raw). is mapped to all assembled contigs, in the interval using BLASR (Chaisson and Tesler, 2012) and is polished using Quiver (Chin et al., 2013).
2.3 SV identification
Assembled haplotype 1 and/or haplotype 2 sequences are used as input for SV identification. We ignore regions where sequences were not assembled for both haplotypes, and enforce that haplotype 1 and haplotype 2 sequence completely span the start and end coordinates of the interval in the reference genome. Let be the tuple corresponding to sequences for the reference, haplotype 1 and haplotype 2 for a given interval, . is used as input to the Kalign multiple sequence aligner (Lassmann and Sonnhammer, 2005), which returns an MSA matrix, , with three rows (reference, haplotype 1 and haplotype 2) and columns corresponding to the length of the alignment. We define 15 observation classes corresponding to columns in : 1 for matches (where all sequences agree with the reference), 1 for gap observations (allowing for ‘Ns’ in the reference), and the rest of the observations corresponding to various combinations of mismatch, insertion and deletion (Supplementary Table S1). This set of observations is passed into an HMM with 14 states, implemented using pomegranate (Schreiber, 2017). For each event type, separate states are included for homozygous, heterozygous haplotype 1 and heterozygous haplotype 2. Many tools are able to identify pure insertions and deletions with precise boundaries (the insertion and deletion states shown in Supplementary Table S2), but struggle with classifying events that contain multiple observation classes (i.e. those containing inserted, deleted and mismatched sequence). To address this, in addition to ‘normal’, ‘insertion’ and ‘deletion’ states, we label ‘complex’ forms of each. The key difference is that complex states have slightly higher emission probabilities for out of class observations. The parameters for all transition and emission classes can be changed (and complex classes eliminated) by the user. Transition and emission probabilities are defined in Supplementary Tables S2 and S3. All states are only allowed to transition to themselves or the normal state, with a heavy skew to staying in the same state ( probability of switching). Additionally, the emission probabilities are when emitting the normal, insertion, deletion observations and 0 when emitting the complex-deletion, complex-insertion observations consistent with the corresponding state. The remaining observations are given equal probability.
3 Results/conclusion
MsPAC was applied to HG002, an Ashkenazi Jewish (AJ) male from the Genome in A Bottle Consortium (GIAB) (Zook et al., 2016). The input dataset contained 75.5x PacBio coverage and 2.3 million SNVs phased by 10x with a haplotype N50 of 8.8 Mb. Supplementary Table S4 shows a summary of the read partitioning input and phased assembly output statistics. The contig N50 for the phased assembly was 4.3 Mb; notably, each haplotype exceeded 91% coverage of the genome (with 84% of the genome covered by both haplotypes). We utilized 350 bp and 6 kb insert Illumina libraries to evaluate the phased assembly by mapping each read independent of its pair (Supplementary Methods). After filtering (using mapping QV > 30) 99.6% and 98.5%, respectively, of the paired-reads mapped to the same haplotype. A total of 18 916 SVs were called in regions with both haplotypes assembled (Supplementary Table S5) with most of the run time spent in assembly (Supplementary Table S6).
We compared our set of fully haplotype-separated SV calls to the raw SV call sets produced by other tools, using both Illumina and PacBio-based SV callers and to the GIAB Tier 1 benchmarking SV call set. (The Tier 1 call set aggregated SV calls from a variety of sources including an early version of MsPAC pipeline and the tools listed in Supplementary Table S7.) We used a permissive approach to assess overlap—SVs were labeled ‘overlapping’ between two call sets if they were separated by <1 kb and of the same type (Supplementary Fig. S2). MsPAC performs better than short-read tools, and has similar performance to the best long-read tools. Only pbsv (https://github.com/PacificBiosciences/pbsv) and sniffles (Sedlazeck et al., 2018) show consistently higher overlap with other tools, although MsPAC produces the most unique calls of any tool (Supplementary Fig. S3). On the Tier 1 call set, MsPAC reaches a sensitivity of 95.0% and precision of 91.9% (Table 1 and Supplementary Fig. S2).
SV calling performance on HG002
| SV type | Count | TR count | ONT validated | Sensitivity (%) | Precision (%) |
|---|---|---|---|---|---|
| Deletion | 6410 | 2780 | 95% (2947/3113) | 95.0 | 91.9 |
| Insertion | 9252 | 5431 | 87% (3438/3930) | 92.0 | 93.8 |
| Complex deletion | 1487 | 327 | 72% (150/207) | NA | NA |
| Complex insertion | 1655 | 653 | 74% (147/198) | NA | NA |
| Complex | 112 | 54 | NA | NA | NA |
Note: ‘TR count’ shows the number of SVs for which >80% of the sequence was identified as TR by RepeatMasker and ‘ONT validated’ shows the percent supported by at least one Oxford Nanopore read. Sensitivity and precision values are reported against the GIAB Tier 1 benchmarking dataset.
To address potential systematic biases between callers and overcalling concerns, we employed an orthogonal long-read technology (Oxford Nanopore) for validation. For each predicted SV, we created two sequences with 1 kb flanking the event boundaries: (i) an ‘alt’ interval corresponding to the reference edited by the event and (ii) the unmodified reference. We then remapped all nanopore reads from that region of the reference to both sequences. If at least one nanopore read had a higher alignment score to the alt, the SV was labeled as correct. Notably, MsPAC was the method most penalized by this validation approach as it calls SVs in both haplotypes (even those with low coverage); however, its performance is comparable to other tools for identifying insertions (87.5% validated) and deletions (94.7% validated), as shown in Supplementary Table S8.
In summary, MsPAC yields fully phased and sequence-resolved SVs for the most challenging classes of events. Furthermore, employing an MSA allows visualization of complex SV architecture, which is particularly informative when establishing zygosity in hypervariable regions (e.g. TRs). MsPAC can be used on a variety of data types including PacBio CCS Reads and Oxford Nanopore. MsPac has been successfully applied to datasets with 20x coverage (Chaisson et al., 2019) and 28x CCS coverage (Wenger et al., 2019). It is recommended to have haplotype coverages of at least 15x, for raw PacBio reads and 10x for CCS reads. As long-read technologies mature, this ability to interrogate complex SVs in detail will be increasingly critical for classifying and assigning function to all variation in the genome.
Acknowledgements
We thank Matthew Pendleton and Alex Ledger for their work on an early version of the manuscript.
Funding
This work was supported in part by the NIH [R21AI117407 to A.B., NS105781 to A.S. and 1F31NS108797 to O.L.R.]. This work was supported in part through the computational resources and staff expertise provided by the Scientific Computing at the Icahn School of Medicine at Mount Sinai.
Conflict of Interest: none declared.
References

