


Abstract
The lollipop-diagram is one of the widely used graphical representations to visualize and explore translational effects of genetic mutations in cancer genomics. However, an easy-to-use lollipop-diagram tool with full functionality is still lacking. Here, we introduce g3viz, an R package that enables researchers to explore genetic mutation data using a lollipop-diagram in a web browser. With a few lines of R code, users can interactively visualize data details, annotate findings and export resultant diagrams in high-quality figures. Because of usefulness and usability, g3viz can be generally exploited by researchers with different levels of bioinformatics skills and programming experience.
The R package is freely available under the MIT license from CRAN (http://cran.r-project.org/web/packages/g3viz). The g3lollipop JavaScript package is freely available under MIT license at GitHub (https://github.com/g3viz/g3lollipop.js).
Supplementary data are available at Bioinformatics online.
1 Introduction
The lollipop-diagram, a concise and powerful graphical representation to illustrate relationships of multiple-dimensional data, has been commonly used in cancer genomics to study translational effects of genetic mutations. A sophisticated lollipop-diagram tool not only allows researchers to better understand genomic data in cohorts, but also provides a straightforward way to investigate and validate genetic findings. Some lollipop-diagram tools have been developed in recent years. The MutationMapper, developed by cBioPortal (Cerami et al., 2012; Gao et al., 2013), is a web application that allows researchers to visualize their own genetic mutation data online. The R/BioConductor packages of Maftools (Mayakonda et al., 2018) and Trackviewer (Ou et al., 2019), and the command-line executable tool Lollipops (Jay and Brouwer, 2016) and Shiny-based webtool Plot Protein (Turner 2013), are also available to generate static lollipop-style plots from genetic mutation data.
Here, we present g3viz, an R package to interactively visualize genetic mutation data using a lollipop-diagram in RStudio or a web browser. Compared to previous lollipop-diagram tools, g3viz has some unique advantages. First, g3viz supports a wide range of data files as input, and is also able to query cancer genomic data from cBioPortal server directly. Second, since g3viz is based on the g3lollipop JavaScript library, it is lightweight and requires neither additional software installation nor library dependencies. More importantly, g3viz offers a number of interactive and annotation features, allowing researchers to explore data details and label findings. The zoomed and annotated chart can further be exported in high-quality figures using the built-in functions.
2 Implementation
The graphical engine of g3viz is g3lollipop, a D3-based (Data-Driven Documents) (Bostock et al., 2011) JavaScript library which renders interactive graphics with SVG elements. Although g3lollipop can be used independently, due to the complexity of genomic data and technical barriers of HTML5 (HTML/CSS/JavaScript, D3), we further implemented g3viz, the R interface for this g3lollipop JavaScript library. As an R package, g3viz can not only leverage the data processing and analysis strengths of the R language, but also be seamlessly installed across multiple-platforms and work in all major internet browsers.
3 Results
The g3viz package is designed for both usefulness and usability. For data input, it accepts MAF (Mutation Annotation Format) and CSV/TSV files, and it also includes a function to query genetic mutation data, such as TCGA data (Tomczak et al., 2015), from the cBioPortal server directly (Fig. 1A). For chart interactivity, g3viz provides zoom & pan, tooltip and brush selection tools, as well as an interactive chart legend to show or hide specific mutation classes (Fig. 1B). In addition, researchers can highlight and annotate specific protein positions in the chart, and export the resulting chart in PNG file or vector-based SVG file. The g3viz lollipop-diagram is highly customizable with over 60 chart options and 37 built-in color palettes. For ease of use, g3viz offers eight ready-to-use chart themes, including one to mimic MutationMapper and another one with the ggplot2 (Wickham, 2016) flavor.
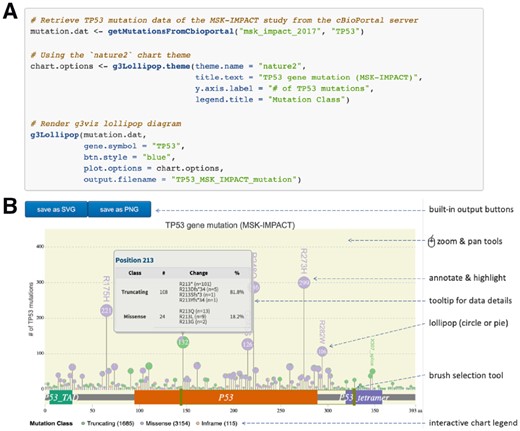
An R code example of g3viz. (A) The R code to query TP53 genetic mutation data of the MSK-IMPACT study (Zehir et al., 2017) from cBioPortal and visualize them using the nature2 chart theme. (B) The g3viz lollipop-diagram output and features
Moreover, g3viz consists of a number of data tools and resources. In detail, g3viz checks the input gene symbol and resolves gene isoforms. It retrieves protein domain information from Pfam (Bateman et al., 2004), parses amino-acid position from protein change information and classifies genetic mutations according to the variant classification information (Supplementary Table S1). With these built-in tools, researchers can generate a g3viz lollipop-diagram with a few lines of R code as shown in Figure 1.
4 Summary
G3viz is an R package for interactively visualizing genetic mutation data using a lollipop diagram in RStudio or a web browser. G3viz not only provides most functions of all existing lollipop-diagram tools, but also introduces unique interactive and annotation features, allowing researchers to explore data details and export the chart in high-quality figures. In addition, g3viz contains many user-friendly functions and built-in themes to simplify data import and chart settings. The package can be integrated into analytical pipelines to provide biological insights in a wide range of settings. In summary, we propose that g3viz is an easy-to-use genetic visualization tool that can be generally exploited by researchers with different levels of bioinformatics skills and programming experience.
Acknowledgements
The authors would like to thank Carly Feng and anonymous reviewers for helpful discussions and comments on this article.
Funding
This work was supported by Shenzhen fundamental research funding [JCYJ20180504165657443 to B.Z. and D.G.].
Conflict of Interest: none declared.
References

