


Abstract
Identification of differentially expressed genes is necessary for unraveling disease pathogenesis. This task is complicated by the fact that many diseases are heterogeneous at the molecular level and samples representing distinct disease subtypes may demonstrate different patterns of dysregulation. Biclustering methods are capable of identifying genes that follow a similar expression pattern only in a subset of samples and hence can consider disease heterogeneity. However, identifying biologically significant and reproducible sets of genes and samples remain challenging for the existing tools. Many recent studies have shown that the integration of gene expression and protein interaction data improves the robustness of prediction and classification and advances biomarker discovery.
Here, we present DESMOND, a new method for identification of Differentially ExpreSsed gene MOdules iN Diseases. DESMOND performs network-constrained biclustering on gene expression data and identifies gene modules—connected sets of genes up- or down-regulated in subsets of samples. We applied DESMOND on expression profiles of samples from two large breast cancer cohorts and have shown that the capability of DESMOND to incorporate protein interactions allows identifying the biologically meaningful gene and sample subsets and improves the reproducibility of the results.
Supplementary data are available at Bioinformatics online.
1 Introduction
Since the development of any disease is thought to be due to dysregulation of certain molecular processes, the detection of genes differentially expressed in disease is necessary for understanding its pathogenesis. Many existing methods (Love et al., 2014; Ritchie et al., 2015) are aimed at detecting genes, which are significantly differentially expressed in the disease group compared to the control group. However, the reproducibility of differentially expressed gene discoveries is rather low (Sweeney et al., 2017; Zhang et al., 2008) because of high levels of noise and large technical variation. One possible way to improve reproducibility and consistency between dysregulated genes detected in independent studies is to group individual genes demonstrating a similar pattern of dysregulation together. Aggregating expressions of multiple genes into single values reduces the dimensionality of the data and facilitates the subsequent analysis. The resulting groups of coordinately expressed genes, also called gene modules (Mitra et al., 2013; Saelens et al., 2018), are likely to be functionally related and easier to interpret than the whole list of differentially expressed genes. These gene modules may be known apriori or detected from the data when gene expression profiles are mapped on the interaction network. For example, active subnetwork detection methods search for sets of differentially expressed genes connected in the interaction network. These methods search for active subnetworks in a supervised manner, when class labels, e.g. disease and control or disease subtypes, are known (Batra et al., 2017; Chowdhury and Koyutürk, 2009; Dao et al., 2011; Ideker et al., 2002). However, class labels are not always available, and even if they are provided, some classes may be internally heterogeneous and consist of several latent molecular subtypes (McClellan and King, 2010; Perou et al., 2000).
Biclustering methods (Padilha and Campello, 2017; Pontes et al., 2015; Xie et al., 2018) perform an unsupervised search for subsets of genes demonstrating similar expression patterns in a subset of samples, given a matrix of genes profiled in these samples. Since biclustering is a much more complex problem than clustering due to the much larger size of the search space, many biclustering methods put additional constraints on the input data or the biclustering result, e.g. they assume a hidden checkerboard data structure (Hochreiter et al., 2010) or binary expression values (Serin and Vingron, 2011). Although most of the biclustering methods work on expression or other omics data matrices (Khakabimamaghani and Ester, 2015), some of them can additionally incorporate orthogonal biological data to improve biclustering results. For example, COALESCE can optionally accept sequences and perform de novo motif search jointly with biclustering (Huttenhower et al., 2009). It searches for biclusters composed of genes whose regulatory regions are enriched by the same motifs. Another biclustering method, cMonkey2, in addition to motif enrichment data, considers functional associations between genes in its scoring function (Reiss et al., 2015). As well as many other biclustering methods, cMonkey2 is more suitable for the detection of differentially co-expressed biclusters, rather than differentially expressed. The new version of QUBIC can utilize the data on known gene relationships when ranks gene pairs before constructing biclusters (Li et al., 2009).
Indeed, taking into account the known interactions between the genes may reduce the complexity of the problem. Instead of considering all possible gene subsets, in network-constrained biclustering, the solution is searched among interacting genes, which guides the method to more biologically reliable results. These considerations motivated us to develop DESMOND, a new method for identification of Differentially ExpreSsed gene MOdules iN Diseases. The advantage of DESMOND in comparison with most existing biclustering methods is its ability to incorporate prior knowledge about gene interactions, which promises to improve the quality of the results. Another advantage of DESMOND is that instead of setting a hard binarization threshold, it applies flexible thresholds for identification of samples in which genes are differentially expressed.
We conducted experiments on synthetic data and on real expressions from two large breast cancer cohorts, comprising tumor samples obtained from 1093 to 1904 unrelated individuals. Breast cancer was chosen as an example of a heterogeneous disease with multiple characterized molecular subtypes. Various classifications of breast tumors that take into account various tumor characteristics and result in different numbers of breast cancer subtypes include the classification based on ER, PR and Her2 expression (Gradishar et al., 2017), intrinsic subtypes classification (Perou et al., 2000), WHO histopathological classification (International Agency for Research on Cancer, 2012), etc. We compared DESMOND with nine state-of-the-art biclustering methods (Bergmann et al., 2003; Cheng and Church, 2000; Hochreiter et al., 2010; Huttenhower et al., 2009; Lazzeroni and Owen, 2000; Li et al., 2009; Murali and Kasif, 2003; Rodriguez-Baena et al., 2011; Serin and Vingron, 2011) (Supplementary Table S1) chosen based on their good performance on synthetic datasets with differentially expressed biclusters (Padilha and Campello, 2017). Among those, only QUBIC was able to take into account network data.
2 Materials and methods
2.1 Problem definition
The problem addressed in this article is the discovery of connected groups of genes differentially expressed in an unknown subgroup of samples, given a network of gene interactions and a matrix of gene expression profiles. This problem can be classified as network-constrained biclustering, or, alternatively, as unsupervised active subnetwork detection, when the desired sample subgroups are unknown.
Similarly, we call a set of genes differentially expressed in the samples of set if gene , g is differentially expressed in . As a measure of differential expression of a bicluster , we use the average of absolute SNR over all genes in samples. Higher average absolute SNR indicates that a subset of samples is well-separated from the background in a subspace of . Such gene sets are promising biomarker candidates for distinguishing unknown but biologically relevant subtypes of samples.
In the standard setting of differential expression analysis, all genes are tested in two given groups, e.g. disease versus control. In contrast, in our case, the groups of samples are undefined and our aim is to discover them. If genes are up-regulated in more than half of all samples, the remaining samples also form a down-regulated module and vice versa. Therefore, we are always searching for groups of samples of size not bigger than . Furthermore, the desired module should not be too small in terms of samples, because a smaller module has a higher probability to appear just by chance. We suggest users to select an appropriate smin value based on the size of the dataset and intended downstream analysis.
2.2 Algorithm
2.2.1 Step 1. Assigning sample sets to edges
In the first step, for each interaction edge i connecting genes u and v, DESMOND identifies a maximal set of samples in which both u and v are differentially expressed compared to . For that, we use a modification of the Rank–Rank Hypergeometric Overlap (RRHO) method (Plaisier et al., 2010) (Fig. 1), originally developed for comparison of differential expression profiles obtained in two experiments. It searches for a group of genes significantly enriched in the tops or bottoms of two ranked lists. Basically, this method finds an optimal pair of thresholds, for which the enrichment in tops (bottoms) of the ranked list is the most significant and returns a set of genes with expressions above (below) both thresholds. For two ranked lists of genes, the method creates a 2D-heatmap of the one-sided Fisher’s exact test P-values showing the significance of every pair of threshold values tu, tv, picking a combination corresponding to the most significant overlap.
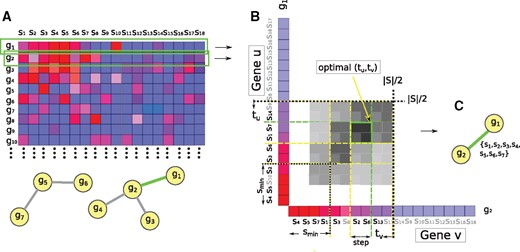
Modified RRHO method used to find the maximal set of samples, in which two interacting genes g1 and g2 are up-regulated. (A) Input network and expression matrix, red and blue respectively, indicate higher and lower expressions. (B) Two lists of samples arranged in decreasing order of the expression values of g1 and g2. Two thresholds t1 and t2 move from to smin with step size 2. The intensity of the cell color shows overlap significance for corresponding thresholds. For the case of down-regulation, the same procedure applies, but gene profiles are sorted in ascending order. (C) A set of samples Sshared assigned to the edge connecting g1 and g2
For our problem, we modified the RRHO method to find for a given connected pair of genes u and v a group of samples of size between smin and , such that both genes are concordantly dysregulated in that sample group. Different from the original method, we move the thresholds from the middle of the lists to the top and stop when achieving the first significant overlap and averaged value above SNRmin. This SNRmin threshold value could be explicitly defined by the user or estimated based on the data (see Section 2.2.3 for details). A maximal set of samples for which the expressions of both u and v exceed the thresholds and is assigned to the edge i. If no significant overlap bigger than smin found, the edge is excluded from further consideration.
2.2.2 Step 2. Probabilistic edge clustering
In the above model, the assignments of samples to the edges are modeled as a Bernoulli distribution with parameter θic and a Beta prior, for each sample and module . The number of modules is set to K, equal the number of non-empty edges of the network resulting from step 1. sj, , indicates the module to which edge j belongs and follows a categorical distribution with parameter π and a Dirichlet prior. The model initializes with each edge assigned to a separate module.
We use Gibbs sampling for parameter learning. Each iteration of Gibbs sampling goes over all edges and samples the edge indexes . The Gibbs sampling includes two phases: (i) burn-in, consisting of several consecutive iterations for initialization of sj, and (ii) sampling, which consists of several iterations throughout which the values of sj are recorded for further analysis for identification of modules.
No information is stored about sj during the burn-in phase. During the sampling phase, which consists of the last 20 iterations before convergence, the values of sj are recorded. We assume convergence when edge transition probabilities stabilize. Specifically, we compute edge transition probability matrices Pi from the previous 20 model states, starting from i + 1-th iteration. Sampling stops when reaches a plateau, more specifically, when the slope of a line fitting RMSE remains between –0.05 and 0.05 during the last five iterations. The final modules are computed as the most frequent value of sj for each j in the last 20 iterations.
2.2.3 Step 3. Post-processing of the resulting modules
Steps 1 and 2 are performed independently for the detection of up- and down-regulated modules and result in many module candidates containing from zero to many edges. Each module represents a subnetwork, defining a subspace of genes in which samples could be split into two groups differentially expressing these genes. To split all samples into the aforementioned two groups, DESMOND performs 2-means clustering of samples in a subspace of genes representing each module.
Since DESMOND aims to discover subnetworks of differentially expressed genes distinguishing unknown disease subtypes, we exclude all the modules with <2 edges and too low . Users can either explicitly define the SNRmin threshold or draw a certain quantile q from the distribution of values computed for 1000 ‘minimal’ biclusters—randomly chosen network edges. Finally, to find more complete gene modules, we merge interconnected modules, dysregulated in the same samples. This is necessary because
reference biological networks are incomplete (Luck et al., 2017),
local heterogeneity of the network connectivity may force the method to detect parts of a large bicluster as separate smaller biclusters.
Therefore, we recursively merge modules, starting from the pair with the most significant overlap in samples (Bonferroni-adjusted P-value < 0.05). The merge is only allowed if of the resulting bicluster exceeds SNRmin. The procedure is repeated until no merge is possible.
2.3 Datasets
2.3.1 Synthetic datasets
We used a similar strategy for synthetic expression data generation, as described in literature (Eren et al., 2013; Padilha and Campello, 2017). For each gene-sample pair, the expression was sampled from normal distribution if the gene and sample belonged to one or several biclusters, or from otherwise. Since, we had no prior knowledge of the prevailing bicluster sizes in real data, we generated 20 expression matrices and implanted 10 biclusters with the size of 5, 10, 20, 50 or 100 genes and 10, 20, 50 or 100 samples in every matrix. For each bicluster, gene and sample sets were chosen randomly from all genes and samples, i.e. bicluster overlap was allowed.
For each synthetic expression dataset, a scale-free network of 2000 nodes was created using scale_free_graph function from Networkx 1.10 python package, implementing the procedure proposed by Bollobás et al. (2003).
Next, we assigned gene labels to network nodes in a way so that genes from the same bicluster would be connected. First, we assigned to the network genes belonging to exclusive parts of biclusters. For that, we used the approach proposed by Ghiassian et al. (2015). They have shown that disease-associated genes form compact but not densely connected subgraphs on PPI. Therefore, starting from a random node, on every step a neighbor with the highest connectivity P-value (hypergeometric test) is added to the growing subgraph. Next, genes shared by multiple biclusters were assigned to the network, randomly selecting unlabeled nodes connecting the desired biclusters. Finally, background genes were assigned to unlabeled nodes.
2.3.2 Evaluation on synthetic data and the choice of parameters
Ranges of parameter values used in performance evaluation for each method are summarized in Supplementary Table S2. The expected number of biclusters was set to 10 when possible. All other parameters were set to default values. For every combination of parameter values, we applied each method on 20 simulated datasets and calculated Relevance and Recovery scores (Prelić et al., 2006). We considered optimal a combination of parameters corresponding to the highest geometric mean of Relevance and Recovery, averaged over all 20 synthetic datasets. For non-deterministic methods, we computed the average Performance scores in 10 runs.
2.3.3 Evaluation on breast cancer data
We evaluated DESMOND and baseline methods on data collected in two large breast cancer studies, TCGA-BRCA (Liu et al., 2018) and METABRIC (Pereira et al., 2016). In METABRIC cohort, all 1904 gene expression profiles were measured by microarray technology. TCGA-BRCA data comprised of two datasets: 1081 expression profiles were measured by RNA-Seq (TCGA-RNAseq) and 529 by microarrays (TCGA-micro). TCGA-micro and TCGA-RNAseq cohorts were not independent: 517 expression profiles were obtained from the same samples. Since microarray and RNA-seq platforms employ different technologies to estimate gene expression levels, their measurements in the same samples and genes may differ (Robinson et al., 2015). This may affect the results of biclustering; therefore, we did not unite these two subsets of expression profiles and applied DESMOND independently on TCGA-RNAseq and TCGA-micro.
Normalized gene expression profiles from TCGA and METABRIC cohorts were downloaded from cBioPortal (Cerami et al., 2012). From each cohort, we removed genes expressed in <5% of samples, log2-transformed and standardized expressions of remaining genes. Samples from both cohorts were annotated with patient age at diagnosis, stage of the tumor, and molecular subtype. All clinical information was downloaded from cBioPortal and converted into the same format.
We used a human gene network (Huang et al., 2018) derived from the BioGRID (Stark, 2006) network. This network consisted of 258 257 interactions between 16 702 genes. We have chosen BioGRID because it is one of the most comprehensive and frequently updated gene interaction networks for Homo sapiens. It comprises curated genetic and protein interactions, which are more reliable than computationally predicted interactions. While it provides good coverage of human genes, BioGRID is not too dense. Although most of the edges in this network represent protein interactions, BioGRID still suits our problem because genes with interacting protein products are functionally related.
For evaluation purposes, we kept only 11 959 genes presented in all three expression datasets and in the network. We also removed nodes corresponding to genes absent in expression profiles and their adjacent edges from the network before using it (179 514 edges remained).
To demonstrate the biological significance of the discovered biclusters, we tested them for associations with Gene Ontology (GO) (The Gene Ontology Consortium, 2016) gene sets, Kyoto Encyclopedia of Genes and Genomes (KEGG) pathways (Kanehisa, 2000) and known cancer subtypes using the one-sided exact Fisher’s test. All gene sets used in this work were downloaded from the EnrichR (Kuleshov et al., 2016). Overall survival (OS) analysis was performed using the Cox proportional hazards model implemented in Lifelines v0.23.0 (Davidson-Pilon et al., 2019) with age at diagnosis and stage as covariates. All other statistical tests were performed in python using Scipy 1.1.0. Benjamini and Hochberg’s procedure implemented in the gseapy 0.9.9 (Chen et al., 2013; Subramanian et al., 2005) python library was applied for multiple testing correction.
3 Results
3.1 Synthetic data and parameter tuning
Since previous studies have shown the importance of appropriate parameter setting for method performance (Eren et al., 2013; Sun et al., 2014), each method was run multiple times to find optimal parameter combinations resulting in maximal performance (Supplementary Table S2). Method performances varied widely among tools and different bicluster shapes (Supplementary Fig. S1). Interestingly, classic and query-based versions of QUBIC showed similar performances, despite the fact that the latter took into account network information. Although no method outperformed others in all cases, COALESCE demonstrated the best overall performance in this benchmark (on average, 0.63 with default and 0.72 with tuned parameters). DESMOND was the second top-performing method with the average performance of 0.64. It outperformed all other methods for biclusters of sizes 100×100, 50×100 and 5×100 with RRHO P-value threshold P = 0.01 and q = 0.5. We found that the method was not sensitive to changes of (Wilcoxon signed-rank test P-values 0.11 and 0.67 for comparison of performances obtained with set to 1.0 versus 104 and and other parameters fixed) and therefore set . DESMOND did not perform well on biclusters with a small number of samples. When considering only datasets with biclusters of 20 or more samples, DESMOND on average outperforms all methods including COALESCE (Supplementary Table S3). Therefore, given that DESMOND could not accurately detect the biclusters small in terms of samples, we set smin to 10% of the whole cohort size in all subsequent experiments. Almost all methods benefited from parameter optimization. DeBi, FABIA, COALESCE and QUBIC greatly improved their average performances (Fig. 2).
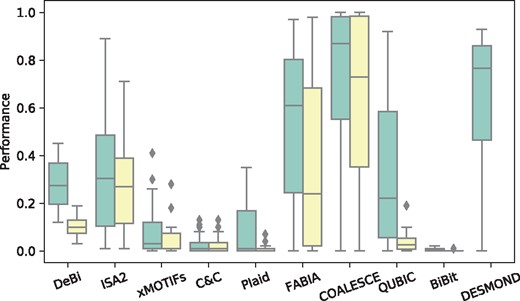
Average performance scores demonstrated by DESMOND and nine baseline methods on 20 synthetic datasets with the default and optimal parameters
3.2 Breast cancer data
Five baselines (COALESCE, DeBi, ISA2, Fabia and QUBIC) demonstrated their ability to detect differentially expressed biclusters in synthetic data were chosen and applied on three real-world datasets: TCGA-micro, TCGA-RNAseq and METABRIC. Each method was run twice: with default parameters and with parameters optimized on synthetic data. Since, we were interested in differentially expressed biclusters, we excluded from further analyses all biclusters with [this corresponds to SNR between and ] and <2 genes or 10 samples.
All methods produced different numbers of biclusters, demonstrating diverse distributions of shapes and values (Supplementary Fig. S2). FABIA run with default parameters identified no biclusters with average—SNR—above 0.5. DeBi did not finish after a week of running with default parameters on the METABRIC dataset and therefore was run on the subset of 500 randomly chosen samples. In contrast, QUBIC identified biclusters with weaker differential expression, when running with optimized parameters than with defaults. Only 8, 2 and 3 biclusters found with optimized parameters in TCGA-micro, TCGA-RNAseq and METABRIC, respectively, passed SNR threshold of 0.5. Therefore, below we report the results obtained with optimized parameters for all the methods except QUBIC. Given that the effect of parameter tuning was controversial, we show the results obtained with default and optimized parameters in Supplementary Figures S2, S3, S5 and S8–S12.
DESMOND identified 390, 763 and 442 biclusters of 3–157 genes and 53–952 samples in TCGA-micro, TCGA-RNAseq and METABRIC, respectively. Biclusters produced by DESMOND tended to be smaller in terms of genes and bigger in terms of samples than biclusters found by other methods. Compared to the other methods, QUBIC and DESMOND identified biclusters with more pronounced differential expression. As expected, DESMOND biclusters had much higher gene connectivity on average than biclusters produced by all other methods including QUBIC (Supplementary Fig. S3). We also investigated the redundancy of method outputs and found that QUBIC and ISA2 identify many biclusters strongly overlapping in genes and samples (Supplementary Fig. S4).
In contrast with the synthetic data benchmark, no ground truth was available for real-world breast cancer datasets. Therefore, to evaluate obtained biclusters, we tested the corresponding gene and sample sets for biological significance.
3.3 Associations with GO terms and KEGG pathways
To demonstrate that the identified biclusters are composed of functionally coherent genes, we tested obtained gene sets for overlap with known sets of functionally related genes from GO and KEGG. The proportion of biclusters significantly overlapping with KEGG pathways was always higher for DESMOND than for other methods, possibly owing to network constraints. Although most of the biclusters identified by DESMOND were significantly enriched with at least one GO term, it was second to ISA2 or QUBIC in some tests for GO term overrepresentation (Fig. 3 and Supplementary Fig. S5). To show that functional coherency of DESMOND biclusters is not only due to the network constraint, we have demonstrated that sets of disconnected genes from these biclusters are also significantly overlapping with gene sets from GO and KEGG (Supplementary Table S4).
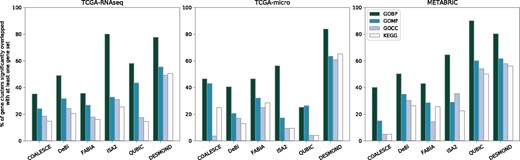
Percentage of gene clusters significantly (BH-adjusted P-value¡0.05) overlapping with at least one functionally related gene set from GO Biological Process, GO Molecular Function, GO Cellular Component and KEGG. All methods except QUBIC were run with optimized parameters
We further checked how similar are functionally coherent gene sets detected by different methods. For this purpose, we computed Jaccard similarities for all significantly overlapping pairs of gene sets enriched by GO terms or KEGG pathways. Surprisingly, the similarity of such gene sets found by different methods was not high (Supplementary Fig. S6). Only ISA and DeBi identified many strongly overlapping gene sets, but in all other cases, the examples of highly similar gene sets were rather isolated.
3.4 Permutation tests
Since multiple testing takes place while constructing the biclusters, there could be some false positives. To demonstrate that biclusters produced by DESMOND outperform null models, we have performed three permutation tests.
We have shown that DESMOND biclusters found in real data are bigger and demonstrate more pronounced differential expression than biclusters found in randomized data. We have also demonstrated that differential expression of DESMOND biclusters is stronger than differential expression of random subnetworks of the same size. The details on the null model construction and computation of permutation-based empirical P-values are provided in the Supplementary Text.
To prove that DESMOND has identified functionally coherent biclusters not only due to network constraints, we generated 200 sets of random subnetworks of the same sizes as DESMOND biclusters. One hundred of these random sets were composed of star-shaped subnetworks, where one hub node connects all the others, and the other hundred included chain-shaped subnetworks, created using depth-first search. We found that the fraction of enriched random subnetworks was slightly higher for star-shaped, rather than for chain-shaped. The percentage of enriched gene sets was always higher for DESMOND biclusters than for any random set of subnetworks (empirical P-value<0.01). DESMOND produced 21–38% and 26–51% more subnetworks enriched by GO terms and KEGG pathways, respectively than random sampling (Supplementary Table S5).
To demonstrate that information gain from the network is crucial for the results, we compared DESMOND results produced on original networks with the results obtained on randomized networks with 10%, 25%, 50%, 75%, 90% and 100% of shuffled node labels. Both, the percentage of GO- and KEGG-enriched biclusters found in TCGA-micro, and Relevance, Recovery and Performance scores on synthetic datasets decreased when the proportion of randomized node labels increased (Supplementary Fig. S7).
3.5 Associations with clinical variables
All methods were able to identify many biclusters, significantly (BH-adjusted hypergeometric P-value¡0.05) enriched by samples annotated with known breast cancer subtypes. Almost all biclusters found by DESMOND were associated with at least one molecular subtype of breast cancer. Only 0.5–3.3% of DESMOND biclusters showed no significant over- or under-representation of any molecular subtype. In contrast, COALESCE and DeBi produced larger fractions of biclusters not associated with any subtype, up to 68% and 91% of all reported biclusters.
However, although many biclusters were significantly associated with one or several subtypes, only a few of them demonstrated a strong overlap with the associated subtype in terms of the Jaccard similarity. Several methods including DESMOND managed to identify biclusters with strong overlap with Luminal A (LumA) and Basal subtypes (Jaccard similarities about 0.5–0.9, Supplementary Fig. S8). ISA2 applied with default parameters identified biclusters relatively strongly (Jaccard similarities about 0.5) overlapping with Her-2 subtype in TCGA. For all other subtypes, overlaps with the most significantly enriched biclusters were weaker.
All identified biclusters were further tested for association with OS using Cox proportional hazards model. DESMOND and DeBi produced more biclusters significantly associated with OS compared to other methods (Fig. 4 and Supplementary Fig. S9 and Table S6). Surprisingly, no methods except DeBi with optimized parameters identified OS-associated biclusters in TCGA-micro. However, similarity between OS-associated biclusters found by DeBi on TCGA-micro and TCGA-RNAseq was not high: pairs of biclusters with the strongest overlap in genes never shared more than two samples.
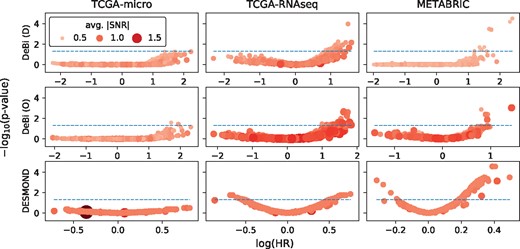
Association of biclusters found by DeBi and DESMOND with OS. Every circle represents a bicluster, with size and color intensity proportional to the avg.—SNR—. The X and Y axes show a negative logarithm of adjusted subtype enrichment test P-values and coefficients (logarithm of Hazard Ratio) in Cox regression models fitted for patient sets defined by biclusters. The best biomarkers have higher average SNR and larger positive or negative regression coefficients
Of all methods, only DESMOND, DeBi and QUBIC identified OS-associated biclusters in both TCGA-RNAseq and METABRIC. QUBIC found only several isolated OS-associated biclusters, overlapping in genes and associated with Basal subtype (Supplementary Text). DeBi and DESMOND identified many OS-associated biclusters in these two datasets. Although DeBi identified biclusters with higher HR than DESMOND, the latter produced more similar OS-associated biclusters in TCGA and METABRIC, as we show further.
3.6 Reproducibility of found biclusters
To evaluate reproducibility of OS-associated biclusters found by each method in TCGA and METABRIC, we compared best matches between two corresponding sets of biclusters. For each bicluster found in one dataset, its best match in another was determined based on the maximum Jaccard similarity of their gene sets. Since DeBi and QUBIC with optimized parameters produced much larger biclusters in terms of genes than DESMOND, we compared the ratios of observed Jaccard similarities to expected (Fig. 5).
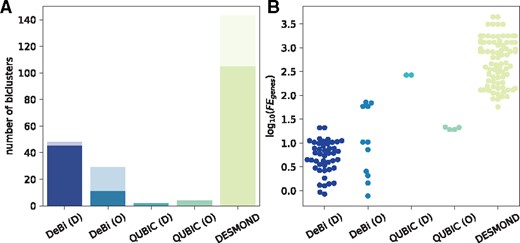
Similarity of OS-associated biclusters found by DeBi, QUBIC and DESMOND in TCGA-RNAseq and METABRIC. (A) Total number of OS-associated biclusters found in both datasets. The transparent part of each bar corresponds to biclusters without any match. (B) Logarithms of observed Jaccard similarities divided by expected Jaccard similarities
DeBi and DESMOND identified multiple OS-associated biclusters, but a fraction of their findings had no match between TCGA and METABRIC. All of several biclusters found by QUBIC had a best match strongly overlapping in genes. However, DESMOND biclusters, which had a matching partner, tended to demonstrate a higher gain of Jaccard similarity than biclusters produced by the other methods. It is important to note that OS-associated biclusters found by DeBi, QUBIC and DESMOND were not similar in genes and therefore represented different biomarker candidates. The examples of OS-associated biclusters produced by DeBi, QUBIC and DESMOND and composed of similar genes in TCGA and METABRIC are discussed in Supplementary Text.
Similarly, we compared all biclusters found by each method in TCGA-BRCA datasets profiled by RNA-seq and microarrays. In this case, both datasets included the same genes and shared 517 samples. Therefore, Jaccard similarity of best matches in genes and samples was calculated considering only shared samples. DESMOND, QUBIC with defaults and FABIA with optimized parameters shown on average a higher gain of Jaccard similarity between best matches than the other methods (Supplementary Fig. S10.).
3.7 Yeast data
To show that DESMOND is applicable to datasets other than human cancer, we run it and the baselines on two yeast datasets: DREAM5 (Marbach et al., 2012) and on the dataset from Hughes et al. (2000) (Supplementary Text and Figs S11 and S12). Although DESMOND did not outperform all the baselines, most of its biclusters significantly overlapped with GO categories, KEGG pathways or groups of genes co-regulated by the same TFs.
4 Discussion
In this article, we presented DESMOND, a new method for the identification of dysregulated gene modules—connected groups of genes up- or down-regulated in unknown subgroups of samples. We applied DESMOND to synthetic and real-world datasets and compared its performance with state-of-the-art biclustering methods.
In the benchmark on synthetic data, DESMOND was the second best performing method, exceeded only by COALESCE. The latter, however, did not outperform the others on real data, apparently, because our synthetic datasets do not reflect the whole complexity of real data. In particular, we did not explicitly model gene co-expressions and used a scale-free network, which may be unrealistic (Broido and Clauset, 2019). Another limitation is that we used normal distributions to model gene expressions, which is optimal for microarray but not for RNA-seq data, for which zero-inflated distributions fit better (Liu et al., 2019). Also, we did not investigate the effect of the bicluster-specific expression variance on method performances.
We demonstrated the capability of DESMOND to identify biologically meaningful subsets of genes and samples in real-world breast cancer and yeast datasets. Although we noticed that some biclusters found by DESMOND overlap in gene sets, we found that the redundancy of its results is not high when genes and samples are taken into account. In contrast, the closest competitors of DESMOND, QUBIC and ISA, produce biclusters strongly overlapping in genes and samples. In other words, these methods find a small number of strong patterns in the data and report them multiple times with small variations. This helps them to achieve good results in real data benchmarks, e.g. when the percentages of GO-enriched biclusters are compared. However, the high redundancy of the resulting biclusters is undesirable because it complicates further analysis.
We also note that we did not investigate the effect of different gene networks on the results and tested it only on the BioGRID network. The method may not perform well on a regulatory network, in which co-regulated genes are not connected directly. Also, the network should not be too dense, e.g. like composite functional networks. If dysregulated genes already form a connected subgraph, adding more edges to this subgraph would only increase runtime.
Nevertheless, despite these limitations, we have shown that owing to its ability to consider gene interactions, DESMOND produced many biologically meaningful clusterings on the breast cancer and yeast datasets. DESMOND, QUBIC and DeBi managed to identify different OS-associated biclusters in both breast cancer cohorts. Compared to its competitors, DESMOND tended to identify OS-associated biclusters more similar in genes in independent breast cancer datasets. The better reproducibility of DESMOND biclusters may be explained by the usage of network constraints. Higher stability of the results is desirable for the discovery of gene signatures reproducible in independent studies, regardless of the expression profiling method used. Finding of reproducible OS-associated biclusters may point to the presence of the internal heterogeneity beyond established molecular subtypes and requires further investigation.
Acknowledgements
We would like to thank Ralf Hofestädt and Maren Kleine (Bielefeld University), Felix Frenkel, Ravshan Ataullakhanov, Aleksander Bagaev, Nikita Kotlov and colleagues from BostonGene, Nikolay Zolotarev (MPI of Immunobiology and Epigenetics), Jan Baumbach and his group (Technical University of Munich) and four anonymous reviewers of ISMB’19 for their insightful comments and suggestions.
Funding
This study was supported by the International Deutsche Forschungsgemeinschaft Research Training Group GRK 1906; the Arbeitsgruppe Bioinformatik and Medical Informatik of Bielefeld University; and the Natural Sciences and Engineering Research Council of Canada Discovery Grant ‘Data mining in heterogeneous information networks with attributes’.
Data availability
Breast cancer data used this article are available via cBioPortal (http://www.cbioportal.org/): datasets brca_tcga_pan_can_atlas_2018, brca_tcga_provisional_1100, and brca_metabric. Yeast data were downloaded from https://github.com/esebesty/debi/blob/master/samples/yeast/hugues.txt and from Supplementary data of (Marbach et al., 2012). Code used to generate synthetic datasets is available at https://github.com/ozolotareva/DESMOND.
Conflict of Interest: none declared.
References
International Agency for Research on Cancer (
The Gene Ontology Consortium (

