


Abstract
In DNA storage systems, there are tradeoffs between writing and reading costs. Increasing the code rate of error-correcting codes may save writing cost, but it will need more sequence reads for data retrieval. There is potentially a way to improve sequencing and decoding processes in such a way that the reading cost induced by this tradeoff is reduced without increasing the writing cost. In past researches, clustering, alignment and decoding processes were considered as separate stages but we believe that using the information from all these processes together may improve decoding performance. Actual experiments of DNA synthesis and sequencing should be performed because simulations cannot be relied on to cover all error possibilities in practical circumstances.
For DNA storage systems using fountain code and Reed-Solomon (RS) code, we introduce several techniques to improve the decoding performance. We designed the decoding process focusing on the cooperation of key components: Hamming-distance based clustering, discarding of abnormal sequence reads, RS error correction as well as detection and quality score-based ordering of sequences. We synthesized 513.6 KB data into DNA oligo pools and sequenced this data successfully with Illumina MiSeq instrument. Compared to Erlich’s research, the proposed decoding method additionally incorporates sequence reads with minor errors which had been discarded before, and thus was able to make use of 10.6–11.9% more sequence reads from the same sequencing environment, this resulted in 6.5–8.9% reduction in the reading cost. Channel characteristics including sequence coverage and read-length distributions are provided as well.
The raw data files and the source codes of our experiments are available at: https://github.com/jhjeong0702/dna-storage.
1 Introduction
As the big data era has arrived, we are seeing massive data increase, which requires the next-generation storage system. Existing storage systems, such as solid-state drives, hard disk drives and magnetic tapes, have several limitations including the need for more data centers or a short lifespan. Therefore, the deoxyribonucleic acid (DNA) storage system is being studied for future data center archives (Church et al., 2012; Goldman et al., 2013). Currently, the cost of magnetic tapes is about 16 dollars per terabyte (Dong et al., 2020). On the other hand, the writing cost of DNA storage is about 530 million dollars per terabyte (Antkowiak et al., 2020), and the reading cost is about 0.01–1 million dollars per terabyte (Dong et al., 2020). However, while the current data center archives require millions of dollars for the maintenance expenses, DNA storage only requires thousand times less expenses, and the writing and the reading costs are rapidly decreasing (Dong et al., 2020).
The DNA storage system is a medium that stores data into DNA molecules which correspond to sequences of four bases: adenine (A), cytosine (C), guanine (G) and thymine (T). While a computer stores data into a sequence of bits, a DNA storage system stores data in the four bases, i.e. A, C, G and T (Bornholt et al., 2016). It is natural to map binary data to DNA sequences by matching two bits into one base (ex: A = 00, C = 01, G = 10, T = 11), followed by actual synthesizing the DNA strands. We call short DNA strands by DNA oligonucleotides (simply oligos). After the synthesis, polymerase chain reaction (PCR) is performed to amplify the synthesized oligos, and then sequence reads are produced from the DNA oligo pool using sequencing equipment. During these steps, base errors inevitably occur from biological and chemical causes, typically classified into three types: substitution, deletion and insertion errors. Various error-correcting techniques have been applied to resolve base errors in the DNA storage system. For example, Erlich and Zielinski (2017) used fountain code and Reed-Solomon (RS) code as error-correcting codes, while Chandak et al. (2019) used low-density parity-check (LDPC) code and Bose–Chaudhuri–Hocquenghem (BCH) code. Organick et al. (2018) succeeded in synthesizing a large amount of data into a DNA storage system using RS code. Takahashi et al. (2019) used the Hamming code and were able to make the whole process into an automatic system, and Heckel et al. (2019) analyzed different DNA storage channel characteristics together and devised error-correcting code schemes in the DNA storage system. Recently, Press et al. (2020) used hash functions and convolutional structures to correct insertion and deletion errors as well as substitution errors by a greedy search algorithm.
For a given DNA storage system, there are tradeoffs between the writing cost and the reading cost (Heckel et al., 2019). Choi et al. (2019) used degenerate bases and Anavy et al. (2019) used composite DNA letters to reduce the writing cost. In terms of error correcting codes, increasing the code rate of error-correcting codes by reducing the redundancy can save the writing cost, but it will require more sequence reads to decode successfully. However, if we focus on improving only the processes at the reading side for the given information at the writing side, we can improve the reading cost without increasing the writing cost. It is noted that the reading cost reduction implies not only the decrease of the reading cost literally but also condensing more information possibly into the same oligo pool when the maximum number of sequence reads is limited. Clustering, alignment and decoding processes in the DNA storage system were considered as separate stages in past researches (Chandak et al., 2019; Erlich and Zielinski, 2017), but we propose that we can use the clustering and alignment information together in the decoding procedure, to improve the performance of the error-correcting code. That is, we can raise the code rate of the DNA storage, effecting the writing cost reduction as well.
In this article, we design a whole workflow from sequence clustering to decoding for error correction in DNA storage systems using fountain codes and RS codes. The algorithms and parameters of DNA storage systems are jointly optimized to improve error-correcting performance. We design the decoding process focusing on the cooperation of key components: Hamming-distance based sequence clustering, discarding of abnormal sequence reads, RS error correction as well as detection and quality score-based ordering of sequences. More precisely, the proposed decoding scheme incorporates the sequence reads with minor errors, which may have been discarded in the previous studies.
We conducted experiments that support the proposed decoding scheme. We synthesized 513.6 KB of the image file in Figure 1 into DNA oligo pools using the encoding scheme from Erlich and Zielinski (2017), which adopted RS code within each oligo sequence and fountain code across the oligo sequences. We encoded the same data to two different oligo pools, one with the constraints (GC-content of 45–55% and homopolymer-run length up to 3) and the other pool without the constraints, and sequenced successfully for both pools with Illumina MiSeq system. We show that the proposed scheme makes use of 10.6–11.9% more sequence reads from the same sequencing environment, resulting in 6.5–8.9% of reading cost gain for successful decoding compared to Erlich’s decoding scheme in both experiments. Note that we also provide channel characteristics from our experiments, including sequence coverage and the read-length distributions. The experiment results are available online at: https://github.com/jhjeong0702/dna-storage.
The article is organized as follows. In Section 2, we propose a new decoding method of error-correcting codes for DNA storage systems and discuss our experiments including the encoding, synthesis, sequencing and decoding processes. We compare the processes of the proposed decoding method and Erlich’s decoding method. In Section 3, we show experiment results as well as the channel characteristics with figures and tables.
2 Materials and methods
To show an improvement in performance of the proposed DNA storage decoding scheme, we designed and performed two different decoding experiments to compare for the same oligo pool. We chose the encoding method of Erlich and Zielinski (2017), which adopts fountain code, especially Luby transform (LT) code (Luby, 2002), and RS code, only changing some parameters to adjust to the experiment to our circumstances.
2.1 Encoding and synthesis
As we mentioned above, we used LT code (Luby, 2002) as the inter-oligo code and RS code as the intra-oligo code as in Figure 2. Each oligo has length 152 nucleotides (nt) in total (16 nt seed + 128 nt payload + 8 nt RS code), which is to match that of Erlich and Zielinski (2017). A (38, 36) RS code was used in the finite field GF(28), where each parity symbol of RS code is 4 nt and the minimum Hamming distance (dmin) value is set to 3, which allows the RS code to be used for either two-symbol error detection or one-symbol error correction. We synthesized a 513.6 KB image file of a simplified map of Seoul National University into 16 050 oligo sequences and created 18 000 oligo sequences in total using an LT code with redundancy of 1.12. Then, the seed was added, and RS encoding was done for each oligo sequence. The sequence primers were also added at both ends, ‘GTTCAGAGTTCTACAGTCCGACGATC’ on the 5’ side and ‘TGGAATTCTCGGGTGCCAAGG’ on the 3’ side.

Image file of the campus map of Seoul National University was used for the synthesis of our experiments
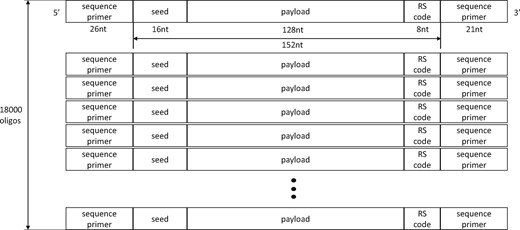
Simple abstraction of the proposed DNA oligo structure of length 152 nt with 18 000 different sequences
To check the effect of the homopolymer-run and GC-content (Ross et al., 2013), we synthesized two different pools using exactly the same data and encoding method, that is, one with constraints and the other without constraints. Here, while processing the LT encoding, the constrained pool already checked the homopolymer-run length and GC-content for each of the encoded oligo sequences. After the LT encoding, when an oligo had homopolymer-run length over three or a GC-content not in the bound of 45–55%, we discarded that oligo and proceeded with the LT encoding again until we had 18 000 suitable encoded oligo sequences. The non-constrained pool did not use this step, and thus we completed the LT encoding in one go and discovered that the non-constrained pool had maximum homopolymer-run length of 13 and GC-content of 32.89–68.42%. The oligo pools were synthesized by Twist Bioscience, about 300 ng of each DNA oligo pool were made.
2.2 Sequencing
The sequencing procedure followed the way previously described (Erlich and Zielinski, 2017). The PCR amplification (50 μl) containing 25 ng of oligo pool, 2.5 μl of each 10 μM primer and 25 μl Q5 Hot Start High-Fidelity 2X Master Mix (New England Biolabs) was performed using primers named RP1 (5′-AATGATACGGCGACCACCGAGATCTACACGTTCAGAGT TCTACAGTCCGA-3′) and RPI1 (5′-CAAGCAGAAGACGGCATACGAG ATCGTGATGTGACTGGAGTTCCTTGGCACCCGAGAATTCCA-3′), with the following thermocycling: 30 s at 98°C, followed by 10 cycles of 10 s at 98°C, 30 s at 60°C, 30 s at 72°C and a final extension step of 5 min at 72°C. The amplified library was cleaned up with AMPure XP (Beckman Coulter) kit and eluted in 20 μl nuclease free water (Invitrogen).
We used the Illumina Miseq Reagent v3 kit (600 cycle) with 151 nt run in both forward and reverse directions according to the manufacturer’s recommendation. For the constrained pool, Q30 was 97% and output had 14 million forward-reads and 14 million reverse-reads (total 28 million), excluding 20% PhiX spike-in. For the non-constrained pool, Q30 was 94% and output had 20 million forward-reads and 20 million reverse-reads (total 40 million), excluding 30% PhiX spike-in.
2.3 Clustering and decoding
To compare the performance of Erlich’s decoding scheme and the proposed decoding scheme, we randomly sampled the same amount of reads from each of their original forward and reverse read FASTQ files. Then we merged these reads with the PEAR algorithm (Zhang et al., 2014) version 0.9.2 and used the merged FASTQ files to proceed to the next step. For each random sampling, 200 different trials were carried out and we counted how many of the 200 trials ended with decoding success.
2.3.1 Erlich’s decoding method
After merging the forward and reverse reads, we take only the sequence reads of the same length (152 nt). Then, we put exactly the same sequence reads for all 152 nt into a cluster. We sort the clusters from the largest size to the smallest size and then we check if errors in each sequence read are detected by the RS code. If the RS check is not correct, we discard the sequence read, and go on to the next cluster group. In this scheme, alignment is not required because there is only one kind of sequence read in a cluster. We put all sequence reads passed by the RS check into the LT decoding procedure one by one in the sorted order. In this decoding method, LT erasure decoding is used. Because we determined the order of the input sequence reads, preceding sequence reads have more priority in the LT decoding. The following sequence reads are used for only deciding the remaining information. The LT decoding stops with decoding success declaration as soon as all data are recovered or stops with decoding failure declaration if any data are not recovered though all reads passed by the RS check have been input to the LT decoder. It is noted that this LT decoder trusts the input reads to be always correct because they pass the RS check and treat the empty oligo sequence positions as erasures.
2.3.2 Proposed decoding method
The procedures for the random sampling and merging steps are the same as Erlich’s method. One thing we added right away is that we can use the RS code for error correction, which contrasts with the Erlich’s method that only uses it for error detection. As dmin of the RS code is three, only one symbol error correction is possible, and if there are two or more errors in a sequence read, there is a possibility that it could be corrected to an incorrect codeword. To avoid this situation, we add four techniques C1, C2, C3 and C4 as in Figure 3 to the proposed decoding process as follows.
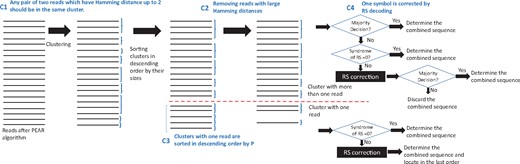
Steps of the proposed decoding process. All sequence reads that have up to Hamming distance 2 belong to the same cluster. Then, we sort them by the descending order of the cluster size. For the groups of clusters with size 1, we proceed the discarding step by comparing Hamming distances to the combined sequences of the preceding clusters, and surviving groups of clusters with size 1 are sorted by the product of quality score values in descending order. Before the LT decoding, RS check for error detection is performed. The sequences which pass the RS check are decoded first by LT decoder, and the sequences with RS error are sent to a heap and used for the LT decoding after the RS correction at the very last. For the LT decoding, the combined sequences of clusters size at least 2 are decoded first
C1: First, we use the clustering algorithm based on Hamming distance whose distance value is carefully chosen considering the capability of RS code for error detection and correction. In the sequence reads, most of them are correct and only a few have errors, but we found that the errors have critical influence on decoding failure. When there are several correct sequence reads and a few sequence reads with small errors, they are almost surely originated from the same oligo sequence and thus clustering them together helps to find the correct sequence read. Therefore, we calculate the Hamming distances between a particular sequence read and all the other cluster groups we made, and then the particular sequence read belongs to the cluster which has the Hamming distance ≤2. Otherwise, the new sequence read makes a new cluster. After all the sequence reads are clustered, we combine the sequence reads in each cluster into one single sequence where each position has the base with majority. For example, if there is a cluster group of {AGTGCCGT, AGTGCCAT, AGTCCCAT, ACTTCCAT}, we combine them into AGTGCCAT. If there is a position that we cannot decide a unique base with the majority rule, we leave the position undecided, save all the bases which appeared in that position, and let them be decided by the RS code later. For example, if there is a cluster group of {TCTTAGCC, TCTTAACC}, we do not combine them because the base at position 6 cannot be decided. Meanwhile, we decided to use Hamming distance 2 because of the RS code that can correct up to one symbol error and detect up to two symbol errors. Suppose there is a cluster group of size 2 and let X and Y be the two sequence reads in the same cluster. Then, there are three possible cases when the RS check is done for both X and Y:
X: RS passed, Y: RS passed (X and Y being identical).
X: RS passed, Y: RS failed.
X: RS failed, Y: RS failed.
In the first case, X and Y are identical. We can use one of X and Y for the decoding process later. In the second case, we should use the sequence read X which passes the RS check because Y may be corrected to a wrong codeword if Y contains two symbol errors. In the third case, if X and Y are corrected to the same codeword, we can use the corrected sequence read, where we can guess that both contain one symbol error each. Otherwise, we throw them away.
C2: Next, we added a discarding step for filtering out abnormal sequence reads based on the Hamming distance. To prevent an errored sequence read from being inferred to a wrong oligo sequence, keeping large Hamming distance between sequence reads are considered during the encoding step. However, if a pair of sequence reads has smaller Hamming distance than we intended, it means at least one of them contains several errors, and thus we try to find out that errored sequence read and exclude it during the decoding process. For example, when we encoded data for the non-constrained pool using the LT code, each encoded oligo sequence had Hamming distances of at least 81 to every other sequence. This means that when we are at the clustering step, if a sequence read has Hamming distance of 50 to a specific cluster, this sequence read has a lot of errors and would be corrected to a wrong codeword by the RS code, having a critical effect on the whole decoding process. Therefore, while we are in the clustering step, if we find a minimum distance from a specific sequence read to all the other cluster groups between 3 and 79, we discard that sequence read and do not use it in the rest of the decoding process (sequence reads with the Hamming distance of 80 could be corrected to an encoded oligo sequence with Hamming distance 81, and thus we do not discard them). Likewise, we use the same discarding strategy for the constrained pool, too. This strategy can be applied to other DNA storage systems with different values using their own encoding parameters.
After these steps, we put the clusters into our final decoding step, RS decoding and LT decoding, using a descending order of cluster size. For the LT decoding, we also use LT erasure decoding strategy of Erlich and Zielinski (2017). As long as the number of sequence reads is not very large, the portion of clusters including only one sequence read is not negligible and they will have critical effect on the decoding performance if they have errors.
Q-score means the probability of how much we can trust the base-calling system for each base during the sequencing (with Illumina equipment). Assuming all basecalls are independent (Urgese et al., 2020), multiplying all the 152 probabilities derived from the Q-scores can represent the reliability of the specific sequence read, and thus sorting of the clusters with size 1 by this P value can be useful for LT decoding.
C4: Before using these clusters (or combined sequences) for LT decoding, we first check the RS code. If a cluster passes the RS check, we put it into LT decoding in a descending order of cluster size. If a combined sequence does not pass the RS check, it means that we need to use it after the RS correction, and thus we send it into a heap for later use. When all the LT decoding calculations of RS-passed clusters are complete and we are still lack of indices for LT decoding, then we use the clusters from the heap with RS corrected symbols.
3 Results
As we mentioned before, we synthesized two oligo pools, a constrained pool and a non-constrained pool. In the decoding process, we implemented two different algorithms, one is Erlich and Zielinski (2017) method in Section 2.3.1, and the other is our proposed method in Section 2.3.2.
3.1 Experiment results
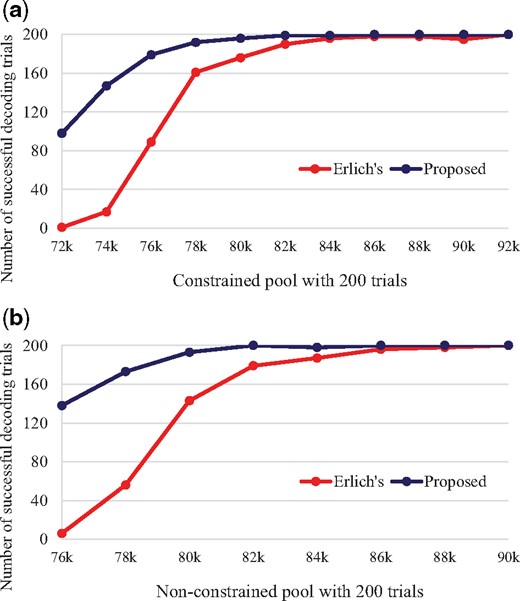
To compare the decoding success rate for Erlich’s and the proposed decoding methods, we randomly sampled sequence reads from each pool, and input them to the two decoding methods. We decoded 200 different instances of random sampling for each decoding method and checked how many times decoding success is declared out of the 200 trials in Table 1 and Figure 4.
Comparison of decoding success trials for random sampling numbers
Erasure decoding performance comparison by the number of successful decoding trials
| Total 200 | Constrained pool | Non-constrained pool | ||
|---|---|---|---|---|
| Random sampling number | Erlich’s method | Proposed method | Erlich’s method | Proposed method |
| 72 000 | 1 | 98 | ||
| 74 000 | 17 | 147 | ||
| 76 000 | 89 | 179 | 6 | 138 |
| 78 000 | 161 | 192 | 56 | 173 |
| 80 000 | 176 | 196 | 143 | 193 |
| 82 000 | 190 | 199 | 179 | 200 |
| 84 000 | 196 | 199 | 187 | |
| 86 000 | 198 | 200 | 196 | |
| 88 000 | 198 | 198 | ||
| 90 000 | 195 | 200 | ||
| 92 000 | 200 | |||
Note. The proposed method reaches the perfect recovery faster and shows higher recovery rates before reaching it than Erlich’s method.
As seen, the proposed decoding method has better performances for every random sampling number. Seeing the smallest random sampling number marked with (*) which achieves 200 decoding successes out of 200 trials, it is clear that the proposed decoding method has 6.5–8.9% reading cost advantage. Also, the decoding performance of the proposed method looks much better when the random sampling number is small, but seeing in terms of decoding failure rates, the gain (the ratio of the proposed method’s to Erlich’s) comes similar for all points of the random sampling numbers of reads. Performance gain at small random sampling numbers will give more chance to successful recovery if there are not enough sequencing data, influencing on the reduction of the reading cost. Moreover, the proposed decoding method works well when there is a scarcity of LT indices and clusters. In Erlich’s method, only 4 trials out of total 1014 decoding failures (0.39%) in Table 1 were able to collect all LT indices, but our proposed method jumps to 215 trials out of total 286 decoding failures (75.17%). This means that under the same experiment circumstance, using Erlich’s method caused lack of LT indices, but our proposed method can use the clusters that might have been discarded in Erlich’s method and restore the uncollected LT indices safely.
Specifically, we arranged the clustering and decoding statistics at the smallest random sampling number of all 200 decoding successes, which are 86 000 for the constrained pool and 82 000 for the non-constrained pool as shown in Table 2. The proposed decoding method combined more sequence reads in clustering stage, decreasing the ratio of the clusters of size one for all cluster groups from 38.3–40.5% to 11.6–14.0% and decreasing the ratio of the clusters of size one for all sequence reads from 12.8–14.5% to 2.8–3.5%. Moreover, we discarded 0.30–0.58% of sequence reads that contained many errors and used 1.08–1.28% more clusters for LT decoding through RS correction. Compared to the decoding experiment which applied all the ideas other than C3, the non-constrained pool of 82 000 oligos had 8 more decoding success by the aid of only C3 but the result for the constrained pool of 86 000 oligos stayed unchanged. In total, the proposed decoding method was able to make use of 10.6–11.9% more sequence reads from the same sequencing environment than Erlich’s method.
Clustering and decoding statistics at the smallest random sampling number of all 200 decoding successes (86 000 for the constrained pool and 82 000 for the non-constrained pool)
| 86 000 constrained | 82 000 non-constrained | ||
|---|---|---|---|
| Number of merged reads | 73 764.7 | 68 744.6 | |
| Erlich’s method | Number of all clusters | 24 682.9 | 24 579.9 |
| Number of size-1 clusters | 9443.2 | 9966.9 | |
| Ratio of size-1 clusters to all clusters | 38.3% | 40.5% | |
| Ratio of size-1 clusters to all sequence reads | 12.8% | 14.5% | |
| Proposed method | Number of all clusters | 17 634.7 | 17 328.9 |
| Number of size-1 clusters | 2054.2 | 2431.4 | |
| Ratio of size-1 clusters to all clusters (C1) | 11.6% | 14.0% | |
| Ratio of size-1 clusters to all sequence reads (C1) | 2.8% | 3.5% | |
| Number of discarded reads by Hamming distance (C2) | 218.0 | 401.9 | |
| Number of decoding successes gained by Q-score sorting (C3) | +0/200 | +8/200 | |
| Number of RS-corrected reads (C4) | 190.8 | 222.1 | |
| Read-utilization gain over Erlich’s method | 10.6% | 11.9% |
Note. The numbers are average values of the 200 trials. We marked (C1–C4) at the end of each corresponding item in the proposed method part of the table.
The major strength of this improvement is that the increase of the computational complexity in our decoding method is negligible compared to Erlich’s method. Contributions C1 and C2 can be calculated while the clustering stage is in progress, contribution C3 gets conducted for only cluster groups of size 1, and we can correct the errors for C4 during RS syndrome check of each sequence read. Furthermore, reading cost reduction implies not only the decrease of the reading cost literally, but also condensing more information possibly into the same oligo pool when the maximum number of sequence reads is limited. That is, we can raise the code rate of the DNA storage, effecting the writing cost reduction as well.
One thing we should be aware of is that the constrained pool is generally known to need a smaller amount of sequence reads for decoding success than the non-constrained pool. Our results imply that both decoding methods work better when proper GC-content and homopolymer-run are kept. In the large random sampling number for Erlich’s method, the decoding performance is reversed between the constrained pool and the non-constrained pool, and we think that it is because of the accidental inclusion of sequence reads with large errors, which is excluded in the proposed decoding method.
3.2 Channel characteristics
We calculated several channel characteristics regarding our DNA storage pools from the experiment data for future use. Using the PEAR algorithm (Zhang et al., 2014), we merged the forward-reads and the reverse-reads for all lengths and checked the distribution of the lengths as in Table 3. More than 83% of the sequence reads have the correct length, and constrained pool has higher percentage of merged sequence reads than the non-constrained pool. Also, the percentages of shortened sequence reads are higher than the percentages of lengthened sequence reads, and this implies that deletion errors occur more frequently than insertion errors in the DNA storage system.
Read-length distribution of merged sequence reads using the PEAR algorithm
| Length after PEAR | Constrained pool | Non-constrained pool |
|---|---|---|
| ≤149 nt | 4.10% | 2.78% |
| 150 nt | 0.51% | 0.48% |
| 151 nt | 2.91% | 2.78% |
| 152 nt | 85.78% | 83.83% |
| 153 nt | 1.06% | 0.99% |
| 154 nt | 0.02% | 0.02% |
| ≥155 nt | 0.29% | 0.58% |
| Total | 94.66% | 91.46% |
| Length after PEAR | Constrained pool | Non-constrained pool |
|---|---|---|
| ≤149 nt | 4.10% | 2.78% |
| 150 nt | 0.51% | 0.48% |
| 151 nt | 2.91% | 2.78% |
| 152 nt | 85.78% | 83.83% |
| 153 nt | 1.06% | 0.99% |
| 154 nt | 0.02% | 0.02% |
| ≥155 nt | 0.29% | 0.58% |
| Total | 94.66% | 91.46% |
Note. Over 83% of the sequence reads have correct lengths for both pools, and the percentages of shortened sequence reads are higher than the percentages of lengthened sequence reads. Note that the constrained pool has higher percentages of the merged sequence reads than the non-constrained pool.
Using the merged sequence reads of the correct length, we calculated the frequency of sequence reads to each encoded oligo sequences, which is also called a sequence coverage, in Figure 5. We matched them by the smallest edit-distance to each encoded oligo sequence. Although the two pools had different numbers of reads after the sequencing, we wanted fair comparison for the coverage. Therefore, we randomly sampled the same number of merged reads (90 000 reads) from the two pools, and compared them together with the ideal Poisson distribution of mean coverage 5. In Figure 5, the two pools are spread widely compared to the ideal Poisson distribution. Also, we observed that the coverages of both pools have similar distributions after the PEAR algorithm (Zhang et al., 2014), while Table 3 shows that the constrained pool has better merging percentages than the non-constrained pool. The advantage of constrained coding is clearly shown when the sequence reads are at the merging stage.
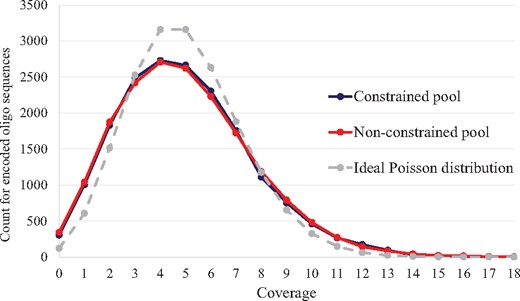
Distribution of sequence coverage for 18 000 encoded oligo sequences in both constrained pool and non-constrained pool of 90 000 random sampling merged reads compared to the ideal Poisson distribution of mean coverage 5
While we were checking the Q-score values, we wanted to see the correlation between the edit distance and the P-value mentioned in Section 2.3.2. We chose one of our randomly sampled FASTQ files and expressed the correlation in Figure 6. As a result, we can see that most of the dots are located in the bottom right section of the graph, making a very gradual slope of decreasing as P value becomes bigger. This correlation implies that when the P value is high, the probability of a sequence read to have a large edit distance is very low, which strengthens one of our contributions of using P value during the decoding procedure. Moreover, there are a few dots located very far from the main cluster, and we think they were generated from the random errors of biological and chemical reasons. This also explains the validity of our discarding strategy using the Hamming distance.
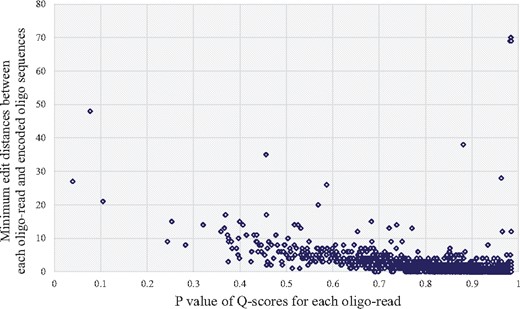
Correlation between edit distance (sequence read to original encoded oligo sequence) and P value for randomly sampled sequence reads. Most of the dots are located in the bottom right section of the graph
4 Discussion and conclusion
We proposed a new decoding method that was helpful for decoding procedure in the DNA storage system. We mainly focused on the fountain code and the RS code structure, but our work can be applied to any DNA storage using the intra- and inter-oligo code structure and the Hamming-distance based clustering. In particular, any error detection codes, such as cyclic redundancy check (CRC) code, are suitable for the intra-oligo code, and any erasure codes such as fountain code, RS code and maximum distance separable (MDS) code are suitable for the inter-oligo code. Our proposed decoding algorithm is based on the four core techniques C1, C2, C3 and C4, and the applicability to the general code structure is explained as follows.
First, any intra-oligo detection code also has some error correction capability, and the idea of C4 can be applied to the general code structure. Second, the Hamming-distance based clustering is simple but powerful, and thus it is popular for a decision making of several sequence reads to an original encoded oligo sequence. Research in Lenz et al. (2020) proved that the Hamming-distance based clustering can achieve the capacity of the DNA storage channel efficiently without increasing the computational complexity. The techniques C1 and C2 can be adopted to any Hamming-distance based clustering and the specific threshold values in C1 and C2 depend on the parameters of the general intra- and inter-oligo code structure. Last, the idea of C3 can also be applied to the general code structure because any intra-oligo code cannot perfectly detect the errors and thus the usage of quality scores will be useful for the inter-oligo erasure decoding.
In fact, clustering by comparing Hamming distances (Organick et al., 2018; Zorita et al., 2015) and applying RS code for error correction (Meiser et al., 2020) are already mentioned, but the discarding step using the Hamming-distance and sorting by Q-score values for clusters with size 1 were proposed for the first time in the DNA storage area in this article. By using clustering and alignment, we were able to improve the decoding performance of the DNA storage system. We carefully verified all our decoding steps by isolating each step and finding out how it contributed to any performance improvement. We also provided the raw data files from our experiments along with other statistics; these may be helpful in the analysis of DNA storage channel characteristics.
In this article, we mainly focused on improving decoding performance of adopted error-correcting codes. However, we realized that there are many other factors that we need to study in order to develop the technology for an effective DNA storage system. We found that error correcting codes for the indices and CRC codes to ensure the integrity of the entire file should be added to the encoding stage. Abnormal sequence reads created by random errors should also be analyzed, which may have been originated from the PhiX sequences or byproducts, such as primer dimer.
After all, while we were working with Illumina sequencing instruments, we think that the proposed decoding method may be helpful for Oxford Nanopore sequencing instruments too. Previous researches, such as Chandak et al. (2020) and Lopez et al. (2019), used the Nanopore sequencing, but they also had the clustering stage before the decoding stage. We verified our algorithms with Illumina sequencing experiments, but our decoding algorithms can be used to any DNA storage systems that need clustering stage regardless of the types of sequencing equipment or the coding schemes. As mentioned in Lenz et al. (2020), the Hamming-distance based clustering can achieve the capacity of the DNA storage channel efficiently without increasing the computational complexity, and clustering will be used extensively even in the Nanopore sequencing instruments, leaving a great possibility for the proposed decoding method to be applied. Moreover, the applicability of the proposed decoding algorithm basically depends on not only the specific implementation of the DNA storage system but also the error characteristics of the system. To assess the applicability on the new DNA storage systems, we need to first investigate the error characteristics of Newman’s microfluidic library (Newman et al., 2019) and Choi’s disc system (Choi et al., 2020), and it is a good topic for future research to extend our proposed decoding scheme to their systems. We look forward to making further efforts to continually raise the q-uality of decoding techniques for DNA storage systems.
Funding
This work was supported by the Samsung Research Funding and Incubation Center of Samsung Electronics under Project [SRFC-IT1802-09].
Conflict of Interest: none declared.
References
Illumina Inc. (

