


Abstract
Aligning single-cell transcriptomes is important for the joint analysis of multiple single-cell RNA sequencing datasets, which in turn is vital to establishing a holistic cellular landscape of certain biological processes. Although numbers of approaches have been proposed for this problem, most of which only consider mutual neighbors when aligning the cells without taking into account known cell type annotations.
In this work, we present MAT2 that aligns cells in the manifold space with a deep neural network employing contrastive learning strategy. Compared with other manifold-based approaches, MAT2 has two-fold advantages. Firstly, with cell triplets defined based on known cell type annotations, the consensus manifold yielded by the alignment procedure is more robust especially for datasets with limited common cell types. Secondly, the batch-effect-free gene expression reconstructed by MAT2 can better help annotate cell types. Benchmarking results on real scRNA-seq datasets demonstrate that MAT2 outperforms existing popular methods. Moreover, with MAT2, the hematopoietic stem cells are found to differentiate at different paces between human and mouse.
MAT2 is publicly available at https://github.com/Zhang-Jinglong/MAT2.
Supplementary data are available at Bioinformatics online.
1 Introduction
Over the last decade, single-cell RNA sequencing (scRNA-seq) has attracted more and more attention for unbiased exploration of transcriptome variation at single-cell level (Tanay and Regev, 2017). Accordingly, scRNA-seq has been widely utilized for investigating cellular heterogeneity and transcriptional dynamics under various conditions, e.g. the development lineage of certain cells or tissues (Park et al., 2020; Treutlein et al., 2014; Zhong et al., 2020). Generally, multiple scRNA-seq datasets may be generated by different labs for a same biological problem of interest, where each individual dataset may cover only a limited number of cell types. Therefore, the integration of multiple scRNA-seq datasets is a promising strategy for uncovering the heterogeneity of cellular compositions and the holistic biological process. However, it is a big challenge for jointly analyzing multiple scRNA-seq datasets that are generated by different labs due to technical variations or batch effects, etc.
The integration of scRNA-seq datasets can be regarded as an alignment problem (Cao et al., 2020) where the individual datasets will be aligned against each other. When aligning multiple scRNA-seq datasets, identifying cellular correspondences across datasets is one of the most important steps. Accordingly, the existing approaches for aligning multiple scRNA-seq datasets can be grouped into two classes, i.e. cell alignment and cluster alignment approaches.
As typical cell alignment approaches, MNNCorrect (Haghverdi et al., 2018), Seurat (Stuart et al., 2019), Scanorama (Hie et al., 2019) and BBKNN (Polański et al., 2020) select mutual nearest neighbors (Haghverdi et al., 2018) from different datasets as anchors based on their gene expression profiles or latent vectors. Recently, cell cluster approaches become popular with robust results of alignment, where cell clusters instead of cells are used for alignment at the population level. Among them, scMerge (Lin et al., 2019) looks for mutual nearest neighbors between cell clusters, and Harmony (Korsunsky et al., 2019) maximizes the mixing of cells within clusters through soft clustering. Although the above methods perform well when aligning multiple datasets composed of common cell types, they may fail to work on those datasets with few shared cell types. In addition, most of existing approaches work in unsupervised way by looking for cells with similar gene expression profiles as same cell types, whereas the annotation of known cell types has not been fully utilized.
In this work, we present a novel approach, namely manifold alignment of single-cell transcriptomes with cell triplets (MAT2), to align multiple scRNA-seq datasets in their latent manifold space. Compared with existing methods that only consider cells with similar gene expression profiles as positive anchors across datasets, MAT2 also takes into account pairs of cells with functional difference as negative anchors by employing contrastive learning (Chen et al., 2020; Hoffer and Ailon, 2015), and composes the cells and the cells forming the positive and negative anchors into cell triplets to guide the alignment in a discriminative way. With contrastive learning, MAT2 is able to take into account of the prior knowledge of cell types and define a more reasonable manifold space for cellular transcriptomes, where the cells of the same type will stay closer. Moreover, by reconstructing both consensus and batch-specific matrices from the latent manifold space, MAT2 can be used to recover the batch-effect-free gene expression that can be used for downstream analysis. When benchmarking on real scRNA-seq datasets, MAT2 outperforms other popular approaches with robust alignment results for cell type annotation and performs especially well over datasets with few shared cell types. We further integrated the human and mouse embryo datasets, verifying that HSC-primed hemogenic endothelial cells (HECs) develop at different paces in human and mouse.
2 Materials and methods
2.1 Datasets and pre-processing
As shown in Table 1, we collected nine datasets and grouped them into four datasets according to tissues, each of which contains only the genes shared by all batchs within every dataset. All datasets were downloaded from NCBI’s Gene Expression Omnibus (GEO) database (http://www.ncbi.nlm.nih.gov/geo/) and EBI’s ArrayExpress database (https://www.ebi.ac.uk/arrayexpress/). References for the datasets are available in Supplementary Table S1.
Statistics of the four datasets
| Platform and number of cells | Number of cell types | Cell state | Shared cell types | Difference between datasets | Accession number | |
|---|---|---|---|---|---|---|
| Retina | All by Drop-seq
| 19, 19 (19 in total) | Mature | 100% | Different batches | GSE81904 |
| Pancreas |
| 13, 13, 13, 13 (13 in total) | Mature | 100% | Different platforms |
|
| Hematopoietic |
| 6, 3 (6 in total) | Intermediate | 50% | Different platforms and developmental stages |
|
| Embryo | All by STRT-seq
| 5, 6 (6 in total) | Intermediate | 83.3% | Different species |
|
2.2 Manifold alignment of single-cell transcriptomes with cell triplets
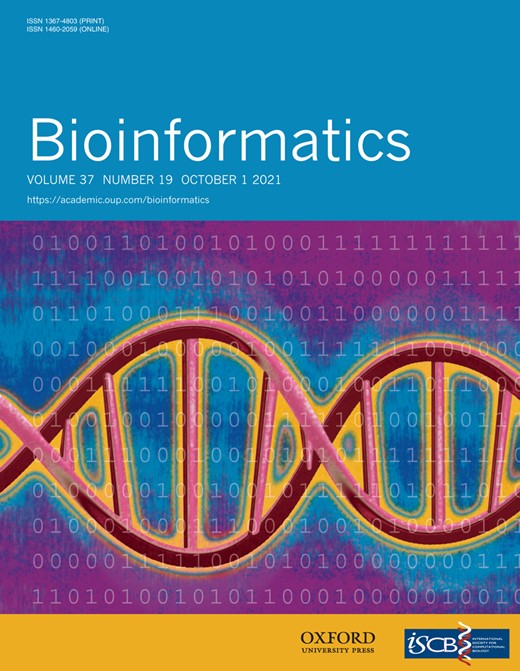
As shown in Figure 1, MAT2 aligns multiple scRNA-seq datasets in a manifold space. Briefly, MAT2 consists of the following steps: (a) Each gene expression matrix of a scRNA-seq dataset will be transformed into a manifold space with the utility of encoder, and the cells will be aligned against each other based on their gene expression with the help of contrastive learning. In contrastive learning, for a cell of interest denoted as C, a cell from the same type but different datasets denoted as Cp and a cell from different types denoted as Cn will be considered, and a triplet will be formed. A consensus manifold will be achieved for all datasets, where C and Cp will stay close while C and Cn will be separated from each other (Fig. 1a); (b) For each cell type with its consensus manifold, two decoders ( and ) will be built to recover the deviation of cellular transcriptomes from the consensus manifold and the consensus transcriptome across multi-datasets, respectively (Fig. 1b). The former () reflects the technology- or platform-specific effect on gene expression, while the latter () reveals the cell-type-specific regulation of transcriptome. Therefore, MAT2 can be regarded as a decomposition of the original cellular transcriptome data into a consensus gene expression matrix and a batch deviation matrix; and (c) With the cell-type-specific gene expression matrix, the downstream analysis, e.g. trajectory analysis and differential expression analysis can be performed (Fig. 1c).
The schematic view of MAT2. (a) The gene expression matrix of each dataset is transformed into a latent consensus manifold, and the manifold alignment of multiple datasets is achieved at the same time. (b) With the manifold, two decoders are employed to divide the original gene expression matrix into a consensus expression matrix and a batch-specific deviation matrix. (c) The manifold and consensus gene expression can be used for downstream analysis, such as trajectory analysis and differential expression analysis
2.2.1 Alignment of single-cell manifolds
With the above objective function, an encoder neural network composed of fully connected layers is trained with Pytorch and optimized with Adam (Kingma and Ba, 2014), where the input size is equal to the number of genes and the output size is set to 20 as default. The neural network uses rectified linear unit (ReLU) (Glorot et al., 2011) as the activation function in the two hidden layers and linear activation function for the output layer. Two more operations were adopted during learning, including L2 regularization with a ratio of 0.01 and dropout (Srivastava et al., 2014) with a ratio of no more than 0.3. The mini-batch stochastic gradient descent (Cotter et al., 2011) is used for optimization by randomly selecting triplets for training, where a mini-batch contains 256 cell triplets.
2.2.2 Reconstruction of gene expression
The two decoders used for reconstruction adopt the same training strategy as the encoder for alignment. The difference between the two decoders is that fR and fD are single-layer and two-layer fully connected networks, respectively, where ReLU is used as activation function of the output layer in fR to obtain non-negative gene expression.
3 Results
3.1 Benchmark results on pancreas and retina scRNA-seq datasets
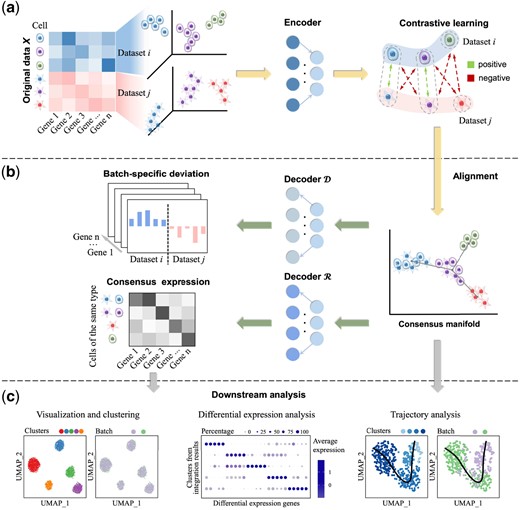
We evaluated the performance of MAT2 and compared it with the state-of-the-art methods on retina datasets (Shekhar et al., 2016) and pancreas datasets (Grün et al., 2016; Lawlor et al., 2017; Muraro et al., 2016; Segerstolpe et al., 2016) (see Table 1). Here, we selected four methods for comparison, including two state-of-the-art methods, namely Seurat (version 3) (Stuart et al., 2019) and Harmony (Korsunsky et al., 2019), as reported recently (Tran et al., 2020), scMerge (Lin et al., 2019) that can work in both supervised and unsupervised modes, and a neural network model named scANVI (Xu et al., 2021) that can work in supervised mode with provided cell type annotations. We noticed that a similar approach named INSCT (Simon et al., 2020) was proposed when this manuscript was drafted, which also uses cell triplets for alignment, and we also compared MAT2 against INSCT here. Since MAT2, INSCT and scMerge can work in supervised and unsupervised settings, we used MAT2-s and MAT2-u to respectively denote MAT2 working in these two settings, and the same for INSCT-s, INSCT-u, scMerge-s and scMerge-u. The same inputs to MAT2 were also given to scANVI so that it can work in supervised setting. Once the multiple datasets were aligned into a single dataset in the gene expression space or latent manifold space by a certain method, Louvain (Blondel et al., 2008) was employed at different resolutions from 0 to 0.5 at interval of 0.01 to cluster cells to determine the cell types, where each cluster represents a cell type. The adjusted rand index (ARI) (Hubert and Arabie, 1985) was utilized to check the accuracy of cell types assigned by clustering. For each method, the maximum ARI calculated based on the clustering results of different resolutions was used as the ARI of this method. Furthermore, local inverse Simpson’s index (LISI) (Korsunsky et al., 2019) was adopted to assess the degree of dataset mixing for each aligned dataset.
Figure 2 shows the results by the nine approaches over the benchmark datasets. Overall, MAT2, especially MAT2-s, achieved the best results when assigning cells to corresponding cell types with the highest ARI over the two datasets compared with the other methods (Fig. 2a, Supplementary Tables S2 and S3). For dataset mixing, the LISIs of MAT2 were among the best on these two datasets, proving its ability to effectively integrate datasets from distinct batches and platforms. Although INSCT-s, scMerge-s and scANVI also work in supervised way, MAT2-s significantly outperformed scMerge-s by 47.1%, INSCT-s by 21.0% and scANVI by 19.4% with respect to LISI on average, indicating the effectiveness of MAT2 when integrating multiple datasets.
Benchmarking of MAT2 and other the state-of-the-art methods on retina and pancreas datasets. (a) The results of cell type assignment (ARI) and dataset mixing (LISI) on retina and pancreas datasets by the nine methods. (b) Visualization of the pancreas dataset with respect to both cell types (left) and platforms (right), where the pancreas dataset has significant platform difference. (c) Visualization of the results of the nine methods using the same color in b to mark cell types (upper) and platforms (lower). (d) The ARI results on the integrated retina and pancreas datasets by MAT2-s, INSCT-s and scANVI with the proportion of training cells ranging from 100% to 5%. (e and f) The computation time and memory usage of the nine methods on pancreas datasets with increased sampling sizes
To better demonstrate the performance of MAT2, Figure 2b and c show the visualization results of pancreas datasets by UMAP (Becht et al., 2019) without or with integration, respectively (the results on retina datasets can be found in Supplementary Fig. S1). From the results, it can be seen that all the methods except for Harmony performed very well when separating distinct cell types (Fig. 2a, right and Fig. 2c, top), where MAT2-s outperformed other approaches while MAT2-u performed comparably well with Seurat. We also noticed that MAT2, Seurat and Harmony perform well with respect to LISI (Fig. 2c, bottom), indicating the effectiveness of these approaches to integrate multiple datasets. Surprisingly, scMerge showed poor performance with respect to LISI, implying insufficient dataset mixing of the same cell type, which is consistent with previous reports that scMerge may fail to work in some cases (Tran et al., 2020). Although we found a structure similar to MAT2 in INSCT, the actual performance of the two is significantly different in the above dataset. In order to further make a fair comparison, we also tested MAT2 and INSCT with the datasets used in Simon et al. (2020) (Supplementary Fig. S2). Whether using ARI or LISI for metrics, MAT2 had obvious superiority.
Since MAT2, INSCT and scANVI can work in supervised setting and show best performance in above results, we investigated the effect of the number of training cells on the performance of MAT2-s, INSCT-s and scANVI. Figure 2d shows the ARI results of MAT2-s, INSCT-s and scANVI with the percentage of cells used for training from 100% to 5%. With the number of training cells decreasing, MAT2-s showed robust performance with only 3.8% and 4.0% reductions of ARIs on retina and pancreas, respectively (Supplementary Table S4). INSCT-s and scANVI had a significant decrease in ARI over the pancreas and retina datasets, respectively. It can be seen that MAT2-s trained with few (hundreds) samples still worked efficiently, which is especially important for large datasets with very few known cell types.
When integrating multiple scRNA-seq datasets, computation consumption is also the issue to be concerned. We compared the nine approaches with respect to their computation time and memory usage with a Linux server equipped with 12-core AMD Ryzen Threadripper 1920X, 125 GB RAM and GeForce RTX 2080 Ti. The running time and memory usage of the nine approaches on the cell sets composed of various numbers of cells sampled from pancreas datasets were respectively shown in Figure 2e and f, where the time of reading data was not recorded. The CPU time for all the approaches considered here with or without GPU can be found in Supplementary Table S5, and the detailed memory usage can be found in Supplementary Table S6. Note that it takes more time for the additional step of reconstructing gene expression in MAT2. Even so, from the results, it can be seen that MAT2 performed comparatively well with popular approaches. The results also indicate that MAT2 has the potential to integrate millions of cells on personal computers.
3.2 MAT2 aligns cellular states along developmental lineage
The scRNA-seq technology has been widely used for tracing cell lineage during developmental procedure, where various datasets may be generated for the same procedure. Here, different approaches were applied to align two hematopoietic datasets (Nestorowa et al., 2016; Paul et al., 2015) with obvious batch effect as shown in Supplementary Fig. S3a. The whole differentiation procedure contains six cell types, i.e. long-term HSC (LT-HSC), megakaryocyte/erythroid progenitor (MEP), granulocyte/monocyte progenitor (GMP), common myeloid progenitor (CMP), multipotent progenitor (MPP) and lymphoid multipotent progenitor (LMPP).
The UMAP visualization results based on the aligned datasets generated by MAT2, scMerge, INSCT, Seurat, Harmony and scANVI were shown in Supplementary Fig. S3. With cell type annotations, MAT2-s could successfully identify most cell types with the help of contrastive learning, and performed especially well to prevent LT-HSC, MPP and LMPP that only occur in a single dataset from being confused with the other three types. scMerge-s could successfully identify most of the cells belonging to CMP, GMP and MEP shared between datasets, but failed to identify the other three cell types. INSCT-s was difficult to integrate these two hematopoietic datasets. When cell type annotations were not used, the unsupervised approach including MAT2-u could identify MEP and GMP cells while it failed to separate the other four cell types. In particular, a large number of anchors describing the correspondence between cells (e.g. 39.5% for Seurat) link LT-HSC, MPP and LMPP to CMP, which made it difficult to separate the four cell types. When looking at the results of cell annotations with respect to ARI, we noticed that MAT2-s performed best on assigning cell types with ARI of 0.922, surpassing the second ranked scMerge-s by 18.1%.
To evaluate whether gene expression reconstructed by MAT2 conserves the original biological signals, we clustered the cells in the reconstructed gene expression space and performed the differential expression analysis (P-value = 0.01) with Seurat R package (Stuart et al., 2019) (Supplementary Fig. S4). In the results of MAT2-s, the differentially expressed genes (DEGs) with the same cell types had similar expression profiles between datasets. scMerge-s also produced an accurate integration of the cells of CMP, GMP and MEP in two datasets and generated the corrected gene expression. However, the expression profiles of the DEGs derived from the scMerge-s’ gene expression were significantly different between datasets. Therefore, MAT2 not only placed cells with the same cell types together but also could get rid of batch effect to recover the true biological signals. Considering the transition between cell types is a continuous procedure, we extended MAT2 to the semi-supervised mode, denoted as MAT2-semi hereafter. MAT2-semi first forms the cell triplets based on labeled cells in the same way as that of MAT2-s, and then mixes them with the cell triplets that have been used in MAT2-u for training. In this way, MAT2-semi can utilize known cell types and anchor scores for cells without labels. We evaluated MAT2-semi on hematopoietic datasets by keeping 10% of the cell type annotations as labeled. MAT2-semi was able to show the transition of gene expression patterns from CMPs to MEPs more obviously (see Supplementary Figs S3 and S4) with only few cell type annotations. At the same time, the DEGs found based on the results of MAT2 were consistent with the marker genes reported in the literature. For example, both Car1 and Car2 were significantly upregulated in MEP, which is consistent with previous reports that these two genes are marker genes of erythroid progenitors (Paul et al., 2015). In addition, Dntt was upregulated in MPP and LMPP, which was confirmed by a previous work that regarded it as a marker gene in both MPP and lymphoid lineages (Herman et al., 2018). The above results demonstrate that the consensus gene expression of MAT2 is effective for aligning cellular states along developmental lineage in datasets that are interfered by batch effects.
3.3 MAT2 infers species-specific cell lineage during HSC-primed HEC development
In this section, we investigated the performance of MAT2 when aligning two scRNA-seq datasets of HSC-primed HEC development from human (Zeng et al., 2019) and mouse (Hou et al., 2020) embryos (Table 1). The human and mouse datasets contain cells generated from the aorta-gonad-mesonephros (AGM) tissues of embryos during the equal period. According to previous annotations (Hou et al., 2020), the mouse cells annotated with the five cell types involved in the mouse HEC development were used as training samples, where the cell types consist of early and late arterial endothelial cell (aEC), hematopoietic cell (HC), HEC and venous endothelial cell (vEC). Furthermore, the non-EC negative control cells (Neg) from mouse dataset were used as control. With the clustering results over the aligned dataset by MAT2, all the cells will be grouped into six clusters with each cluster annotated with one of the six above cell types. Therefore, the human AGM-associated endothelial cells will be annotated as one of the five cell types, i.e. the early aECs, late aECs, HCs, vECs and HECs.
We first looked at the gene expression reconstructed from the results of aligned human and mouse data. As shown in Figure 3a, the reconstructed gene expression was significantly correlated with the original one (Pearson correlation, human, R = 0.69, P < 2.2e−16; mouse, R = 0.72, P < 2.2e−6), indicating the effectiveness of MAT2. Next, we performed the tSNE (Maaten and Hinton, 2008) analysis on the reconstructed gene expressions as shown in Figure 3b. From the results, we can see that the five cell types can be well separated from each other and are far from the negative controls (Neg). In addition, we looked at the marker genes specifying distinct subpopulations of endothelial cells in both human and mouse and wanted to see whether these marker genes have conserved expression patterns between mouse and human. We noticed that four genes have similar expression patters in human and mouse cells, where GJA5 was highly expressed in aECs, NRP2 was highly expressed in vECs, NT5E was highly expressed in vECs, and RUNX1 was highly expressed in HCs and HECs (Figure 3c–f). For example, the transcription factor RUNX1 was highly expressed in both human and mouse HECs (Fig. 3f), which is coincident with the observation that the upregulation of RUNX1 marks the initiation of the endothelial-to-hemogenic transition (EHT) and priming of endothelial cells toward HECs (Hou et al., 2020).
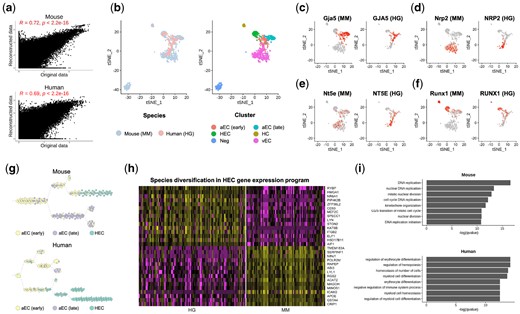
Alignment of cells during human and mouse HSC-primed HEC development with MAT2. (a) Pearson correlation between original gene expression data and reconstructed one. (b) tSNE visualization of mouse and human cells from AGM area, which were colored according to species (left) or cell clusters (right). (c–f) The expression of marker genes in human (HG) and mouse (MM). (g) The trajectory analysis results from aECs to HECs in mouse and human. (h) The heatmap of genes differentially expressed between human and mouse HSC-primed HECs. (i) The functional terms enriched in those genes from biological process
Considering species specificity, we further inferred the trajectories from aECs to HECs with ti_slingshot (Street et al., 2018) in Dyno (Saelens et al., 2019) based on the reconstructed transcriptome for human and mouse, respectively (Fig. 3g). It was a consensus that the early aECs differentiated into the late aECs and HECs in human and mouse data. However, the developmental paces of HECs were different in two species. In human, the early aECs differentiated to HECs ahead of the differentiation toward the late aECs (Fig. 3g bottom). In contrast, in mouse, the early aECs first differentiated to the late aECs and then HECs (Fig. 3g, top). With genes differentially expressed between human and mouse HECs identified with MAST (Finak et al., 2015) (P < 0.01), the discrepancy of gene expression programs between human and mouse HECs was revealed as shown in Figure 3h. The upregulated genes in human HECs included HMGA1, CD53 and ITGB2, which marked the development of HCs. Furthermore, the gene ontology (GO) analysis of biological processes performed by clusterProfiler (Yu et al., 2012) R package confirmed that the human HEC-specific genes were enriched in hematopoietic lineage differentiation (Fig. 3i). On the other hand, the upregulated genes in mouse HECs were intensively involved in cell division and disjunction. Both the trajectory and functional analysis indicated that two commitment events of the early aECs happened at different temporal orders in human and mouse embryos respectively, which is consistent with earlier speculation of Hou et al. (2020). The above results indicate that MAT2 can help researchers align scRNA-seq datasets of different species to study species-specific gene expression.
4 Discussion
The joint analysis of multiple scRNA-seq datasets can help elucidate the comprehensive landscape of cellular compositions of certain tissues or processes. In this work, we present a novel approach, MAT2, for aligning cells from multiple datasets by taking into account negative anchors with contrastive learning, which outperforms other popular approaches over several real datasets. Except for cell alignment in the manifold space, MAT2 is able to reconstruct the consensus gene expression profile for a certain cell type, which in turn can be used for downstream analyses, e.g. trajectory analysis and differential gene expression analysis. We showcased that the transcriptome reconstructed by MAT2 can help reveal the gene expression conservation and discrepancy between human and mouse AGM-associated HSC-primed HECs.
The good performance of MAT2 is attributed to contrastive learning, which utilizes both positive and negative anchors when integrating multiple scRNA-seq datasets. In contrast, both existing cell alignment and cluster alignment approaches generally rely on positive anchors when aligning single-cell transcriptomes, whereas reliable positive anchors may be not always available especially for datasets with unshared cell types. The superiority of using negative anchors is that it can prevent distinct cell types from being mapped to the same ones, thereby improving the stability of scRNA-seq data integration, which is especially helpful for identifying rare cell types or inferring cell lineages.
At present, the rapid development of multi-modal data makes it a practical need to integrate these data for analysis. Compared with using a single modality to identify cell states, multi-modal data can provide more complete information to reveal the nuances of cell types, thus enhancing the understanding of regulatory mechanisms. Existing methods have made some attempts in this direction. For example, Seurat (Stuart et al., 2019) uses scRNA-seq data to transfer cell types to scATAC-seq data, and LIGER (Welch et al., 2019) uses scRNA-seq and DNA methylation data to jointly identify cell types. Next, we envisage extending MAT2 to single-cell multi-modal data to gain a deeper understanding of the cell state and its transcriptional regulation mechanism.
Funding
This work was partly supported by the National Key R&D Program of China (2020YFA0712403, 2018YFC0910500), National Natural Science Foundation of China (61932008, 61772368, 61503314), Shanghai Science and Technology Innovation Fund (19511101404), Shanghai Municipal Science and Technology Major Project (2018SHZDZX01) and Natural Science Foundation of Fujian Province, China (2019J01041).
Conflict of Interest: none declared.

