


Abstract
Genetic or epigenetic events can rewire molecular networks to induce extraordinary phenotypical divergences. Among the many network rewiring approaches, no model-free statistical methods can differentiate gene–gene pattern changes not attributed to marginal changes. This may obscure fundamental rewiring from superficial changes.
Here we introduce a model-free Sharma–Song test to determine if patterns differ in the second order, meaning that the deviation of the joint distribution from the product of marginal distributions is unequal across conditions. We prove an asymptotic chi-squared null distribution for the test statistic. Simulation studies demonstrate its advantage over alternative methods in detecting second-order differential patterns. Applying the test on three independent mammalian developmental transcriptome datasets, we report a lower frequency of co-expression network rewiring between human and mouse for the same tissue group than the frequency of rewiring between tissue groups within the same species. We also find second-order differential patterns between microRNA promoters and genes contrasting cerebellum and liver development in mice. These patterns are enriched in the spliceosome pathway regulating tissue specificity. Complementary to previous mammalian comparative studies mostly driven by first-order effects, our findings contribute an understanding of system-wide second-order gene network rewiring within and across mammalian systems. Second-order differential patterns constitute evidence for fundamentally rewired biological circuitry due to evolution, environment or disease.
The generic Sharma–Song test is available from the R package ‘DiffXTables’ at https://cran.r-project.org/package=DiffXTables. Other code and data are described in Section 2.
Supplementary data are available at Bioinformatics online.
1 Introduction
Molecular network rewiring in cells can induce an extraordinary phenotypical divergence such as pluripotency and differentiation (Boland et al., 2014; Thiagarajan et al., 2014). Rewiring arises from either genetic variations (Lundby et al., 2019; Van Roey et al., 2013) or epigenetic reprogramming (Klinakis et al., 2020; Reik, 2007; Watanabe et al., 2013). Rewired distal enhancer–promoter interactions within conserved topologically associating domains (TADs) are the basis of tissue specificity (Dixon et al., 2012, 2015; Phillips-Cremins et al., 2013; Smith et al., 2016). In diseases, TAD boundaries are disrupted to rewire enhancer–gene interactions (Lupianez et al., 2015). Such biological importances of rewiring motivated many computational methods to infer differential molecular networks from high-throughput omics data. However, we see a lack of statistical foundation to account for observed differences across systems as caused by either changed upstream input or a truly rewired connection—the latter may drown in an ocean of superficial differences, potentially missing a critical biological event.
Here, we define a conceptual framework that distinguishes types of change across conditions. We define differential/conserved relationships between two random variables by the presence/absence of differences in joint distribution across conditions. A relationship is conserved if the pair of random variables share a joint distribution across all conditions; otherwise they are differential. If relationships under some conditions differ in the marginal distribution of either variable, they are first-order differential. If some relationships differ in joint distribution not attributed to differences in marginal distribution, they are second-order differential. Relationships are full-order differential if they are both first- and second-order differential. In the context of a biological system, we argue that second-order differences be intrinsic in network rewiring. This is because a first-order difference does not require a changed biological circuitry; it can be due to different downstream responses by two systems identical in circuitry but with changed input. Transcriptome differences of the same tissue type between human and mouse are reported to be much greater than differences between distinct tissue types within the same species (Lin et al., 2014); this finding provoked a debate on whether it is caused by artifacts of unwanted confounding effects (Gilad and Mizrahi-Man, 2015). However, the reported transcriptome differences can be dominated by first-order effects; the extent of mammalian molecular network rewiring at the second-order is not answered.
Differential correlation underlies the majority of methods for network rewiring analysis (de la Fuente, 2010; Hu et al., 2009; Jardim et al., 2019; Leonardson et al., 2010; McKenzie et al., 2016; Mentzen et al., 2009). It can detect second-order differences but only when variables in a relationship are linearly related. Pairwise differential correlation is generalized to differences in parameters in regression (Ha et al., 2015; He et al., 2019; Kim et al., 2018; Ouyang et al., 2011; Xu et al., 2019), but again with a strong assumption on the mathematical form of relationships. Tests of differential patterns model-free—without assuming parametric mathematical models for relationships—are scarce. A chi-squared heterogeneity test for goodness of fit is available from statistics textbooks (Zar, 2009). It is not as powerful as a comparative chi-squared test (Song et al., 2014) that was applied to detect rewiring in fruit fly gene networks and yeast metabolic pathways (Zhang et al., 2015). A recent model-free chi-squared test named marginal change test determines the first-order change in a pair of random variables across conditions (Sharma et al., 2020). However, there is no method known to us to exclusively detect second-order differences in relationships.
To detect second-order differential patterns model-free, we present the Sharma–Song test. It uses a contingency table to represent frequencies of discrete row and column random variables. Such a table is the sample joint distribution of the pair, enabling us to infer whether population distributions are second-order differential without a parametric model. We quantify the difference in the extent to which the joint distributions of each pattern deviate from the product of their respective marginal distributions. We show that the test statistic is asymptotically chi-squared distributed under the null hypothesis. Our simulation studies demonstrate marked advantage of the test over alternatives in capturing second-order differential patterns. We also inspected the statistical power of the test via simulation.
To understand the extent of second-order co-expression network rewiring across tissue types within and between human and mouse, we apply the Sharma–Song test on three independent mammalian development transcriptome datasets: the uni-source FANTOM5 CAGE collection (FANTOM Consortium et al., 2014; FANTOM Consortium, 2017), the uni-source Evo-devo RNA-seq collection (Cardoso-Moreira et al., 2019) and a multi-source RNA-seq collection (Yang et al., 2017). All datasets captured gene expression of all major tissue and cell types in both human and mouse. Uni-source refers to data sequenced by the same organization, subject to fewer technical variations than data from multiple organizations (multi-source). First, we compare network rewiring of the same tissue groups between human and mouse. Second, we contrast different tissue groups within human and also within mouse. The two comparisons reveal higher frequencies of network rewiring across tissue groups than across species on all three datasets. We also examined network rewiring related to microRNA taking place in the development of cerebellum versus liver in mice on the FANTOM5 data. Second-order differential patterns between microRNA promoters and genes in the spliceosome pathway are highly enriched between cerebellum and liver. Complementary to previous work mostly driven by first-order effects, our findings contribute an understanding of system-wide second-order gene network rewiring within and across mammalian systems.
2 Materials and methods
2.1 Overview of the Sharma–Song test of second-order change in joint distribution
The Sharma–Song test evaluates statistical evidence for second-order differential patterns across contingency tables. The null hypothesis is that row and column variables are independent of each other in all tables and tables are independently observed. It takes as input K contingency tables of the same dimensions r × s. The test outputs test statistic D2, degrees of freedom ν and P-value, based on an asymptotically chi-squared null distribution. The P-value is the statistical significance of second-order differential patterns across the K tables. There are four major steps in the test as outlined in Figure 1a. In Step 1, first-order effects represented by expected are subtracted from each table and the remaining counts are normalized to by squared roots of expected counts in . In Step 2, we use Helmert transform to convert matrix to vector of dimension . Components in are i.i.d. standard normal variables under the null hypothesis. In Step 3, vectors Δk, deviation from each vector to the pooled, form columns in matrix Q. The rows of Q are projected to , the column space of common null covariance matrix of row vectors of Q. In Step 4, the squared Mahalanobis distances from the projected vectors to the origin are summed to give the test statistic D2, chi-squared distributed with degrees of freedom ν under the null hypothesis. Figure 1b illustrates the test on two genes NOTCH3 and PDGFA from the Evo-devo RNA-seq data (Cardoso-Moreira et al., 2019). NOTCH3, a neurogenic locus notch homolog protein 3, regulates the expression of PDGFRB (Jin et al., 2008), which in turn interacts with heterodimers formed by PDGFA and PDGFB (Stelzer et al., 2016). Additionally, the NOTCH3–PGDFA interaction is predicted (McDowall et al., 2009). Contrasting the discretized co-expression patterns of the pair between human ectoderm and primitive streak-derived tissue groups, the NOTCH3–PDGFA gene pair is declared statistically significantly second-order differential () between the two tissue groups.
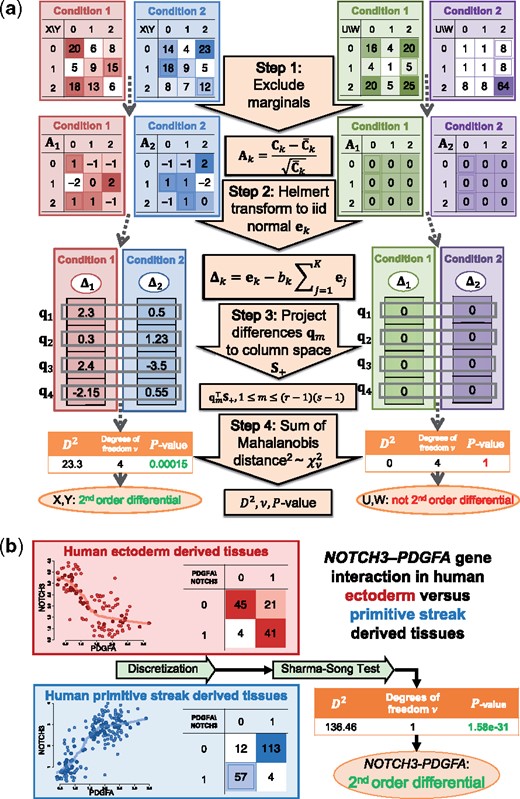
Overview and examples of the Sharma–Song test to detect second-order differential patterns. (a) The test has four steps, illustrated on two pairs of 3 × 3 contingency tables. At a significance level of 0.05, the first pair (X, Y) is declared second-order differential but not the second pair (U, W). (b) Applying the Sharma–Song test on the genes NOTCH3 and PDGFA using Evo-devo data. Normalized (left) and discretized (right) co-expression patterns of the pair in human ectoderm (red box) and primitive streak (blue box) tissue groups are shown. At a significance level of 0.05, the NOTCH3–PDGFA gene pair is declared second-order differential between the two tissue groups
The relationship of the Sharma–Song test with other methods for detecting differential patterns is summarized in Table 1. Network rewiring methods based on parametric models are widely available but not model-free, carrying potential strong biases for new systems where parametric model assumptions may be violated. Choices of model-free approaches are relatively limited but they are less subject to model biases.
Statistical methods for testing three types of differential pattern
| Model-free | Differential | First-order differential | Second-order differential |
|---|---|---|---|
| Yes | Comparative chi-squared test | Marginal change test | Sharma–Song test |
| Heterogeneity test | Pearson chi-squared test | ||
| Kolmogorov–Smirnov test | |||
| No | Parametric regression | Generalized linear models | Differential correlation |
2.2 The Sharma–Song test
The Sharma–Song test examines K contingency tables for second-order differences. Let X and Y be two discrete random variables of r and s levels, respectively. For table , let be the joint probability mass function of X and Y; let and be the marginal distributions of X and Y. The K patterns are conserved if ; otherwise they are differential. The K patterns are first-order conserved if and ; otherwise they are first-order differential. The K patterns are second-order conserved if ; otherwise, they are second-order differential: some pattern deviates from the product of marginal distributions to an extent different from others. Patterns are full-order differential if they are both first- and second-order differential.
A contingency table whose row and column variables are statistically independent can be asymptotically partitioned into a matrix of independent standard normal random variables, by orthogonal transformation of table using an r × r row-Helmert matrix and an s × s column-Helmert matrix.
We use sample marginal probabilities to set and , resulting in the first row and first column of E containing all zeros (Lancaster, 1949).
The rank of covariance matrix is exactly K−1.
Under the null hypothesis of row and column variables being independent in K independent contingency tables of dimension r × s, the Sharma–Song test statistic D2 asymptotically follows a chi-squared distribution with degrees of freedom.
Theorem 1 is proven in Supplementary Material B. With the chi-squared null distribution, we can compute a P-value using the upper tail probability of an observed statistic as the significance of second-order difference.
Algorithm S1 Sharma–Song test in Supplementary Material C computes the test statistic, degrees of freedom, effect size and statistical significance. It takes as input K contingency tables of dimension r × s. Its time complexity is evidently , constant in the sample size of input tables, favorable for data of large sample sizes.
2.3 The second-order network rewiring pipeline
We introduce a pipeline for second-order network rewiring (Supplementary Material D). It first finds the median absolute deviation (MAD) of each cognate gene to remove hardly changed genes among the bottom 5% MAD. It then divides the datasets into four species-tissue groups based on developmental origin: human ectoderm, human primitive streak, mouse ectoderm and mouse primitive streak. Genes with zero variance within each group are removed from further analysis. It runs four comparisons: human ectoderm versus primitive streak, mouse ectoderm versus primitive streak, human versus mouse ectoderm and human versus mouse primitive streak. Each gene expression in each condition is discretized using an optimal univariate clustering algorithm (Song and Zhong, 2020; Wang and Song, 2011) that determines discretization levels by the Bayesian information criterion (Kass and Wasserman, 1995). Each co-expression pattern forms a contingency table. It then builds model-free co-expression networks of each comparison based on Pearson’s chi-squared test for each condition (Song et al., 2009). It reports Benjamini and Hochberg (1995) (BH) adjusted P-values and Cramér’s V (Cramér, 1999) effect size for each co-expression pattern among all possible gene pairs.
To detect second-order differential patterns with strong dynamics, significant co-expression with BH adjusted P < 0.1 and Cramér’s V > 0.8 in at least one condition is required for selecting a gene pair. All gene expression levels are standardized to zero mean and unit variance in each condition. Continuous expression values of each gene are discretized (Song et al., 2020) on merged samples for that gene. The Sharma–Song test evaluates co-expression patterns as contingency tables for second-order difference across conditions. BH-adjusted P-values and Sharma–Song effect sizes are collected for each co-expression pattern. To offer a sufficient strength of differentiality, we further require both a minimal Sharma–Song effect size ε and P-value for each study. To determine the cutoff, we generated an alternative population by simulating 100 000 discrete differential co-expression patterns in two experimental conditions with 100 samples in each. Differential co-expression patterns were simulated using simulate_tables (Sharma et al., 2017) in the ‘FunChisq’ R package (Zhang et al., 2020), where each of the two contingency tables were randomly selected to carry either a functional, a dependent but non-functional or an independent relationship. Both the number of rows and columns for each table were independently and randomly selected to be between two and the maximum dimension size (row or column) observed in tables from the study. We applied the Sharma–Song test to determine , the cutoff at 60% of the effect size computed on the alternative population. We provide an R package ‘DiffXCoExpNet’ and R scripts to analyze second-order rewired networks on omics data in Supplementary Material D. Code and data for omics application are available for download at https://www.cs.nmsu.edu/~joemsong/rewiring/.
2.4 Preparation of uni-source FANTOM5 CAGE data
Sample selection: The ectoderm-derived tissue group includes cerebellum, diencephalon, hippocampus, medulla oblongata, pituitary gland, skin and spinal cord. The primitive streak-derived tissue group includes aorta, colon, epididymis, heart, kidney, liver, lung, ovary, pancreas, prostate, spleen, testis, thymus, tongue and vagina. Adult samples are included. Developmental data, unmatched between human and mouse, are not used except two late neonatal time points N25 and N30 from mouse, as lab mice can reach sexual maturity as early as 3 weeks post-birth (Snell, 1956). Considering only healthy samples, we identified 34 human and 37 mouse samples. Transcription start sites selection: The first promoter region (p1) in FANTOM5 usually represents the primary transcript most abundantly expressed. Thus, we only used transcription start sites (TSSs) labeled as p1 in our analysis. We found p1 of 13 574 cognate gene names between human and mouse. Gene expression in tags per million was log transformed after adding one. By principal component analysis, we removed a sample of human skin tissue as outlier. After preprocessing, we selected 9757 genes of rich dynamics for second-order network rewiring analysis.
2.5 Preparation of uni-source Evo-devo RNA-seq data
The RNA-seq dataset by Cardoso-Moreira et al. (2019) was acquired from developing tissues of mammals from early organogenesis to adulthood. The time span of human tissues extended from week after conception, infants, juveniles, to adults, whereas mouse tissues were collected from embryo to post-neonate developmental stages. Gene expression is already normalized to RPKM. Sample selection: The dataset consists of seven tissue types out of which cerebellum and brain are ectoderm-derived and heart, kidney, liver, ovary and testis are primitive streak-derived. Human and mouse data have 297 and 316 samples, respectively. Gene selection: Out of 43 207 human and 35 192 mouse transcripts, we selected 15 992 cognate genes between human and mouse. Gene expression was log transformed after the addition of one. After preprocessing, 13 307 genes of rich dynamics go to second-order differential analysis.
2.6 Preparation of multi-source Yang et al. RNA-seq data
The RNA-seq dataset integrated by Yang et al. (2017) contains gene expression of differentiated tissues in unit of FPKM and is already normalized with batch effects removed. Sample selection: Out of 78 mouse and 184 human samples, we selected primary tissue types derived from either primitive streak or ectoderm. The primitive streak group includes colon, heart, kidney, liver, lung, ovary, placenta, spleen and testis; the ectoderm group includes brain, cerebellum and cortex. Gene selection: Out of 22 495 mouse and 20 343 human protein-coding genes, we selected 15 662 genes cognate between human and mouse. Gene expression was log transformed after the addition of one. After preprocessing, 13 910 genes of rich dynamics enter second-order differential analysis.
3 Results
3.1 Second-order gene network rewiring between tissues opposed to between mammalian species
To learn the extent of gene network rewiring across tissue types versus across mammals, we performed four comparative studies between two tissue groups and between human and mouse on the FANTOM5 CAGE, Yang et al. RNA-seq and Evo-devo RNA-seq collections. Table 2 and Figure 3 summarize the four comparative studies for all three collections.
Percentages of second-order rewired gene pairs among co-expressed gene pairs across tissue types and across mammalian species
| Collection | Comparison | Co-expressed | Second-order rewired (%) |
|---|---|---|---|
| Across tissue type | |||
| FANTOM5 | Human: ectoderm (16) versus primitive streak (18) | 521 416 | 112 794 (22%) |
| CAGE | Mouse: ectoderm (10) versus primitive streak (27) | 3 507 316 | 494 585 (14%) |
| Across species | |||
| Uni-source | Ectoderm: human (16) versus mouse (10) | 3 537 651 | 416 013 (12%) |
(n = 71) | Primitive streak: human (18) versus mouse (27) | 472 845 | 36 953 (8%) |
| Across tissue type | |||
| Evo-devo | Human: ectoderm (111) versus primitive streak (186) | 917 171 | 362 684 (40%) |
| RNA-seq | Mouse: ectoderm (98) versus primitive streak (218) | 4 913 298 | 1 305 751 (27%) |
| Across Species | |||
| Uni-source | Ectoderm: human (111) versus mouse (98) | 4 480 894 | 1 150 029 (26%) |
(n = 613) | Primitive streak: human (186) versus mouse (218) | 1 216 456 | 179 417 (15%) |
| Across tissue type | |||
| Yang et al. | Human: ectoderm (21) versus primitive streak (52) | 2 343 971 | 736 176 (31%) |
| RNA-seq | Mouse: ectoderm (14) versus primitive streak (37) | 2 783 768 | 639 630 (23%) |
| Across species | |||
| Multi-source | Ectoderm: human (21) versus mouse (14) | 3 764 211 | 799 602 (21%) |
| (n = 124) | Primitive streak: human (52) versus mouse (37) | 1 267 793 | 195 243 (15%) |
Note: Co-expression of gene pairs are compared across species-tissue groups. Species are human and mouse. Tissue types are either ectoderm or primitive streak-derived. Sample sizes for each group are given inside parentheses. Significantly co-expressed gene pairs are the union of such pairs from both groups being compared, with P < 0.1 and Cramér’s V > 0.8. Significantly second-order differential pairs with BH adjusted P < 0.05 and , obtained by the Sharma–Song test, are reported by total number and percentage among significant co-expression pairs. All P-values are BH adjusted for multiple testing.
3.1.1 Results from the FANTOM5 CAGE collection
In each comparison, all 9757 × 9757 co-expression patterns were evaluated to build a condition-specific co-expression network including significant patterns from either species-tissue group. Then we used the Sharma–Song test with BH adjusted P < 0.05 and to report numbers of second-order differential patterns (Fig. 2). We found higher percentages of second-order differences across tissue groups within human (22%) and also across tissue groups within mouse (14%), but lower percentages of second-order differences across species within the primitive streak tissue group (8%) and across species within the ectoderm tissue group (12%). Four second-order differential gene pairs are shown for their rich nonlinear diversity in Figure 3a, d, g and j, indicating potentially rewired molecular mechanisms.
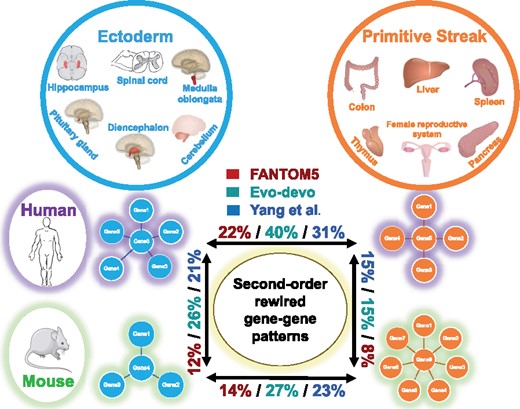
Second-order gene network rewiring is more frequent between tissue groups than between human and mouse on FANTOM5, Evo-devo and Yang et al. datasets. Tissue types are grouped by the developmental origin of either ectoderm or primitive streak. Tissue group comparisons within species (horizontal) reveal high percentages of second-order differential patterns within both human (22%, 40%, 31%) and mouse (14%, 27%, 23%). In contrast, the same tissue group across species (vertical) shows low percentages of second-order differential patterns for both ectoderm-derived tissues (12%, 26%, 21%) and primitive streak-derived tissues (8%, 15%, 15%). The mouse image adapted for the figure is licensed under Creative Commons Attribution 3.0 unported. It is attributed to Les Laboratoires Servier, and the original version can be found at https://smart.servier.com/smart_image/mouse/. The human and organ images are licensed under Creative Common 1.0 Universal Public Domain Dedication, attributed to https://commons.wikimedia.org/
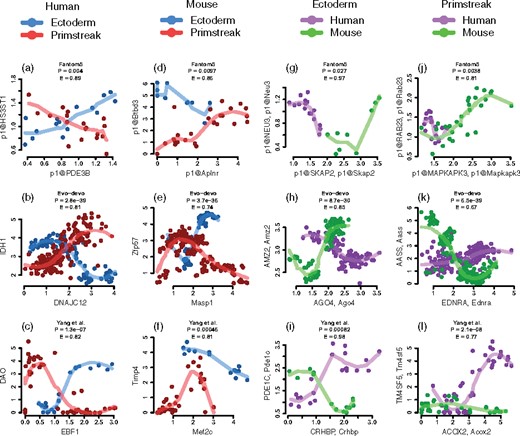
Diverse second-order differential gene co-expression patterns between tissue groups and across species reported by the Sharma–Song test. Each plot represents a gene pair common to human and mouse. (a–c) Between human ectoderm- and primitive streak-derived tissue groups. (a) FANTOM5: p1@PDE3B–p1@HS3ST1, (b) Evo-devo: DNAJC12–IDH1, (c) Yang et al.: EBF1–DAO. (d–f) Between mouse ectoderm- and primitive streak-derived tissue groups. (d) FANTOM5: p1@Aplnr–p1@Btbd3, (e) Evo-devo: Masp1–Zfp57, (f) Yang et al.: Mef2c–Timp4. (g–i) Between human and mouse ectoderm-derived tissue groups. (g) FANTOM5: p1@Skap2, p1@SKAP2–p1@Neu3, p1@NEU3. (h) Evo-devo: Ago4, AGO4–Amz2, AMZ2. (i) Yang et al.: Crhbp, CRHBP–Pde1c, PDE1C. (j–l) Between human and mouse primitive streak-derived tissue groups. (j) FANTOM5: p1@Mapkapk3, p1@MAPKAPK3–p1@Rab23, p1@RAB23 (k) Evo-devo: Ednra, EDNRA–Aass, AASS. (l) Yang et al.: Acox2, ACOX2–Tm4sf5, TM4SF5
3.1.2 Results from the Evo-devo RNA-seq collection
In each comparison, all 13 307 × 13 307 co-expression patterns were evaluated to build a condition-specific co-expression network including significant patterns from either species-tissue group. Table 2 reports second-order differential pattern percentages by the Sharma–Song test with BH adjusted P < 0.05 and . We also found higher percentages of second-order differences across tissue groups within human (40%) and also across tissue groups within mouse (27%), but lower percentages of second-order differences across species within the primitive streak tissue group (15%) and across species within the ectoderm tissue group (26%). Four second-order differential gene pairs are shown in Figure 3b, e, h and k.
3.1.3 Results from the Yang et al. RNA-seq collection
In each comparison, all 13 909 × 13 909 co-expression patterns were evaluated to build a condition-specific co-expression network including significant patterns from either species-tissue group. Table 2 reports second-order differential pattern percentages by the Sharma–Song test using BH adjusted P < 0.05 and . We again found higher percentages of second-order differences across tissue groups within human (31%) and also across tissue groups within mouse (23%), but lower percentages of second-order differences across species within the primitive streak tissue group (15%) and across species within the ectoderm tissue group (21%). Four second-order differential gene pairs are shown in Figure 3c, f, i and l.
3.2 Reproducible second-order differential interactions across all three datasets
Despite differences in sample source, sample size and sequencing technology, we observe some level of reproducibility of second-order differential interactions across the three datasets. We found that the strongest 20-percentile group of second-order differential interactions contains the largest numbers of common high-degree hub genes between Evo-devo and Yang et al. collections in all four comparisons as shown in Supplementary Material E. Figure 4 showcases four gene pairs with consistent patterns across all three collections. A complete list is provided in four tables in Supplementary Material F. In Figure 4a, CACNA1A, a gene involved in the production of instructions for creating calcium channel for regulating communication between neurons (Auvin et al., 2009) is positively co-expressed with P2RX4 in human ectoderm tissue group—the latter is a purinergic receptor highly expressed in central and peripheral neurons, whereas the pair is negatively co-expressed in the primitive streak tissue group. P2X4 encoded by P2RX4 mediates Ca2+ channels and neuropathic pain (Ozaki et al., 2016; Suurväli et al., 2017; Xu et al., 2016). Both CACNA1A and P2RX4 belong to the calcium signaling pathway (hsa04020) (Kanehisa and Goto, 2000), which plays a crucial role during development. Defects in this pathway could lead to diseases like epilepsy and cardiac malformations (Paudel et al., 2018). In Figure 4b, gene RELN is critical for cerebral cortical development as it regulates neuronal migration (Chang et al., 2007), positively co-expressed in mouse ectoderm with PIK3R3, a phosphoinositide 3-kinase gene encoding the PI3K enzyme with function in neurotransmitter-regulated neuronal signaling (Gross and Bassell, 2014), whereas the pair is negatively co-expressed in the primitive streak tissue group. Both RELN and PIK3R3 are involved in the PI3K-Akt signaling pathway (Kanehisa and Goto, 2000). The PI3K-Akt-MtoR signaling pathway regulates cellular processes like cell growth, proliferation, autophagy and apoptosis, important for neurodevelopment (Wang et al., 2017).
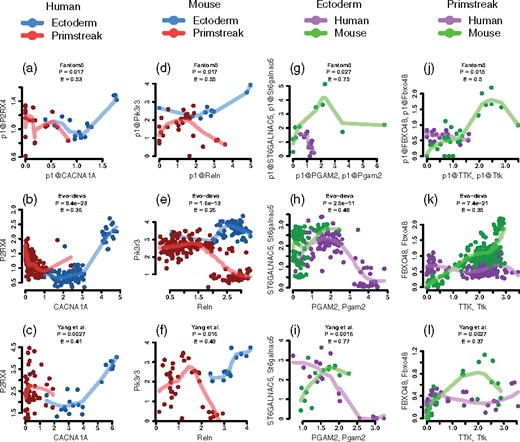
Reproducible second-order differential patterns across all three datasets. Each plot represents a second-order differential pattern between two genes common to human and mouse. (a–c) Reproducible second-order differential patterns of CACNA1A–P2RX4 between human ectoderm-derived tissue group and primitive streak-derived tissue group. (d–f) Reproducible second-order differential patterns of Reln–Pik3r3 between mouse ectoderm-derived tissue group and primitive streak-derived tissue group. (g–i) Reproducible second-order differential patterns of Pgam2–St6galnac5 from the three datasets between human and mouse ectoderm-derived tissue groups. (j–l) Reproducible second-order differential patterns of Ttk–Fbxo48 between human and mouse primitive streak-derived tissue groups
3.3 Pathways enriched with genes in second-order differential interactions across all three datasets
We found pathways that are highly enriched in genes involved in second-order rewired gene interactions in all four species-tissue comparisons. From second-order differential patterns of each comparison, we selected from all three datasets common genes to perform SIGORA pathway analysis (Foroushani et al., 2013). Human ectoderm versus primitive streak comparison: We found 4599 common genes among all the three datasets and 56 enriched pathways (Supplementary Material G.1 Table S5) post-Bonferroni correction (Dunnett, 1955). Mouse ectoderm versus primitive streak comparison: We found 7345 common genes enriching 89 pathways (Supplementary Material G.2 Table S6). Human versus mouse ectoderm comparison: We found 7037 coinciding genes enriching 23 pathways (Supplementary Material G.3 Table S7) that were common in both human and mouse. For these three comparisons, the most enriched include MAPK signaling (hsa04010), axon guidance (hsa04360), Wnt signaling (hsa04310) and Hippo signaling (hsa04390) pathways, all having a major role in development. MAPK signaling is involved in cell proliferation, differentiation and migration; it also activates the JNK pathway essential for embryonic development (Maekawa et al., 2005; Zhang and Liu, 2002). Axon guidance is related to neural development, the process by which an axon reaches its targets and leads to neural circuit (Stoeckli, 2018). Wnt signaling is crucial for stem cell proliferation and differentiation during embryo genesis and adult tissue homeostasis (Steinhart and Angers, 2018). Hippo signaling controls the organ size and also regulates tissue homeostasis during development (Pan, 2010). Human versus mouse primitive streak comparison: We found 3357 coinciding genes enriching six pathways (Supplementary Material G.4 Table S8) common between human and mouse. The top pathways are axon guidance (hsa04360) and cell cycle (hsa04110). Cell cycles are closely coupled with cellular differentiation where developmental signals often determine a cell cycle mode specific to cell type (Jakoby and Schnittger, 2004), subject to tissue-specific rewiring. For example, in some brain regions, the orientation of granule cell precursor division can determine the production of more granule cell precursors or granule cells (Miyashita et al., 2017).
3.4 Detecting rewired miRNA-gene patterns between developing mouse cerebellum and liver
To evaluate if the Sharma–Song test can return second-order differential patterns that are biologically relevant, we scrutinized network rewiring between developing mouse cerebellum and liver. Both tissue types have vast literature to provide a basis for biological justification of our methodology development. They also have relatively large sample sizes, long time courses and rich dynamic in the FANTOM5 mouse data. After preprocessing (Supplementary Material H.1), we obtain 12 937 TSSs and 502 pri-miRNAs for 36 cerebellar samples and 15 liver samples.
Using the second-order network rewiring pipeline, we evaluated 502 × 12 937 gene pairs to find 20 577 co-expressed patterns in cerebellum and 197 347 in liver. A union of 216 709 unique patterns were supplied to the Sharma–Song test that returned 42 352 significant (BH adjusted P < 0.05 and ) second-order differential patterns, five of which are shown in Supplementary Material H.1 Figure S2. Tpx2 and Ctnna1 are positively co-expressed in the cerebellum whereas negatively co-expressed in the liver. mmu-miR-5622-5p promoted by Tpx2 targets Ctnna1. Ctnna1 is important to the Hippo and cancer pathways (Vlachos et al., 2015) by inhibiting Yap1, which in high concentration disrupts the Hippo pathway and can result in cancer (Herr et al., 2014; Silvis et al., 2011). Tpx2, hosting mmu-miR-5622-5p, is over-expressed in liver cancer and promotes its growth (Hsu et al., 2017). We observe a strong negative relationship between Ctnna1 and Tpx2 in liver, lung, heart and kidney, which can be interpreted as Tpx2 or mmu-miR-5622-5p suppressing Ctnna1. In the cerebellum, however, the relationship is rewired so that Ctnna1 is promoted by Tpx2, opposite to other tissue types. Using 5888 unique TSSs from second-order differential interactions, we performed SIGORA (Foroushani et al., 2013) analysis to obtain 12 enriched pathways (Supplementary Material H.2) post-Bonferroni correction (Dunnett, 1955). The top pathways of spliceosome (mmu03040), RNA-transport (mmu03013) and cell cycle (mmu04110) are all ubiquitous in development (Supplementary Material H.2). Applying our method on the topology of the spliceosome pathway (mmu03040), we created a second-order rewired spliceosome network between developing cerebellum and liver (Supplementary Material H.3).
3.5 Benchmarking the Sharma–Song test
We conducted simulation studies to verify the performance of the Sharma–Song test in identifying second-order differential patterns in contrast to three other methods: differential Pearson’s correlation (Hu et al., 2009; Leonardson et al., 2010; Mentzen et al., 2009), a Z-score on scaled differential Spearman’s correlation from DGCA (McKenzie et al., 2016) and the chi-squared heterogeneity test (Zar, 2009). We measured their performance by receiver operating characteristic (ROC) curves.
We designed three algorithms to generate 500 first-, 500 second- and 500 full-order differential table tuples. The algorithms are implemented as options in the simulate_diff_tables function from the ‘DiffXTables’ R package (Sharma and Song, 2020). Each tuple contains two tables (K = 2). Each table contains a random number of points from 100 to 300. We applied noise at levels of 0.0, 0.1, 0.2, 0.3, 0.4 and 0.5 to the tables. Figure 5 shows ROC curves with area under ROC (AUROC) for each method. In the first setup, each method detects second- from first-order differential patterns. In the second setup, full-order patterns are detected from first-order patterns. With increasing differentiality across tables, the performance of all methods also increases as one would expect. At noise levels of 0.0 and 0.1, the Sharma–Song test is ∼10–20% better than differential correlation and DGCA, and 5% better than the heterogeneity test. At noise level 0.4, all methods amount to random guessing. Supplementary Material I benchmarked the methods for K = 3 conditions with similar results, confirming the heterogeneity test being unspecific to second-order, differential correlation not recognizing differences in complex nonlinear patterns, and the Sharma–Song test being most effective.
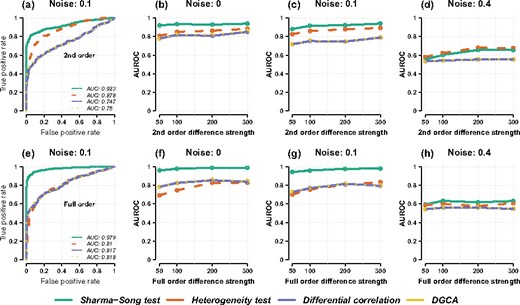
Benchmarking the Sharma–Song test and three other methods. The top row is for detecting second- from first-order differential patterns: (a) ROC curve at noise level 0.1. (b–d) AUROC as a function of second-order difference at three noise levels (0, 0.1, 0.4). The bottom row is for detecting full- from first-order differential patterns: (e) ROC curve at noise level 0.1. (f–h) AUROC as a function of full-order difference at noise levels 0, 0.1, 0.4
3.6 The statistical power of Sharma–Song test
We studied the statistical power of Sharma–Song test in relation to sample size, given false positive rate, effect size and table size. The result is shown as Supplementary Material J Figure S6. The false positive rate was fixed at 0.05. The 60%-power effect size was given as 0.235. Three table sizes of 3 × 3, 4 × 4 and 5 × 5 were evaluated.
At a smaller sample size, the test can achieve a greater statistical power on table pairs of smaller sizes than larger sizes. At a larger sample size, the relation is reversed. To attain a power level of ∼60%, the required sample size for all table sizes is 12 for each table in the pair. Full details are given in Supplementary Material J.
4 Discussion
Lin et al. (2014) reported that the difference in genetic landscape between distinct tissues types is underwhelming compared to that between species. Their conclusions are concerned with first-order differences in transcript abundance based on their own data and ENCODE Project Consortium (2004) data. The Sharma–Song test is designed to capture second-order differential patterns, offering an orthogonal perspective complementary to first-order analysis. The persistence of second-order effects neither proves nor disproves first-order effects. On three independent mammalian development transcriptome collections, we exclusively looked for second-order differential patterns by comparing tissue types with different germ-line lineage within human and mouse and across the two species. Not in the same analogy to Lin et al. (2014), we find on all three datasets that second-order differences between tissues of distinct origins are higher than those from same tissue but between distinct species, hinting at tissue-specific circuitry being conserved across mammals.
We studied co-expression patterns that are second-order rewired across tissue groups derived from different development origin but conserved within each group of heterogeneous tissue types from the same development origin. Grouping by origin was due to limited sample availability for each homogeneous tissue type in two of the three collections. We do expect second-order differential co-expression patterns to arise between heart and liver tissues, for example, both developed from the primitive streak.
Shifted and scaled patterns can arise either from truly rewired dynamical systems, or from artifacts due to batch or library size effects. In our studies, we separately scaled and shifted the continuous data in each condition. Although we may have demoted shifted or scaled patterns, such preprocessing makes our analysis robust to unwanted confounding effects.
The Sharma–Song test is applicable to a network topology generated by other network inference tools. On a given network with data observed under multiple conditions, we can ask whether an edge carries any second-order change across conditions. On a directed network, we can test whether a many-to-one interaction from parents to their child has rewired in the second order. Here, we can collapse all parent nodes into a single compound node and then apply the test on the table formed by the compound node and the child node.
As high-throughput biology experiments are generating data with increasing cellular, temporal and spatial resolutions, we expect that the second-order network rewiring instrument offered here will be useful in characterizing fundamental biological circuitry changes due to evolution, environment or disease.
Data availability
The generic SharmaSong test is available from the R package ‘DiffXTables’ at https://cran.r-project.org/package=DiffXTables. Code and data for the reported results are available for download at https://www.cs.nmsu.edu/~joemsong/rewiring/.
Funding
This work was partially supported by the National Science Foundation [1661331] and USDA [2016-51181-25408].
Conflict of Interest: none declared.

