


Abstract
Proteasomal cleavage is a key component in protein turnover, as well as antigen processing and presentation. Although tools for proteasomal cleavage prediction are available, they vary widely in their performance, options and availability.
Herein, we present pepsickle, an open-source tool for proteasomal cleavage prediction with better in vivo prediction performance (area under the curve) and computational speed than current models available in the field and with the ability to predict sites based on both constitutive and immunoproteasome profiles. Post hoc filtering of predicted patient neoepitopes using pepsickle significantly enriches for immune-responsive epitopes and may improve current epitope prediction and vaccine development pipelines.
pepsickle is open source and available at https://github.com/pdxgx/pepsickle.
Supplementary data are available at Bioinformatics online.
1 Introduction
The constitutive proteasome is a multimeric protein complex best known for its role in the cleavage and recycling of cellular proteins marked for degradation (Ciechanover, 1994). The proteasome also generates cleaved peptide fragments (epitopes) for immune surveillance via the major histocompatibility complex (MHC) class I antigen presentation pathway (Kloetzel and Ossendorp, 2004). This immune presentation functionality is critical for antiviral and other antimicrobial responses, and has particular relevance both in the setting of vaccine development and in a cancer context with the advent of immune checkpoint inhibitors (Carretero et al., 2012; Ostrand-Rosenberg, 1994; Pardi et al., 2018; Ribas and Wolchok, 2018; Sijts and Kloetzel, 2011).
Structurally, the proteasome consists of multiple subunits, a 20S barrel core housing the catalytic domains of the proteasome, and two 19S caps which aid in the unfolding of ubiquitin-tagged proteins (Ciechanover, 1994). The barrel shape of the 20S core is derived from the fusion of four heptameric rings, the inner two of which contain a β1, β2 and β5 catalytic domain responsible for the cleavage of peptide bonds (Adams, 2003). Although all tissues express the constitutive proteasome, hematopoietic-lineage cells can also express the alternative catalytic domains β1i, β2i and β5i in response to IFN-γ, which replace their analogues in the constitutive heptameric ring to form the immunoproteasome (Fig. 1) (Budenholzer et al., 2017). Previous studies support the presence of preferred cleavage motifs and differences in cleavage preferences between the immuno- and constitutive proteasomes; however, our understanding of how these preferences manifest is still not well defined (Nielsen et al., 2005; Fort et al., 2015).
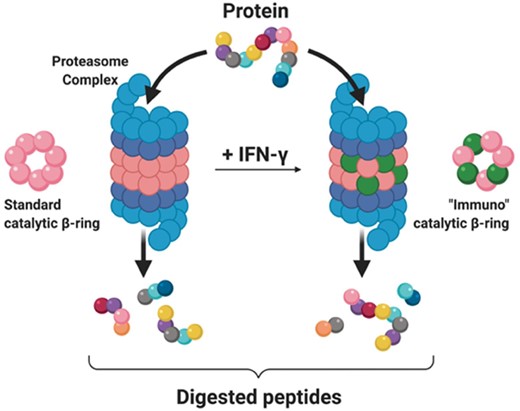
Protein degradation by the constitutive and immunoproteasome. Proteins trafficked to the proteasome complex are fed into the main 20S barrel, with the assistance of 19S caps (blue) that aid with unfolding and linearization. The catalytic domains of the standard -rings (pink) constituting the 20S barrel cleave the protein sequence and generate the resulting digested peptide fragments. In select tissues, exposure to interferon gamma (IFN-) results in replacement of the standard catalytic domains by alternative ‘immuno’ catalytic domains (green). This transition in catalytic domain usage constitutes the construction of the immunoproteasome and may alter cleavage site preference. The differential digestion pattern of a single protein sequence (multi-colored) is depicted below the corresponding proteasome complex
While existing tools to predict proteasomal cleavage sites are now widely adopted, each has significant limitations affecting the accuracy and/or scope of its predictions, with the potential for real world consequences (Fig. 2). For example NetChop 3.1, the most cited proteasomal cleavage tool, does not differentiate between constitutive and immunoproteasomal cleavage when generating predictions (Nielsen et al., 2005). Further, tools such as the proteasomal cleavage prediction server (PCPS) provide options for predicting cleavage by the immunoproteasome but show poor model performance compared to NetChop when benchmarked (Nielsen et al., 2005). Finally, many available tools are either proprietary or otherwise unavailable to the public, complicating their use in both academic and industry analysis pipelines.
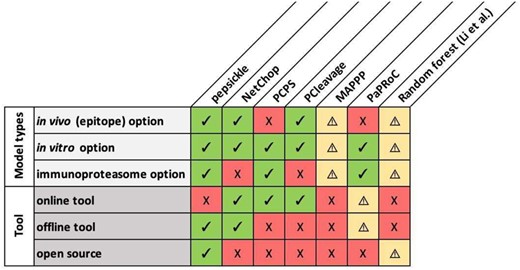
Comparison matrix of available proteasomal cleavage tools and their features. Eight proteasomal cleavage tools are shown (columns) along with their corresponding features (rows). Specific tools are as follows: pepsickle (presented here), NetChop 3.1 (Nielsen et al., 2005), the Proteasomal Cleavage Prediction Server (PCPS) (Gomez-Perosanz et al., 2020), PCleavage (Bhasin and Raghava, 2005), MAPPP (Holzhütter and Kloetzel, 2000), PAProC (Nussbaum et al., 2001) and the random forest-based model described in Li et al. (2012) Check marks (green) represent available features for each tool while X’s (red) represent unavailable features. Warning signs (yellow) represent missing information, or features that are mentioned but not currently available. For MAPPP, the referenced web server is no longer available and therefore we were unable to confirm tool features. For PaPRoC, we were unable to obtain the model despite repeated requests. For the random forest model proposed by Li et al., model weights for the proposed model are given, but source code is not available and the type of cleavage sites used (in vivo versus in vitro) are undefined
By leveraging a comprehensive set of proteasomal cleavage data and an ensemble-based deep learning approach, we developed a set of models that consistently produce more accurate cleavage predictions than existing tools regardless of proteasomal context. We have deployed these models as an open-source command-line tool (pepsickle) for broad reuse and application.
2 Materials and methods
2.1 Collection and processing of in vitro digestion map data for training and testing
We performed a literature search for all studies containing publicly available primary data from in vitro digestion experiments using 20S proteasomes. As the proteasome is highly conserved among mammalian species, digestion product results from non-human mammalian proteasomes were also included along with human-specific datasets (Fort et al., 2015; Tomko and Hochstrasser, 2013). The search terms used were ‘proteasome’, ‘proteasomal’, ‘cleavage’, ‘digestion’, ‘immunoproteasome’, ‘20S’, ‘i20S’, both alone and in various combinations. Ultimately, we identified 35 studies with relevant data (Table 1), from which we manually extracted individual cleavage sites, along with the parent peptide sequences from which they were derived (Alvarez-Castelao et al., 2012; 2014; Asemissen et al., 2006; Ayyoub et al., 2002; Berko et al., 2012; Bruder et al., 2006; Chapiro et al., 2006; Dick et al., 1996; Ehring et al., 1996; Emmerich et al., 2000; García-Medel et al., 2012; Guillaume et al., 2012; Hassainya et al., 2005; Kessler et al., 2001; Kimura et al., 2005; Lucchiari-Hartz et al., 2000; 2003; Macconi et al., 2009; Marcilla et al., 2007; Michaux et al., 2014; Morel et al., 2000; Niedermann et al., 1995; 1996; Paradela et al., 2000; Pinkse et al., 2005; Popović et al., 2011; Sesma et al., 2003; Strehl et al., 2008; Tenzer et al., 2004; Theobald et al., 1998; Toes et al., 2001; Vigneron et al., 2004; Wada et al., 2018; Warren et al., 2006; Zimbwa et al., 2007). Proteasome types present in the observed system (constitutive, immunoproteasome or mixed) were also annotated for each cleavage experiment. Data from six 20S studies with unique source proteins were held out for downstream validation, while the remaining data (from 29 studies) were aggregated for model training and testing (Table 1). For in vitro digestion peptide fragments, both the N-terminal and C-terminal cleavage sites were used as cleavage examples. For each cleavage example, a context window was generated with the cleavage residue (C-terminus of the peptide fragment) as the ‘central’ amino acid plus an equal number of upstream and downstream amino acids (Fig. 3). Independent datasets with window sizes of 7 amino acids (3 upstream and 3 downstream from the central cleavage residue) and 21 amino acids (10 upstream and 10 downstream) were generated to allow for model optimization based on window size. Only unique cleavage windows were retained, yielding a total of 1758 windows that are 7 amino acids in length and 1819 windows that are 21 amino acids in length.
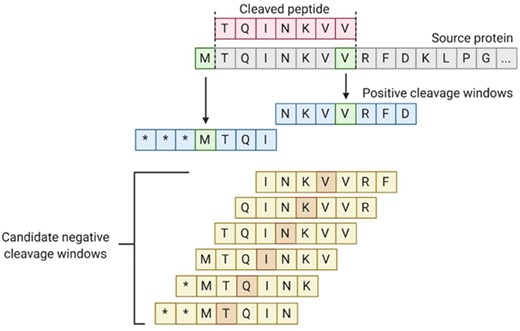
Generation of the in vitro dataset. Each identified cleaved peptide fragment (red) was mapped back to its source sequence (gray). Using the C-terminus of the fragment, as well as the amino acid prior to the N-terminus of the fragment as cleavage sites (green, with each of their respective downstream bonds cleaved by the proteasome), cleavage windows (blue) were generated using three amino acids upstream and downstream of the cleavage sites identified. Candidate non-cleavage windows (yellow) were generated using the same windowed approach on internal amino acids within the epitope. Before candidate negatives were included in the dataset, they were screened against all positive identified cleavage sites from both N- and C-termini of reported fragments. Note that * indicates the lack of an amino acid (i.e. amino acid position is beyond the peptide terminus)
Summary of in vitro data
| Source | Dataset | Fragments | Proteasome types |
|---|---|---|---|
| Toes et al. (2001) | Train/test | 251 (1) | Constitutive, Immuno |
| Berko et al. (2012) | Train/test | 236 (2) | Constitutive |
| Sesma et al. (2003) | Train/test | 184 (4) | Mixed |
| Lucchiari-Hartz et al. (2003) | Train/test | 145 (1) | Mixed |
| Tenzer et al. (2004) | Train/test | 129 (1) | Constitutive, Immuno |
| García-Medel et al. (2012) | Train/test | 121 (1) | Constitutive |
| Guillaume et al. (2012) | Train/test | 103 (10) | Constitutive, Immuno |
| Chapiro et al. (2006) | Train/test | 96 (3) | Constitutive, Immuno |
| Niedermann et al. (1996) | Train/test | 91 (3) | Mixed |
| Ehring et al. (1996) | Train/test | 84 (1) | Mixed |
| Pinkse et al. (2005) | Train/test | 81 (2) | Constitutive, Immuno |
| Emmerich et al. (2000) | Train/test | 63 (1) | Constitutive |
| Niedermann et al. (1995) | Train/test | 56 (8) | Immuno |
| Kessler et al. (2001) | Train/test | 47 (4) | Immuno |
| Hassainya et al. (2005) | Train/test | 35 (1) | Immuno |
| Paradela et al. (2000) | Train/test | 34 (1) | Mixed |
| Lucchiari-Hartz et al. (2000) | Train/test | 30 (1) | Constitutive |
| Theobald et al. (1998) | Train/test | 24 (2) | Immuno |
| Popović et al. (2011) | Train/test | 23 (2) | Immuno |
| Alvarez-Castelao et al. (2014) | Train/test | 22 (1) | Constitutive |
| Marcilla et al. (2007) | Train/test | 21 (1) | Immuno |
| Dick et al. (1996) | Train/test | 20 (3) | Mixed |
| Bruder et al. (2006) | Train/test | 18 (2) | Constitutive |
| Morel et al. (2000) | Train/test | 17 (1) | Constitutive, Immuno |
| Asemissen et al. (2006) | Train/test | 14 (1) | Constitutive, Immuno |
| Michaux et al. (2014) | Train/test | 13 (1) | Constitutive |
| Macconi et al. (2009) | Train/test | 12 (1) | Constitutive |
| Kimura et al. (2005) | Train/test | 8 (2) | Mixed |
| Vigneron et al. (2004) | Train/test | 6 (1) | Constitutive |
| Wada et al. (2018) | Validation | 334 (11) | Immuno |
| Ayyoub et al. (2002) | Validation | 49 (1) | Constitutive |
| Zimbwa et al. (2007) | Validation | 48 (1) | Immuno |
| Alvarez-Castelao et al. (2012) | Validation | 32 (1) | Constitutive |
| Strehl et al. (2008) | Validation | 16 (4) | Constitutive, Immuno |
| Warren et al. (2006) | Validation | 16 (1) | Immuno |
Note: All data used for training, testing and validating in vitro models is summarized above. Fragments represent the number of cleavage by-products reported in each primary literature source, with the number in parentheses representing the number of whole proteins or pre-digestion protein fragments used in each study. Proteasome type(s) denotes what proteasome was queried during experimentation with ‘constitutive’ and/or ‘immuno’ denoting isolated contexts, while ‘mixed’ denotes testing in a non-isolated/heterogenous proteasomal context.
To generate companion non-cleavage examples for modeling, internal sites from each reported peptide fragment were considered as candidates. As above, 7 amino acid and 21 amino acid windows were generated for each non-cleavage example, and subsequently filtered to remove any duplicate sequences or overlaps with the set of non-cleavage examples. Before these candidates were included as null examples in the dataset, they were further filtered against all positive windows generated across all other studies, controlling for proteasome type, so that positive and negative cleavage examples were mutually exclusive.
2.2 Collection and processing of epitope data for training and testing
To study in vivo cleavage sites, we extracted endogenously processed T-cell epitopes from three independent public databases [The Immune Epitope Database (IEDB) (Vita et al., 2019), AntiJen (McSparron et al., 2003) and SYFPEITHI (Rammensee et al., 1999)] as well as two primary literature sources: Bassani-Sternberg et al. (2016) and Rozanov et al. (2018). Data from Bassani-Sternberg et al. was maintained separately and used for downstream validation, while all other sources were aggregated for training and testing purposes. We restricted attention to mammalian endogenously processed and presented peptide ligands of the MHC class I pathway using the flags: ‘assay_type.category’ = ‘Naturally Processed’, ‘mhc_allele_restriction.class’ = ‘I’ and ‘organism_finder_host_ancestry.obi_id’ = ‘http://purl.obolibrary.org/obo/NCBITaxon_40674’. Epitopes were filtered to retain only those with an unambiguous position among the known source protein sequence(s). Centered windows were generated around each C-terminal cleavage example as above, but using the full series of balanced window sizes from 7 amino acids to 21 amino acids, given the larger scale of the data and its accompanying power to detect significant differences in model performance. Only unique cleavage window sequences were retained, resulting in a total of 357 253 unique epitopes with C-terminal cleavage events. Note that epitope N-termini were not processed as cleavage examples due to the uncertainty resulting from N-terminal trimming by endoplasmic reticulum aminopeptidases (ERAP) (Evnouchidou and van Endert, 2019).
To perform non-cleavage site inference, we first sampled internal amino acids for each epitope (Fig. 4). Because the overwhelming majority of proteasomal digestion products have a length of at least two amino acids (Kisselev et al., 1999; Köhler et al., 2001; Nussbaum et al., 1998) and because peptides may be threaded into the proteasome in either the N- or C-terminal directions (Berko et al., 2012), we excluded 1 N-terminal and 1 C-terminal amino acid residue of each epitope from consideration in the potential non-cleavage data. As above, windows were generated for each remaining amino acid position for each potential window size. These potential non-cleavage windows were then filtered to remove any identical sequence matches within the set of positive cleavage examples from above. To additionally account for uncertainty in N-terminal cleavage position(s) due to ERAP (Evnouchidou and van Endert, 2019), we removed any candidate sequence that matched with the set of windows generated by upstream positions from the N-terminus of an epitope up to 16 amino acids upstream of each epitope’s C-terminus. Only unique non-cleavage window sequences were retained.
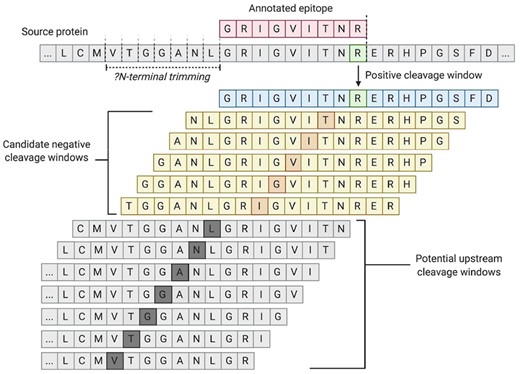
Generation of the epitope dataset. Each identified epitope (red) was mapped back to its source sequence. Using the C-terminus of the epitope as the cleavage site (green), with the downstream bond as the one cleaved by the proteasome), cleavage windows (blue) were generated using eight amino acids up and downstream from the site identified. Candidate non-cleavage windows (yellow) were generated using the same windowed approach on internal amino acids within the epitope, with the exclusion of the first two and last two amino acids which served as a buffer region to account for minimum proteasomal fragment size. Before candidate negatives were included in the dataset, they were screened against all positive identified cleavage sites as well as against a set of potential upstream cleavage sites (gray); generated by using the same windowed approach on the upstream window that could encapsulate the N-terminal cleavage site prior to ERAP trimming
2.3 Feature encoding
A vector of features was generated for each amino acid across windows in the cleavage and non-cleavage example sets (Supplementary Table S1). Amino acid identity was one-hot encoded as a bit vector of size 20, with each bit representing one of the standard amino acids. The null character (*) was used for padding, with all values as zero, while ambiguous amino acids were encoded as relevant combinations of non-zero values corresponding to their ambiguous components (e.g. B represents either aspartic acid or asparagine). Physical properties of amino acids were encoded as follows: side chain polarity was recorded as its isoelectric point (pI) (Lide, 1992), the molecular volume of each side chain was recorded as its partial molar volume at 37°C (Häckel et al., 1999), the hydrophobicity of each side chain was characterized by its simulated contact angle with nanodroplets of water (Zhu et al., 2016) and conformational entropy was derived from peptide bond angular observations among protein sequences without observed secondary structure (e.g. alpha helix) (Fogolari et al., 2015). Proteasomal context was also included where relevant as a single categorical feature with ‘C’ representing the constitutive proteasome, ‘I’ representing the immunoproteasome and ‘M’ representing mixed systems with both proteasome types expressed.
2.4 Gradient boosted decision tree structure and training
All gradient boosted classification models were implemented using the Scikit-learn package (v0.22.1) (Pedregosa et al., 2011) for Python version 3.7. The aggregated positive and negative cleavage examples were randomly split to retain 80% of the examples for training and the remaining 20% for model testing. For each model, inversely balanced class weights were used, and the ‘RandomizedSearchCV’ class was used to determine the best option for the ‘max_features’ parameter (chosen from ‘auto’, ‘sqrt’ or ‘log2’) and the ‘n_estimators’ parameter (chosen from values of 100–1000, by 100) of the ‘GradientBoostingClassifier’ class. Randomized 10-fold cross validation was run for all combinations of parameters, and the best model (as determined by the ‘best_estimator_’ attribute) was retained. Model performance was evaluated based on Area under the curve (AUC), using the pROC library (v1.16.2) (Robin et al., 2011) in R version 4.0.2.
Two distinct classification models were trained. One was based on the one hot encoded amino acid sequence identities, and another on the physical/chemical property encodings as previously described, normalized using the ‘fit_transform’ method of Scikit-learn’s ‘MinMaxScaler’ class. For epitope data, models were trained on amino acid window sizes 7 through 21 in length and compared to each other to identify the model with optimal performance. For in vitro data, only the minimum (7) and maximum (21) length window libraries were assessed, also accounting for constitutive versus immunoproteasomal context.
2.5 Neural network structure and training
All neural network models were implemented using the PyTorch package (version 1.3.1) (Paszke et al., 2019) for Python version 3.7. The aggregated positive and negative cleavage examples were randomly split to retain 80% of the examples for training and the remaining 20% for model testing. We next trained two distinct cleavage classification models based on the proteasome type and either (i) amino acid identity encodings, or (ii) amino acid physical property encodings as described previously. Each model consisted of an input layer, two hidden layers and an output layer (Supplementary Fig. S1). For all non-output layers, we applied batch normalization and a 20% dropout layer during each successive forward pass to improve model training and reduce overfitting (for layer sizes, see Supplementary Tables S2 and S3, respectively). ReLU activation functions were employed at each step except for the output layer, where a softmax function was applied prior to final output. For the physical property-based model an additional convolutional layer (1D convolution with a three amino acid window and one amino acid step size) was applied to each physical property independently prior to passing values to the rest of the model. Cross entropy loss was used for backpropagation during training, with inverse class weights to account for class imbalance in the training set. Both models were trained for 36 epochs before training was halted. AUC assessed on a new subset of the test data after each epoch and compared to the performance at the previous epoch, with the best performing model saved for downstream analysis.
For the two best-performing models (one identity-based and one based on physical properties), final testing performance was then assessed using a consensus approach, where the predicted probability of a test window representing a cleavage site was taken as the average probability across both models. For epitope data, models were trained on window sizes of 7 through 21 amino acids and subsequently compared to identify the window size with optimal performance. Due to the relatively small size of the in vitro dataset, only the minimum (7) and maximum (21) length window libraries were assessed, with additional information on constitutive versus immunoproteasomal context included as in the same manner used for the gradient boosted approach.
2.6 Analysis of sampled feature space
Because models were studied using variable window lengths up to 21 amino acids, we evaluated all data in a unified feature space, noting that the largest feature space would be guaranteed to provide the most robust assessment across all window lengths. To qualitatively assess how well our training data represented the broader space of possible peptides, we therefore identified all unique 21 amino acid windows within the human proteome (https://www.uniprot.org/proteomes/UP000005640). Using these windows as background, we compared the shared UMAP space calculated with the first 10 principal components across the human proteome, as well as both in vitro and in vivo training sets using the four chemical properties at each amino acid position within the window, described previously, as the input feature set (Fig. 5). Furthermore, we compared the sampling density for both datasets to the human background set across the first 4 principal components to demonstrate the distribution of sampling in our training sets (Supplementary Fig. S2). In addition to plots comparing the sampling space based on chemical properties, we also generated logo plots based on the amino acid frequencies for positive and negative examples in each training set (Supplementary Figs S3 and S4). These plots were generated using the ultimate window sizes retained in modeling; 7 amino acids for in vitro data and 17 amino acids for in vivo data.
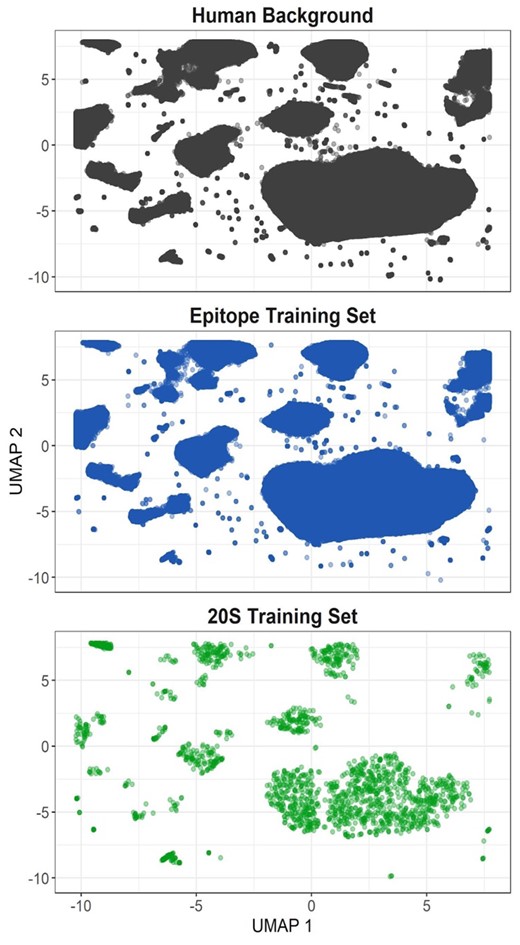
Training set projections in UMAP space. Amino acid windows (21 residues long) were generated for the whole human proteome (gray), all epitope training examples (blue) and all 20S training examples (green). Principle components were generated from the physical properties of each amino acid at each window position. UMAP projections were generated from the first 10 principal components
2.7 Collection and processing of in vitro digestion map data for validation
Data from six 20S studies was held out from previous steps to be used in validation. In order to accommodate the analysis of performance for models using multiple different window sizes, window lengths of 21 amino acids were generated for each validation set cleavage example using reported peptide fragments and their source protein contexts. Companion non-cleavage windows were generated in the same way as before, with the exception that only one internal site was sampled at random during non-cleavage window generation to create an initially balanced set of positives and negatives. For validation windows, the additional step of filtering all validation windows with a non-unique interior window of 7 amino acids (smallest centered window size for the models to be assessed) was also taken to ensure no redundant windows were present in the validation set for any training window sizes from 7 to 21 amino acids. These windows were then screened against all training and testing examples to only retain unique, never before seen, entries in their respective sets. Ultimately this generated 171 constitutive 20S cleavage windows and 54 immunoproteasome 20S cleavage windows.
2.8 Collection and processing of epitope data for validation
Data from Bassani-Sternberg et al. (2016) was held out from previous steps to be used in validation. As described above, 21 amino acid windows were generated using reported epitopes and their source protein contexts. These windows were then screened to only retain unique entries in their respective sets and companion non-cleavage examples were generated as described previously, with the exception that only one internal site was sampled at random during non-cleavage window generation to create an initially balanced set of positives and negatives as with the in-vitro validation set. For validation windows, the additional step of filtering all validations windows with a non-unique interior window of 7 amino acids (smallest centered window size for the models to be assessed) was also taken to ensure no redundant windows were present in the validation set for any training window sizes from 7 to 21 amino acids. Finally, each window was also screened against those used in the training or testing sets to ensure none had been previously seen by the trained models. Ultimately, this generated 7951 cleavage windows for validation.
2.9 Model implementation and availability
Our in vivo and in vitro cleavage models were implemented in Python version 3.7. All deep learning models were generated using PyTorch version 1.3.1 (Paszke et al., 2019), while all machine learning models were generated using Scikit-learn version 0.22.1 (Pedregosa et al., 2011). The full instructions and code for replication of the analyses contained herein can be found at https://github.com/pdxgx/pepsickle-paper, while the fully deployed command line version of pepsickle, along with relevant installation instructions can be found at https://github.com/pdxgx/pepsickle. To better handle a variety of use cases, including analysis of long and short peptides, the deployed version of pepsickle recognizes two different padding characters: (*) for terminal sequences with no adjacent amino acids and (X) for sequences flanked by unknown amino acid residues (see pepsickle readme for full details). pepsickle is open source and available under the MIT user license.
2.10 Comparison of cleavage prediction tools
A literature search and browser query were performed to identify currently available tools for proteasomal cleavage prediction (search terms included ‘cleavage prediction’, ‘proteasomal prediction’, ‘cleavage prediction tool’ and ‘proteasomal cleavage prediction’). Through this search, six tools were identified including: NetChop 3.1 (Nielsen et al., 2005), the Proteasomal Cleavage Prediction Server (PCPS) (Gomez-Perosanz et al., 2020), PCleavage (Bhasin and Raghava, 2005), MAPPP (Holzhütter and Kloetzel, 2000), PAProC (Nussbaum et al., 2001) and the random forest-based model described in Li et al. (2012). NetChop version 3.1 was downloaded from http://www.cbs.dtu.dk/services/NetChop/ and installed as a command line tool on a Linux server running CentOS 7.7.1908 after which cleavage windows for both in vitro and in vivo validation examples were given in FASTA format to their respective model types. Predictions were saved and assessed only for the point of potential cleavage in each window. PCPS was run via its web server implementation at http://imed.med.ucm.es/Tools/pcps/ with both constitutive proteasome and immunoproteasome options selected. For each in vitro data type, the model corresponding to the proteasome type was used, with only the midpoint of each window reported and recorded as described above. For in vivo epitope windows, both models were assessed in the same fashion, with results reported for the model achieving the best AUC. PCleavage was also run via its web server implementation at http://crdd.osdd.net/raghava/pcleavage/, however validation assessment was only performed for in vivo epitope windows using the default threshold of 0.3. For both constitutive proteasome and immunoproteasome data; PCleavage did not accept windows that spanned the C- or N-termini of a given source protein, which reduced the validation set size substantially and prevented paired comparisons with the other models available. Additionally, we were unable to confidently reproduce the training dataset(s) for NetChop 3.1, PCPS, and PCleavage, and thus could not guarantee our validation set was mutually exclusive with training data for these tools across all trained models. Three cleavage prediction tools were ultimately not functional in our hands: the MAPPP server is no longer available and we were unable to locate a publicly downloadable version of the tool, we were unable to obtain a working copy of PAProC II despite repeated requests, and we were unable to locate any web server or public tool implementing the model from Li et al.
Computational performance was assessed for all tools not reliant on a web server (i.e. NetChop 3.1, pepsickle). Using a dedicated node (Intel Xeon E5-2697 v2 2.70 GHz, single thread mode) on a Linux server running CentOS 7.7.1908, both in vitro and epitope-based models for NetChop 3.1 and pepsickle were applied to a performance test set consisting of all proteins in the human proteome (https://www.uniprot.org/proteomes/UP000005640). Total CPU times were calculated as the ‘user’ time + ‘sys’ time for each prediction model (Supplementary Table S4).
2.11 Model cross-comparison assessments
The cross performance of both constitutive-based and immuno-based in vitro models were assessed using the same in vivo validation set used for our epitope trained model (Supplementary Table S5). Cleavage predictions were generated using the internal 7 amino acid window centered within each larger 21 amino acid validation window. Predictions were reported at the same central amino acid with the default prediction probability threshold of 0.5 used for determining cleavage versus non-cleavage predictions. We reasoned that positive epitope cleavage examples should be predicted with good accuracy while negative examples would not due to the complex selectivity of the downstream antigen processing and presentation pathway (e.g. MHC binding); therefore, only the percentage of correctly captured positive cleavage examples was assessed (sensitivity). This removes the possibility of misreporting true cleavage events that are filtered during post-cleavage processing as model misclassifications.
2.12 Collection of patient-derived immune response data and model application
Three primary literature articles including patient specific predicted tumor neoepitopes and epitope-specific immune responses were identified for model application, including: (i) the Ott et al. patient-specific melanoma vaccine study (Ott et al., 2017), (ii) the MuPeXI neoepitope prediction study (Bjerregaard et al., 2017) and (iii) a large scale neoepitope prediction comparison from the Tumor Neoantigen Selection Alliance (TESLA) (Tumor Neoantigen Selection Alliance, 2020). From sources 1 and 2 where gene/protein sources for each predicted epitope were provided, each mutated candidate was mapped back to its original proteomic position to retrieve upstream (10 amino acids) and downstream (10 amino acids) contexts. For predicted neoepitopes within 10 amino acids from the start or end of the protein, positions were buffered using ‘*’ prior to model input. For predicted neoepitopes reported in the TESLA study the original source proteins were not provided. Instead, candidate neoepitope sequences were queried against the human reference proteome using the BLAST (Altschul et al., 1990) command line tool with the following parameters: ‘-matrix BLOSUM62’, ‘-evalue 200000’, ‘-comp_based_stats F’. Only ungapped alignments were retained, allowing for a singular mismatch at the mutated position with exact matches at all other positions. Protein contexts around each candidate neoepitope were generated as described for the other two studies, however all candidate neoepitopes resulting in more than one unique context window were filtered out to remove any candidate neoepitopes with an ambiguous source in the proteome. All predicted neoepitopes across the three studies were also annotated as ‘responsive’ or ‘non-responsive’ based on the reported patient specific immune response. This resulted in 762 candidate neoepitopes, of which 45 (5.9%) were reported as inducing a patient-specific immune response.
After all context windows were collected, our in vivopepsickle model was applied to the C-terminal position of each proposed neoepitope candidate, returning the predicted C-terminal cleavage probability. Median cleavage probabilities for predicted neoepitopes that elicited a patient specific immune response were compared to those that were predicted but for which an immune response was not verified using a Wilcoxon ranked sum test. Additionally, the use of cleavage probability as a classification threshold was assessed using the 25th percentile of predicted cleavage probabilities across all candidate neoepitopes as a cutoff. The proportion of responsive versus non-responsive neoepitopes that were properly identified using this thresholding approach was assessed using a Chi-square test for independence.
3 Results
3.1 In vitro digestion-based cleavage prediction
We identified 35 publicly available in vitro digestion datasets, constituting both 20S constitutive and 20S immunoproteasomal cleavage experiments (Table 1). From these, six studies were reserved for external validation (validation set), while the rest were aggregated to generate a training and testing dataset containing cleavage information from 1984 peptide fragments generated across constitutive, immuno- and mixed proteasomal contexts. We then trained a gradient boosted classifier based on windows of seven amino acids in length centering on each cleaved site. Residues within the window were encoded as the physical properties (polarity, molecular volume, hydrophobicity and conformational entropy) of each amino acid at each given position in the window. Using annotated proteasome types, the model was trained to differentiate between sites cleaved by the immunoproteasome and those cleaved by the constitutive proteasome, returning the probability of cleavage at the center of each window. This model achieved a test set AUC of 0.759 (Supplementary Table S6). We explored whether additional peptide context around each cleavage site (21 amino acid windows) improved model performance; however, a comparison of models trained with both 7 amino acid and 21 amino acid window sizes showed no increase in AUC when applied to testing the data (DeLong’s T-test, P = 0.558). Similarly, we assessed whether a fully connected feed-forward deep learning model could improve cleavage predictions over the initial machine learning approach. The use of this feed-forward network model also did not appear to increase performance significantly (P = 0.558). We therefore report and discuss the results from our seven amino acid gradient boosted classifier (pepsickle) hereafter.
We next assessed in vitropepsickle performance on an independent validation set, consisting of 171 constitutive proteasome and 54 immunoproteasome examples, respectively. Our model achieved an AUC of 0.821 on the constitutive proteasome validation set and 0.789 on the immunoproteasome validation set, respectively. Using the same validation sets, we assessed the corresponding performance of existing tools including NetChop 3.1 and the Proteasomal Cleavage Prediction Server (PCPS) (Fig. 6). Note that PCleavage was omitted from these in vitro-based comparisons due to its inability to process cleavage sites whose context windows span a peptide fragment’s N- or C-termini (54.4% of the constitutive and 81.5% of the immuno validation data respectively). We found that pepsickle has significantly higher predictive performance on constitutive proteasomal data compared to PCPS, but similar performance compared to NetChop 3.1 (Fig. 6). When applied to immunoproteasomal data, our model compared similarly to both PCPS and NetChop 3.1, acknowledging limited statistical power to detect a difference given the small sample size (Fig. 7; Supplementary Table S7).
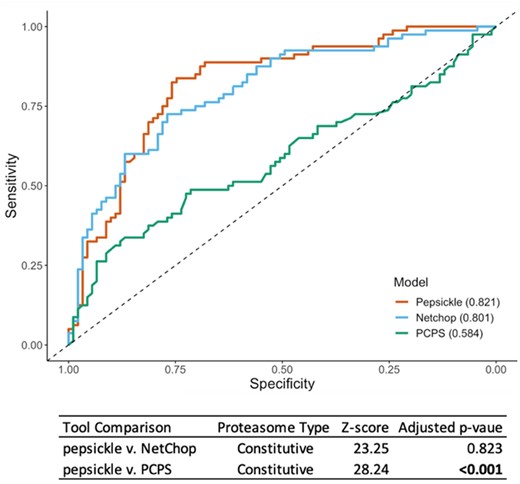
Performance comparison of cleavage prediction models on constitutive proteasome data. Receiver operating characteristic (ROC) curves are shown for each of three cleavage prediction models, as denoted in legend, with corresponding area under the curve (AUC) values reported in parentheses. Sensitivity (y-axis) and specificity (x-axis) were both evaluated using a validation set (n = 171) consisting of 80 cleavage and 91 non-cleavage in vitro examples not seen during the training or testing of our models (see Methods). For pepsickle (our model) and PCPS, the constitutive proteasome models with default settings were used. For NetChop 3.1, the in vitro model was used with default settings (no specification is available for proteasome type). PCleavage was omitted from this comparison due to restrictions on window sizes and the inability to process the full set of validation examples. Statistical pairwise comparisons of ROC curves (Delong’s tests) are shown in corresponding table values (Z-score), with significance reported as P-values after Benjamini–Hochberg correction for multiple comparisons
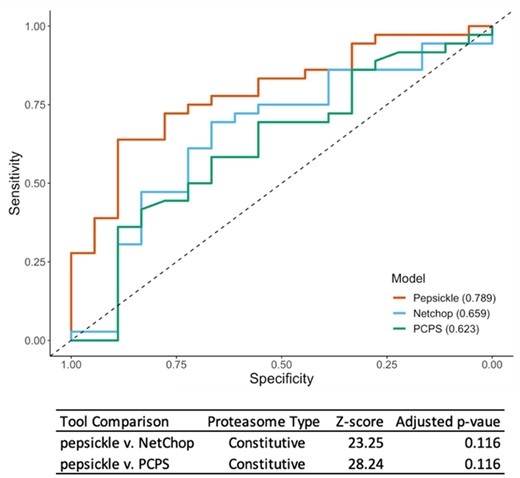
Performance comparison of cleavage prediction models on immunoproteasome data. Receiver operating characteristic (ROC) curves are shown for each of three cleavage prediction models, as denoted in legend, with corresponding area under the curve (AUC) values reported in parentheses. Sensitivity (y-axis) and specificity (x-axis) were both evaluated using a validation set (n = 54) consisting of 36 cleavage and 18 non-cleavage in-vitro examples not seen during the training or testing of our models (see Methods). For pepsickle (our model) and PCPS, the immunoproteasome models with default settings were used. For NetChop 3.1, the in vitro model was used with default settings (no specification is available for proteasome type). PCleavage was omitted from this comparison due to restrictions on window sizes and the inability to process the full set of validation examples. Statistical pairwise comparisons of ROC curves (Delong’s tests) are shown in corresponding table values (Z-score), with significance reported as P-values after Benjamini–Hochberg correction for multiple comparisons
3.2 Epitope-based cleavage prediction
To better interrogate in vivo proteasomal cleavage, we identified 357 253 naturally processed human and mammalian class I epitopes from publicly available data (Table 2). Using a deep learning framework, we trained a consensus-based neural network on amino acid sequence and physical properties to predict epitope C-terminal cleavage events, independent of proteasome type (Supplementary Fig. S1). Performance of our deep learning model was compared across all odd window sizes ranging from 7 amino acids to 21 amino acids, with windows centered on the cleavage site as described above (Supplementary Table S8). When applied to testing data, the model trained on 17 amino acid windows performed significantly better than the model trained on 7 amino acid windows, however increasing window size beyond 17 amino acids did not improve performance further (Supplementary Fig. S5). This is consistent with the average cleaved peptide length of 8 amino acids (Berko et al., 2012) and the potential for bi-directional proteasome entry and processing (Groll et al., 1997). We additionally studied the influence of model complexity, finding that the consensus-based deep learning approach performed better than a more simplistic random forest model trained using the same window size (DeLong’s T-test, P = 0.021). We therefore report and discuss results from the consensus-based model (pepsickle) using 17 amino acid windows hereafter.
Summary of epitope data sources
| Source | Dataset | Fragments reported |
|---|---|---|
| Immune epitope database (IEDB) (Köhler et al., 2001) | Train/test | 4 98 419 |
| SYFPEITHI database (Nussbaum et al., 1998) | Train/test | 4433 |
| Rozanov et al. (2018) | Train/test | 3254 |
| AntiJen database (Kisselev et al., 1999 | Train/test | 1492 |
| Bassani-Sternberg et al. (2016) | Validation | 99 356 |
Note: Sources of epitope data used for training, testing and validation.
We next assessed performance of the pepsickle epitope model on an independent validation set. This dataset consisted of 7951 examples not present in either the training or testing datasets used by our study. Notably, since training sets for all other tools were not explicitly available, we cannot guarantee that our validation set was entirely unseen by other models during their respective training processes. Nonetheless, when applied to this validation data, our deep learning-based ensemble net achieved an AUC of 0.878, representing a significant improvement in AUC over the corresponding performances of existing tools including NetChop 3.1, PCPS and PCleavage collectively (Fig. 8). In addition, pepsickle showed better recall and F-1 score than the other models compared (Supplementary Table S9).
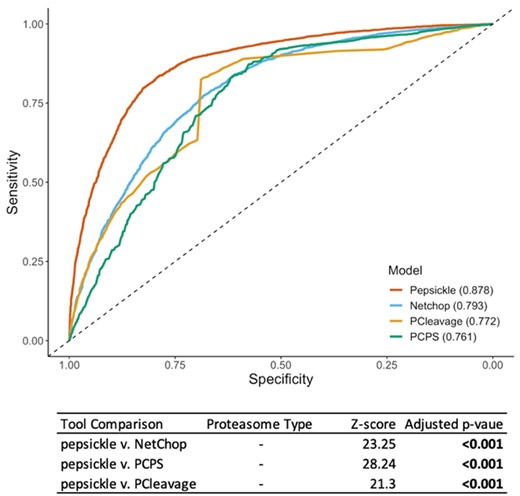
Performance comparison of cleavage prediction models on epitope data. Receiver operating characteristic (ROC) curves are shown for each of four cleavage prediction models, as denoted in legend, with corresponding area under the curve (AUC) values reported in parentheses. Sensitivity (y-axis) and specificity (x-axis) were both evaluated using a validation set (n = 7951) consisting of 3566 cleavage and 4385 non-cleavage epitope examples not seen during the training or testing of our models (see Methods). Default epitope-based models were used for pepsickle (our model), Netchop 3.1 and PCleavage predictions, while constitutive model predictions from the default model 1 were used for PCPS (PCPS immunoproteasome predictions were inferior and therefore omitted). Statistical pairwise comparisons of ROC curves (Delong’s tests) are shown in corresponding table values (Z-score), with significance reported as P-values after Benjamini–Hochberg correction for multiple comparisons
3.3 Computational performance of pepsickle
In addition to predictive ability, we also assessed the computational speed of pepsickle, for both in vitro and epitope-based cleavage predictions. Using a list of all protein sequences in the human proteome as a benchmark dataset (n = 113 576, including all isoforms and computationally predicted sequences), pepsickle was able to achieve a total processing time of 154 m 46 s for in vitro predictions (approximately 124 ms per 1000 predictions) and 158 m 21 s for epitope predictions (approximately 127 ms per 1000 predictions) (Supplementary Table S4). These times were compared to NetChop 3.1 run in an identical controlled computing environment. We found that pepsickle is 68.5% faster than NetChop 3.1 for in vitro cleavage predictions (154 m 46 s versus 260 m 50 s) and 242% faster for epitope-based predictions (158 m 21 s versus 542 m 40 s).
3.4 In vitro digestion and in vivo epitope-based models differ in prediction performance, but with similar feature importance
Despite the substantial differences between sources and structure of training data for both in vitro digestion and in vivo epitope-based models that hinder the creation of a unified model, we sought to evaluate commonalities in the learned feature sets by evaluating cross-performance of our in vitro model on epitope validation data. Acknowledging that epitope-based data is implicitly subject to multiple components of the antigen processing pathway following proteasomal cleavage (Rock et al., 2016), we evaluated the accuracy of the in vitro model exclusively on positive cleavage examples from the in vivo epitope validation set (i.e. all positive examples which must have necessarily undergone proteasomal cleavage). Based on this metric, our in vitro constitutive model was able to correctly identify 69.9% of the cleavage events observed in the epitope validation set, while our immunoproteasome model was able to correctly identify 54.5%. Performance by both in vitro models on this data is substantially lower than the performance of the original epitope-based model, which was able to capture 82.8% of true cleavage events. However, we acknowledge that the epitope validation data contains an unknown mixture of both constitutive and immunoproteasome-based cleavage, which may contribute to the relatively lower performance of both in vitro models in this case.
Because cross-data assessments for both in vitro models represent a substantial performance decrease compared to assessment on like-kind data, we sought to further qualify the distinct commonalities and differences between in vitro digestion and in vivo epitope-based datasets. Using 21 amino acid windows, we compared both training sets to a set of all possible 21 amino acid windows from the human proteome. By overlapping UMAP projections of the windows sampled in the in vivo epitope set with those generated by the human proteome, we were able to visually demonstrate that the majority of the sample space constituted by the human proteome was sampled; however substantial portions were under sampled in the in vitro dataset compared to the in vivo data (Fig. 5). Similarly, the underlying density distribution for samples in the in vitro dataset differed substantially from that seen in both the in vivo dataset and human proteome background (Supplementary Fig. S2).
To further investigate whether differences in the training set representations altered the learned features for each prediction model, we plotted the feature importance for both our in vivo and in vitro models (Supplementary Figs S6 and S7). Acknowledging that model weights are not directly comparable, we found that similar patterns of amino acid physical properties identified cleavage sites across both models: in particular, low molecular volume and low hydrophobicity were important at the C-terminal amino acid, along with low conformational entropy at the ‘1’ position and high polarity at the ‘2’ position compared to other features at the same locations.
3.5 Proteasomal cleavage helps predict epitope-specific immune responses
We next assessed the potential additive contribution of our model to predicting epitope-specific immune responses in real-world patient data. We identified 762 candidate epitopes from three studies with extensive immunoprofiling data: (i) the Ott et al. patient-specific melanoma vaccine study (Ott et al., 2017), (ii) the MuPeXI neoepitope prediction study (Bjerregaard et al., 2017) and (iii) a large scale neoepitope prediction benchmarking effort from the Tumor Neoantigen Selection Alliance (TESLA) (Tumor Neoantigen Selection Alliance, 2020). From these studies, we identified 45 epitopes that elicited an immune response, as well as 717 non-responsive epitopes.
Using the pepsickle epitope-based cleavage model, we predicted C-terminal cleavage probability for all predicted epitopes regardless of corresponding immune response status (Fig. 9). We demonstrated that the median terminal cleavage probability is significantly higher for immune responsive epitopes compared to those that were predicted but did not elicit an immune response (Wilcoxon ranked sum test, P = 0.036). Despite the heavy pre-selection of these epitopes using a collection of predictive methodologies, we find that pepsickle-based cleavage thresholding (≥25th percentile threshold) significantly enriched the proportion of immune responsive epitope candidates with 40% of responsive versus 24.4% of non-responsive candidates falling in the top quartile (12 = 4.86, P = 0.027). This represents a 59.6% increase in the positive predictive value after cleavage-based filtering. Notably, we find that cleavage predictions for two studies follow the trend seen in the aggregate data (Ott et al., 2017; Tumor Neoantigen Selection Alliance, 2020), but the third study does not (Bjerregaard et al., 2017). While this heterogeneity warrants further investigations, these findings suggest that even when used as a post hoc filter, pepsickle-based cleavage predictions may help improve the identification of patient-specific, immune-responsive neoepitopes.
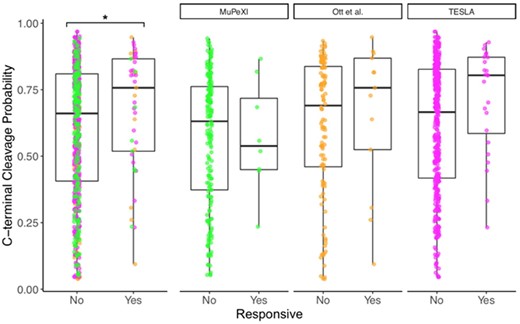
C-terminal cleavage predictions on patient neoepitopes. Predicted neoepitopes from three studies were accumulated. Cleavage predictions at the C-terminus of each epitope were generated using pepsickle and plotted, with predicted epitopes divided based on whether or not they elicited an immune response. Box plot results are shown in aggregate (left) as well as on a per-study basis (right) with values indicating median (horizontal black lines), 25–75%ile (box) and range (‘whiskers’), and with colors corresponding to the study origin (green = MuPeXI, orange = Ott et al., magenta = TESLA). For the aggregated dataset, the median C-terminal cleavage probability is significantly higher (*) for responsive epitopes compared to non-responsive epitopes (Wilcoxon ranked sum test, P = 0.036)
4 Discussion
To the best of our knowledge, the data aggregated for this study represents the largest compilation of in vitro and in vivo cleavage events to date. Applying machine and deep learning techniques to this data, we have improved upon the current state of the field by developing an in vivo model of proteasomal cleavage prediction with improved performance (AUC) over currently available tools. In addition, we have created an in vitro model with performance comparable to the current best-in-class model, NetChop 3.1, but with significantly decreased computational costs and the ability to differentiate between immunoproteasome and standard proteasome cleavage profiles. Although further investigation is needed, application of our in vivo model to patient-derived neoepitope data suggests that including cleavage information in the epitope prediction process may improve novel target identification when applied as an additional filter, and may be a key component missing from the majority of current prediction tools. This is consistent with recent evidence demonstrating the value of incorporating proteasomal cleavage predictions into epitope prediction pipelines (Sarkizova et al., 2020).
Despite pepsickle’s promising performance using both in vivo and in vitro models, we note several limitations to our work. The primary challenge given the structure of the in vivo data, is that non-cleavage events must be determined heuristically. Although we use stringent filtering criteria throughout our pipeline, accurate negative examples are reliant on sufficient sampling of true cleavage events and may be biased by lack of reporting for less studied portions of the proteome. We also note that differences in the definition of non-cleavage training sites between tools may affect some comparison statistics such as precision and F1-score. While this issue could potentially be addressed by re-training other model architectures using a consistent non-cleavage site definition, this is not possible with closed source tools such as NetChop 3.1. The inability to re-train closed source models and a lack of specific details on model architectures also means that we could not delineate the effects of a larger training set size from differences in model design across tools. Similarly, we did not assess the relative performance differences of explicitly encoded amino acid physical properties that we used versus the implicitly encoded physical properties (e.g. BLOSUM matrices) used in other tools.
While our in vivo model performs substantially better than our in vitro model on its respective validation set, we note that in vivo data was used exclusively for C-terminal cleavage event prediction leaving N-terminal events largely unrepresented in this context. We suspect the difference in optimal window sizes between the in vivo and in vitro models is a reflection of the shorter peptide fragment inputs to in vitro cleavage experiments compared to full protein contexts in in vivo datasets, but note there may be stochastic or additional latent technical or biological explanations for this distinction. We also note that immunoproteasomal training data was particularly limited due to the scarcity of source data, and may help explain the poorer immunoproteasomal cross-performance on in vivo epitope data.
We did not see evidence that our models learned features unrelated to cleavage, such as MHC binding (Wieczorek et al., 2017), but it remains possible that these and other latent biological features may have been partially learned by our models in addition to true cleavage-specific features (Supplementary Figs S6 and S7). Additionally, our in vitro models are based on relatively small datasets with heterogeneous experimental methodologies, and only a small subset cleanly evaluate the respective roles of the constitutive and immunoproteasomes on the same source proteins. For both in vivo and in vitro data, poor sampling from some regions of the proteome is also of concern, due at least in part to a scientific focus on proteins relevant for cancer and autoimmunity, as well as the experimental limitations of mass spectrometry (Danilova et al., 2019). Finally, while the data suggests our model should perform well on previously unseen data, the discrepancies seen in model application to per-study immune response data raise questions of broader generalizability in certain applied contexts.
pepsickle provides a promising, open-source, tool for proteasomal cleavage prediction, which may be implemented on its own or otherwise integrated into existing epitope prediction pipelines. Given the recent successes and increasing emphasis on developing and deploying mRNA-based vaccines for individual patients (Türeci et al., 2016) and whole populations (Pardi et al., 2018; Maruggi et al., 2019), any concrete improvements in the accuracy of these epitope prediction pipelines could carry transformative clinical value. We also note that an improved capacity to predict proteasomal cleavage could contribute to our understanding of protein turnover and recycling in healthy and diseased contexts (Smail et al., 2021; Bibo-Verdugo et al., 2017) and lead to improvements in rational protein design (Coluzza, 2017).
The performance and potential of pepsickle described in this text are encouraging, however many questions remain unanswered. The heterogeneity of C-terminal cleavage profiles seen in our study specific pepsickle application raises the question of whether cleavage prediction is universally helpful in target identification, or if specific study or design contexts are required to see benefit from cleavage predictions. In addition, whether or not there is an impact of using proteasomal prediction ad-hoc [via integration with existing neoepitope prediction pipelines (Wood et al., 2020; Hundal et al., 2020)] versus post hoc remains to be seen. Application of pepsickle to more patient derived data in the future will help us better understand the broader potential of applying cleavage prediction in this space, with the potential for broad implications in the research and clinical communities.
Data availability
Source code is available at https://github.com/pdxgx/pepsickle-paper under the Massachusetts Institute of Technology (MIT) license, including data extracted from primary literature at https://github.com/pdxgx/pepsickle-paper/tree/master/data/raw and scripts for parsing public databases mentioned herein at https://github.com/pdxgx/pepsickle-paper/tree/master/scripts/database_pulls.
Funding
This work was supported by VA Career Development Award (1 IK2 CX002049-01) and the Sunlin & Priscilla Chou Foundation [to R.F.T.].
Conflict of Interest: none declared.
Disclaimer: The contents do not represent the views of the U.S. Department of Veterans Affairs or the United States Government.

