


Abstract
Each year, the number of published bulk and single-cell RNA-seq datasets is growing exponentially. Studies analyzing such data are commonly looking at gene-level differences, while the collected RNA-seq data inherently represents reads of transcript isoform sequences. Utilizing transcriptomic quantifiers, RNA-seq reads can be attributed to specific isoforms, allowing for analysis of transcript-level differences. A differential transcript usage (DTU) analysis is testing for proportional differences in a gene’s transcript composition, and has been of rising interest for many research questions, such as analysis of differential splicing or cell-type identification.
We present the R package DTUrtle, the first DTU analysis workflow for both bulk and single-cell RNA-seq datasets, and the first package to conduct a ‘classical’ DTU analysis in a single-cell context. DTUrtle extends established statistical frameworks, offers various result aggregation and visualization options and a novel detection probability score for tagged-end data. It has been successfully applied to bulk and single-cell RNA-seq data of human and mouse, confirming and extending key results. In addition, we present novel potential DTU applications like the identification of cell-type specific transcript isoforms as biomarkers.
The R package DTUrtle is available at https://github.com/TobiTekath/DTUrtle with extensive vignettes and documentation at https://tobitekath.github.io/DTUrtle/.
Supplementary data are available at Bioinformatics online.
1 Introduction
High throughput gene expression profiling via RNA-seq has been a major driver of biological insight in the last decade. The number of publicly available datasets has grown exponentially (Supplementary Fig. S1 and Supplementary Methods), recently boosted by the so-called ‘single-cell revolution’ (Pennisi, 2018). In the last few years, a plethora of new single-cell RNA-seq technologies and analysis methods arose (Aldridge and Teichmann, 2020). These technologies allow for an unprecedented level of biological insight (Aldridge and Teichmann, 2020; Kamies and Martinez-Jimenez, 2020), but simultaneously present unique challenges to scientists (Lähnemann et al., 2020).
While most studies mainly focus on analyzing RNA-seq datasets in regard to differential gene expression (DGE) between cell types, conditions or time points, only few also have a look at expression differences of differently spliced transcript isoforms of a gene (hereafter referred to as ‘transcripts’). A great amount of higher organism’s genes are expressed in different isoforms (Chen et al., 2014; Gerstein et al., 2014), e.g. over 86% of human protein-coding genes have at least two annotated transcripts (Gencode v34). Such often-overlooked transcript-level analyses revealed splicing differences related to various genetic diseases (Scotti and Swanson, 2016) like several types of muscular dystrophy and Parkinson’s disease, or cancer (Vitting-Seerup and Sandelin, 2017). Alternatively, information on transcriptional differences can be used for cell-type identification, as most cell types express a unique transcriptomic pattern (Aguet et al., 2017; Reyes and Huber, 2018). While direct differential transcript expression (DTE) analysis would be possible, a differential transcript usage (DTU) analysis is better suitable to accompany a DGE analysis (Soneson et al., 2015). A DTU analysis is testing for proportional differences in the expressed transcript composition of a gene, thus comparing how much each transcript contributes to the gene’s total expression between conditions. The ability of DGE, DTE and DTU analyses to identify a gene, or at least one of the gene’s transcripts, as differential is exemplified for three cases in Figure 1.
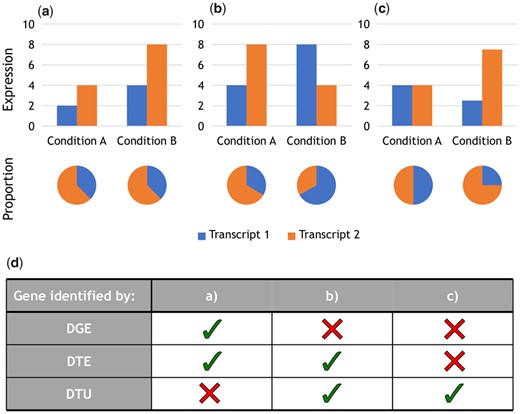
Distinction of differential analysis methods. (a–c) Example cases to differentiate the detection ability of DGE, DTE and DTU analysis. Each case represents a gene’s transcripts expression and their proportion between two conditions. (d) Which differential analysis method detects a differential effect in the examples (a–c). A differential effect is detected, if the gene (DGE, DTU) or at least one of the gene’s transcripts (DTE) shows significant differences. For DGE and DTE analysis, a 2-fold expression increase of the gene or transcript is assumed as a requirement for detection. DGE analysis is based on the sum of the transcript expressions per condition. In (c) the difference between the transcripts is just below the 2-fold threshold for DTE detection
A DTE analysis identifies all significantly differentially expressed transcripts without considering which transcript is originating from which gene. The analysis also includes transcripts of genes, which could already be identified in a DGE analysis. For these genes, the shown gene-level expression differences strongly resemble the direction of differences observed in the DTE analysis, i.e. there is no difference in the gene’s transcript composition (e.g. Fig. 1a). Thus, it would not be preferable to perform a DTE analysis alongside a DGE analysis, as both analyses would spend statistical power on identifying the same effect. A DTU analysis, on the other hand, is not affected by this phenomenon, as there is an information gain if a gene is identified both in a DGE and a DTU analysis. Such a gene would not only show differential expression between conditions, but there would also be a proportional shift in transcript composition, e.g. there is a change in the majorly expressed transcript.
The rise of fast transcriptomic quantifiers, like Salmon (Patro et al., 2017) or kallisto (Bray et al., 2016), leveraged the possibility of quickly assessing gene and transcriptomic counts without the need to perform a compute-intensive genomic alignment. Recently, single-cell variants of these tools were made available as Alevin (Srivastava et al., 2019) and bustools (Melsted et al., 2019), supporting single-cell RNA-seq data from various protocols. The quantification results can be used with established DGE and DTU calling methods, allowing for an analysis based on the very same underlying data. Besides their computation time improvement, transcript abundance estimators retain multi-mapping reads (i.e. reads that could originate from multiple transcript isoforms) for their inference steps, which showed increased sensitivity compared to a classical alignment (Robert and Watson, 2015). In addition, this behavior is essential for correctly quantifying transcript isoforms and therefor also for DTU analysis.
Recently published DTU analysis tools either focus on bulk [IsoformSwitchAnalyzeR (Vitting-Seerup and Sandelin, 2017, 2019), RATs (Froussios et al., 2019), BANDITS (Tiberi and Robinson, 2020)] or single-cell RNA-seq data [Sierra (Patrick et al., 2020)]. The established tool IsoformSwitchAnalyzeR offers a plethora of different analyses, including DTU calling utilizing either the DRIMSeq (Nowicka and Robinson, 2016) or DEXSeq (Anders et al., 2012) package. It offers various analysis steps, trying to identify isoform switches with functional consequences, mainly by incorporating data from external tools. The recently published RATs enhances previous approaches by taking (optional) inferential replicate information of the transcriptomic quantifiers into account for the DTU calling. BANDITS also focuses on modeling uncertainty of the transcriptomic quantification process by using transcript equivalence classes and a Bayesian hierarchical model in conjunction with Markov chain Monte Carlo sampling. The results look very promising, but the complex statistical computations heavily impact the analysis’s computation time. Lastly, the recently published Sierra introduces DTU analysis of single-cell RNA-seq data by implementing a novel approach of dissecting transcript expression based on peak calling of specific gene feature sites. In contrast to the approach presented in this publication, Sierra relies on a genomic alignment followed by attributing peak counts to annotated features (exons, introns, UTRs). These counts are then aggregated to pseudo-bulk samples and tested for differential usage via DEXSeq. Notably, Sierra’s approach is not comparable to ‘classical’ DTU analyses, as not expression proportions of transcripts are compared but expression proportions of features. Thus, the results are not differentially used transcript isoforms between groups, but rather differential exon usage, differential intron usage, etc. in a gene.
This publication presents DTUrtle, the first DTU calling and visualization workflow for bulk and single-cell RNA-seq data, and the first method to perform a ‘classical’ DTU analysis in a single-cell context. DTUrtle adapts and extends one recently presented DTU calling workflow (Love et al., 2018), adding the capability to analyze (sparse) single-cell expression matrices. Furthermore, it introduces a novel detection probability score for tagged-end data, and offers the possibility to perform a DGE analysis alongside. DTUrtle is an easy-to-use R package, aiding the user at importing data and visualizing results. It also offers direct integration with Seurat (Stuart et al., 2019) objects, further leveraging the use of DTU analysis alongside various single-cell analyses. DTUrtle allows to conduct the main DTU analysis of a ‘standard’ bulk or single-cell experiment in less than 20 and 30 min, respectively.
2 Materials and methods
Description of the analysis of public RNA-seq dataset growth, about DTUrtle’s filtering strategy, the performed Gene Ontology (GO) analysis, Seurat’s cell marker identification, DTUrtle’s DGE calling via DESeq2, the performed computation time benchmark, the genomic gene body coverage analysis and about the development of the sparseDRIMSeq package can be found in Supplementary Methods.
2.1 Pre-processing of supporting datasets
To exemplify the usage of DTUrtle, vignettes for four different datasets ranging over different species and sequencing protocols are available online at https://tobitekath.github.io/DTUrtle/articles/index.html. In this publication, results for three of these datasets are presented.
The first dataset is from Hoffman et al. (2020) (Supporting Data S1), presenting a time series of bulk RNA-seq data of human A1-2 breast cancer cells after treatment with dexamethasone. For demonstration purposes, we focus on comparing samples after two-hour dexamethasone treatment to samples of the ethanol-treated control group. Three treated samples (‘Dex2hr’) are compared to three control samples (‘EtOH’). After initial quality control as well as quality and adapter trimming with Trim Galore! (Babraham Bioinformatics), transcript-level quantification was performed with Salmon based on Gencode transcriptome release v34 (Frankish et al., 2019).
The second dataset consists of murine single-cell RNA-seq data from the Tabula Muris project (Schaum et al., 2018) (Supporting Data S2). We focus on cells aggregated from two mammary gland samples, comparing cells annotated as T cells versus luminal epithelial cells. For data pre-processing, BAM files were converted to FASTQ files and then quantified with Alevin against Gencode transcriptome release vM24. The dataset was prepared with 10× Genomics Chromium V2, which is directly supported by Alevin. In addition, cell barcode identification and correction was performed by Alevin, resulting in quantification data for 3992 and 4326 cells per sample, respectively. Finally, cells of the two samples were mixed, resulting in comparing 1750 T cells to 459 luminal epithelial cells in the DTU analysis.
The third dataset consists of murine single-cell RNA-seq data from Wuidart et al. (2018) (Supporting Data S3). This dataset consists of mammary gland cells, which were sequenced according to the Smart-seq2 protocol, and therefore should not be impaired by a potential 3′- or 5′-bias (Picelli et al., 2014). As Smart-seq2 is not UMI based and reads from single cells are sequenced as single samples, the very same pre-processing as for Supporting Data S1 was applied.
Key software used in the analysis of the Supporting datasets are stated in Supplementary Table S2.
2.2 Import of transcript-level quantification data
DTUrtle supports quantification results from the following tools: Salmon, Alevin, kallisto, bustools, RSEM (Li and Dewey, 2011), StringTie (Pertea et al., 2015) and Sailfish (Patro et al., 2014). This is mainly achieved by utilizing the tximport (Soneson et al., 2015) R-package, with additional support for bustools. The quantification tools Alevin and bustools are specifically designed for single-cell datasets, supporting various single-cell protocols.
2.3 Count scaling and normalization
Depending on the sequencing technique used to create reads, the resulting quantification counts are confounded by specific biases. Notably, only spliced mature mRNA reads are of interest in the context of DTU analysis, as only these allow differentiation of different transcript isoforms. One apparent bias is created by a varying sequencing depth per sample (Mortazavi et al., 2008; Tarazona et al., 2011). The bigger the library size, i.e. the more reads are sequenced per sample, the higher are the actual counts. This effect can be mitigated by scaling the counts by a library-size-related factor (e.g. reads per million). In the context of DTU analysis, this bias is negligible as we are looking at proportional differences.
A more DTU relevant bias is resulting from a varying length of the single annotated transcripts (Oshlack and Wakefield, 2009). The longer a transcript is, the more likely a fragment of such transcript is sequenced. Again, we can account for this bias by scaling the counts by an individual gene or transcript length factor. Notably, this bias is only present in randomly fragmented sequencing techniques, i.e. where reads are not uniquely originating from the 3′ or 5′-end of RNA sequences. For tagged-end sequencing techniques, which mostly generate reads from spliced mRNA, the annotated transcript length is negligible (Srivastava et al., 2019).
DTUrtle aims to automatically apply the most appropriate normalization strategy based on the input. For bulk RNA-seq data, which is mostly randomly fragmented, the default scaling scheme is tximport’s ‘scaledTPM’, which is well suited for DTU analysis as the counts do not scale with transcript length (Love et al., 2018). If the user provides information, which transcripts belong to which gene, the DTU specific ‘dtuScaledTPM’ scaling scheme is used. This scaling scheme re-scales the counts by the median transcript length of the specific transcript isoforms. Because most current single-cell RNA-seq protocols are tagged-end (Chen et al., 2019), e.g. the widespread 10× Chromium platform or Drop-Seq, and most of the reads originate from spliced mRNA, no scaling scheme is deployed by default.
2.4 DTU calling and statistical correction
DTUrtle uses an extended DTU calling workflow consisting of DRIMSeq and stageR (Van den Berge et al., 2017), as suggested previously (Love et al., 2018). In brief, the Dirichlet-multinomial model of DRIMSeq is used to estimate the precision parameter, which is used together with the group-wise maximum likelihood estimates of transcript proportions πA and πB in a likelihood ratio test against H0: πA = πB.
In general, a DTU analysis should answer two questions: First, ‘Which genes show overall signs of DTU?’ and second, ‘Can we pinpoint specific transcripts that are differentially used in those genes?’. These questions can be tested independently, but the results (and therefore the error rates) are dependent. To address both questions, the two-stage statistical procedure stageR is used. In this procedure, the (multiple-testing unadjusted) DRIMSeq gene P-values are analyzed in a screening stage, to determine which genes show signs of DTU via an omnibus test. For the genes with significant signs of DTU, the DRIMSeq transcript-level P-values are individually tested for DTU in a confirmation stage. Both testing stages are performed against a mutual overall false discovery rate (OFDR), which ensures a controlled combined error-rate in both tests. This procedure results in a corrected P-value for each gene, as well as a corrected P-value for each transcript of a significant gene.
2.5 Detection probability score for tagged-end data
For each gene that shall be scored, the transcript with the highest mean proportion over all samples/cells is chosen as reference transcript tref. If no expression data is available, DTUrtle uses the first annotated transcript as a fallback reference. Subsequently, for all non-reference transcripts ti, the score is calculated as above, with diff(a, b) returning a set of start and end coordinates of exonic differences between transcripts a and b, and d(n, m) measuring the exonic distance between coordinates n and m. The coordinate of the priming enriched end of transcript ti is denoted by ci, with ći representing the coordinate of the opposing end. A visual example of the score calculation is given in Supplementary Figure S2. In brief, the score calculation identifies the position of the exonic difference between the reference transcript and the to-be-scored transcript ti, which is closest to the priming enriched end of ti. The actual score is calculated by the counter probability of the proportional relative position of this difference. E.g. if the first exonic difference is located after 22% of tis length (measuring from the priming enriched end), the priming bias detection probability score would be 0.78.
3 Results
DTUrtle’s three-step analysis workflow (Fig. 2) is exemplified and validated on three distinct real-world datasets, spanning two species and three sequencing techniques. The sundry visualization options are exemplified for key results in Supplementary Figure S3.
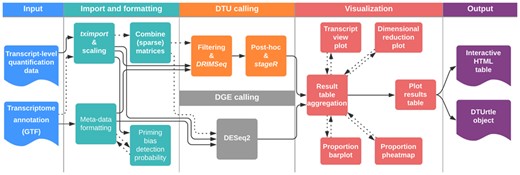
Detailed depiction of DTUrtle’s workflow. First, transcript-level quantification counts and annotation data are read-in and formatted. For tagged-end data, the calculation of a priming bias detection probability for each transcript can be conducted. In a second step, the filtering and DTU calling is performed with DRIMSeq, followed by two-stage statistical correction with stageR and optional post-hoc filtering. Alternatively, DGE calling can be performed with DESeq2. The analyses results can be aggregated to a results tables, including four distinct visualization options. Finally, the results table can be exported as an interactive HTML-table. The DTUrtle object is gradually built during this workflow and contains all final and intermediate results for further processing and analysis
3.1 DTUrtle workflow
The DTUrtle package offers a three-step analysis workflow: Step 1: Data import and formatting. Step 2: Filtering and DTU calling. Step 3: Visualization and result aggregation.
The workflow requires transcript-level quantification counts and a transcriptome annotation file (GTF or GFF3) as input. DTUrtle’s pre-processing vignettes exemplify the generation of transcript-level quantification counts for bulk RNA-seq data and three different types of single-cell RNA-seq data (10× Chromium, Illumina SureCell and Smart-seq2) using Salmon and Alevin. DTUrtle is able to import the output of seven quantification tools (see Section 2)—other formats can be imported manually. As cell identifiers from single-cell experiments are not necessarily unique across samples, these identifiers are modified when merging the count matrices, if applicable. Tagged-end sequencing protocols potentially impair the ability of certain transcript-level differences to be found in a DTU analysis (see Section 4). DTUrtle offers the calculation of a novel priming bias detection probability score for tagged-end data, to assess how much each transcript is affected by this potential bias. In addition, various ‘helper’ functions are offered to correctly format the data, e.g. functionality to ensure a one-to-one mapping between gene or transcript identifiers and names.
Following data import, DTUrtle offers customizable functions to conduct DTU calling, extending concepts presented in Love et al. (2018). First, an initial filtering and DTU calling is performed with DRIMSeq. DTU calling results then undergo an optional post-hoc filtering, followed by a two-stage statistical correction using stageR. Besides two predefined filtering strategies for bulk or single-cell data (Supplementary Methods), filtering thresholds can be specified and adjusted by the user. DTUrtle utilizes an extended version of the DRIMSeq package, called sparseDRIMSeq, which allows usage of dense as well as sparse data matrices. All intermediate and final results are stored in one DTUrtle object, an accessible list. This object is constructed gradually, beginning from the first DTU calling step, and can be passed down to all following steps of the workflow.
Optionally, DTUrtle allows to extend Seurat objects with transcript-level counts, harmonizing DTU analysis with prior single-cell RNA-seq analyses. These extended Seurat objects can also be used in the first DTU calling step to automatically provide required input.
Besides DTU analysis, DTUrtle allows to perform a DGE analysis of bulk or single-cell data alongside, utilizing DESeq2 (Love et al., 2014). For single-cell data, specific parameters are set by default, as suggested in the DESeq2 vignette (Supplementary Methods).
3.2 Visualization and result aggregation
DTUrtle’s result aggregation and visualization capabilities are described in detail in the Supplementary Results.
3.3 DTU in human breast cancer cells
To exemplify the usage of DTUrtle, three different datasets ranging over different species and sequencing protocols were analyzed (see Section 2). We examined a public dataset of bulk RNA-seq data from Hoffman et al. (2020), representing a time series of transcript expression in human A1–2 breast cancer cells after treatment with dexamethasone (Supporting Data S1). The DTU analysis focused on ethanol-treated control samples (EtOH) and samples after two hours of dexamethasone treatment (Dex2hr), comparing three biological replicates each. DTUrtle identified 294 genes with DTU. The transcript-level tests identified 146 transcripts of these genes with significant proportional differences between the groups (OFDR < 0.05).
GO (Ashburner et al., 2000; The Gene Ontology Consortium, 2021) analysis of the significant DTU genes identified 11 significant GO terms (P-value < 0.01), including biologically expected terms like ‘response to ethanol’ (GO:0045471), ‘negative regulation of GTPase activity’ (GO:0034260) and ‘negative regulation of dendritic spine development’ (GO:0061000) (Supplementary Methods). DTU in ethanol responding genes is very plausible, as the control samples have received an ethanol treatment instead of the dexamethasone treatment. In addition, the synthetic glucocorticoid dexamethasone is known for its regulatory effect on the small GTPase Rasd1 (Lellis-Santos et al., 2012) and the development and plasticity of the dendritic spine (Liston and Gan, 2011) (Supplementary Table S1).
In Hoffman et al., expression of specific known dexamethasone and glucocorticoid target genes is visualized along the treatment time course, including glucocorticoid-induced leucine zipper TSC22D3 and Serine Palmitoyltransferase Small Subunit B (SPTSSB). These two genes were also identified in the DTU analysis, indicating not only a change in gene expression but also a change in the expressed transcript proportions in treated samples. To validate the coherence of the DTU effect for these two genes, additional samples of the treatment time course were analyzed (time after treatment: 1, 4, 8 and 18 h; 3 samples each). In Figure 3, the mean gene expression and the proportions of each analyzed transcript of TSC22D3 and SPTSSB are shown.
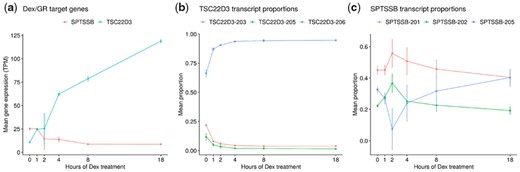
Differential transcript usage of dexamethasone target genes SPTSSB and TSC22D3 in human breast cancer cells. (a) Mean gene expression of SPTSSB and TSC22D3 along the dexamethasone treatment time course in transcripts per million (TPM). Standard deviation is indicated by error bars. (b,c) Mean proportions of TSC22D3 and SPTSSB transcripts along the dexamethasone treatment time course. Standard deviation is indicated by error bars
While the expression of TSC22D3 rapidly increases over the time course, the expression proportion of TSC22D3-206 rises from ∼65% (without treatment) to ∼95% (18 h after treatment). Thus, TSC22D3-206 becomes the almost exclusively expressed isoform after dexamethasone treatment, while the expression of the TSC22D3-203 isoform quickly vanishes. Conversely, gene expression of SPTSSB decreases after the dexamethasone treatment. On transcript level, the expression proportion of SPTSSB-205 rapidly decreases right after treatment, then quickly recovers after approximately two hours and even surpasses its original proportional level 18 h after treatment.
3.4 Identifying transcriptional cell-type markers in murine mammary gland tissue
In 2018, a transcriptome data compendium of 20 distinct organs and tissues from Mus musculus—called ‘Tabula Muris’—was published (Schaum et al., 2018). To demonstrate DTUrtle’s single-cell capabilities, single-cell RNA-seq data of the mammary gland tissue was analyzed in regard to DTU (Supporting Data S2). The analysis was performed comparing T cells (n = 1750) and luminal epithelial cells (n = 459) of the mammary gland, revealing 2100 significant genes and 3130 significant transcripts (OFDR < 0.05). As the analysis compares different cell types, we tried to identify cell type specific transcriptional markers in DTU genes and transcripts, highlighting the heterogeneous transcriptional profile of each cell type. Ideally, a candidate marker transcript would be expressed in nearly all cells of one cell type, while not being expressed in the other cell type. ‘Expressed in’ describes the ratio of cells, where the expression of a gene or transcript could be measured, i.e. expression is above zero. In addition, a strong proportional difference in the expression of one of the gene’s transcripts is of great interest. We visualized DTU genes according to these two parameters in Supplementary Figure S4, depicting the maximal expressed-in difference of a gene’s transcript on the x-axis and the maximal proportional difference on the y-axis. Of the 2100 DTU genes, we selected the 64 most extreme genes according to the parameters above (Supplementary Fig. S4b) by fitting a multivariate normal distribution ellipse (Fox et al., 2011) at the 99th percentile of the variables.
Among the 64 selected genes are well-known cell type specific marker genes, like Cd3d and Cd3g (T cell), or Epcam and Lcn2 (Zhao et al., 2020) (epithelial cell), which partially have been used in the initial cell-type assignment by the Tabula Muris Consortium. GO analysis of the selected genes revealed 12 enriched terms (P-value < 0.01), including three T cell specific terms [‘alpha-beta T cell differentiation’ (GO:0046632), ‘positive thymic T cell selection’ (GO:0045059) and ‘negative regulation of T cell apoptotic process’ (GO:0070233)] (Supplementary Table S1). To examine the cell-type specificity of the selected genes, we performed an established cell marker identification with Seurat on the transcriptional counts of the whole mammary gland dataset (Supplementary Methods). Besides T cells and luminal epithelial cells, the dataset also contains B cells, basal cells, endothelial cells, macrophages and stromal cells. Seurat analysis identified 136 transcripts of the 64 selected genes identified as cell-type markers. We examined these transcripts’ cell types based on the total number of transcripts identified for each cell type and identified an increased proportion of luminal epithelial cells (1.5-fold) and T cells (2.9-fold), in comparison to the third-highest cell type (basal cell) (Supplementary Table S1). Major transcript proportions of cell marker DTU genes Rps24, Myl6 and Pde4d are shown in Figure 4. Expression proportions of Rps24-202, Myl6-206 and Pde4d-211 could be used as luminal epithelial cell specific markers, and therefore to differentiate T cells from luminal epithelial cells on transcript level.
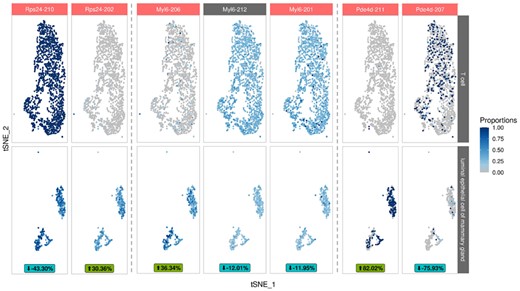
Revealing cell type specific transcripts in murine mammary gland tissue via differential transcript usage analysis. t-SNE reduction, colored with proportions of cell type specific marker transcripts. Selected transcripts of Rps24, Myl6 and Pde4d are depicted separately for T cells and luminal epithelial cells. Significant transcripts are highlighted in red. The mean fitted proportional difference for each transcript is shown at the bottom, the direction of this difference is in regard to luminal epithelial cells
3.5 Overlap of tagged-end and full-length single-cell protocols
A second dataset of mouse mammary gland cells was analyzed (Wuidart et al., 2018) (Supporting Data S3). In contrast to the 3′-biased Tabula Muris data, the used Smart-seq2 protocol produces reads spanning over the full-length of an mRNA. The gene body coverage analysis (Supplementary Methods) still indicates a 3′-bias in the Smart-seq2 data, although less severe than in the 10× Chromium Tabula Muris dataset (Supplementary Fig. S5). We focused on performing DTU and DGE analysis between luminal epithelial cells and basal cells, as these cell types are both present in Supporting Data S2 and Supporting Data S3.
In the Wuidart et al. dataset, 90 luminal epithelial cells are compared to 60 basal cells, while in the Tabula Muris dataset 459 cells are compared to 392, respectively. DTU analysis with DTUrtle found 162 and 835 significant DTU genes (OFDR < 0.05), respectively. Of these, 55 DTU genes were found in both analyses (∼34% overlap). DGE analysis revealed 1927 and 3178 significantly differential genes (s-value < 0.01 for a log2 fold change threshold of 1), respectively. Both analyses revealed 852 common differential genes (∼43% overlap).
3.6 Detection probability of DTU genes
We analyzed the score distribution of the priming bias detection probability in two datasets with priming bias (Supporting Data S2 and Supporting Data S3). In addition, we were interested in the score distribution of transcripts of significant DTU genes and significant DTU transcripts directly (Supplementary Fig. S6). Notably, we see that the majority of transcripts have a detection probability of 1 (median in boxplots)—thus DTU analysis for the majority of transcript isoforms is potentially not affected by tagged-end data. Furthermore, the transcripts of significant DTU genes show a (slightly) higher detection probability than the baseline, with a drastically increased detection probability of the significant DTU transcripts alone.
3.7 Benchmark of DTUrtle’s computation time
The computation time for DTUrtle’s main DTU analysis steps have been measured for bulk and single-cell data (Fig. 5, Supplementary Fig. S7 and Supplementary Methods), using Supporting Data S1 and Supporting Data S2 as respective prototypes. In general, DTUrtle’s computation time does scale sub-linearly, both for an increasing number of samples/cells and transcript isoforms. The number of transcripts that are analyzed has a greater impact on the computation time than the number of samples/cells—e.g. tripling the number of samples in the bulk dataset did only marginally increase the computation time. DRIMSeq’s precision estimation step is by far the most compute intensive step, followed by the initial filtering of transcript isoforms. DTUrtle uses a run-time optimized filtering step, which quickly filters dense and sparse matrices in a parallelized manner.
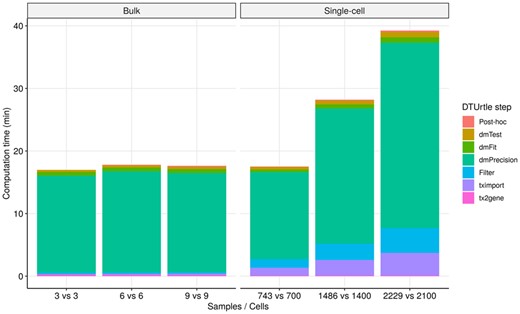
Computation time of DTUrtle’s main DTU steps for a varying number of samples/cells. The y-axis represents the cumulative computation time in Minutes, the x-axis depicts the number of samples/cells used in the comparison. The segments of each stacked bar are colored according to the DTU analysis step. The visualization is split for Supporting Data S1 (bulk) and Supporting Data S2 (single-cell), where ∼53k and ∼23k transcripts are analyzed after filtering
4 Discussion
The potential of RNA-seq data is often not fully exploited by waiving on transcript-level analyses, like DTU. DTUrtle aims to promote and streamline DTU analysis for novel or already existing datasets. It is the first DTU workflow that supports bulk and single-cell RNA-seq data, it simplifies import and formatting of transcript-level counts and annotation, and offers various result aggregation and visualization options.
We were able to reproduce and extend published findings for bulk and single-cell RNA-seq datasets of human and mouse, showcasing the potential of DTU analysis to gain deeper insights. We showed that dexamethasone treatment of human breast cancer cells does not only induce a change in gene expression in specific genes, but also significantly changes the transcriptional composition of some of these genes. In addition, we identified transcript isoforms, which could act as markers for T cells and luminal epithelial cells in murine mammary gland tissue. This single-cell transcript-level analysis furthermore offers the potential to identify and separate specific sub-populations of a cell type, based on their transcript expression profile. Furthermore, we cross-validated DTU analysis results by performing an analysis between the same cell types from different datasets. We found the overlap of DTU results being comparable to a classical DGE analysis. Especially as the compared datasets were sequenced with different protocols and sampled from different mouse strains at different developmental stages.
As the currently most prominent single-cell RNA sequencing technologies are tagged-end protocols, the full DTU calling potential is not yet available in most single-cell datasets. Tagged-end sequencing protocols only capture or amplify fragments originating from the 5′ or 3′ end of the cDNA. Due to this priming bias, some transcript differences are less likely or impossible to find. This effect is more severe for a gene’s transcripts, if structural differences are located in the opposite direction of the specific protocol. E.g. DTU for isoforms, where the only difference is an exon-skipping event near the 3′ end, are probably not detectable in 5′ sequenced data. Notably, this limitation only impacts the Type II error of the ability to detect DTU effects. There is no effect on positive results, i.e. found significant DTU genes and transcripts are not affected. Thus, only the sensitivity is lowered for such a dataset, not the specificity or precision. DTUrtle introduces a novel scoring scheme, the so called priming bias detection probability, to assess which transcripts might be most affected by this bias in the DTU calling process. The detection probability allows to estimate if a potential DTU effect is not present (no effect found, but high detection probability) or if it might be missed because of the tagged-end limitation (no effect found, but also low detection probability). With this score, we were able to show, that the majority of transcript isoforms is not affected by a priming bias, in the Supporting datasets. Thus, the effect size of the tagged-end limitation might be generally lower than commonly assumed. We also showed, that this novel scoring scheme works as expected, and DTU genes and especially transcripts show a higher detection probability than the baseline.
Nonetheless, we hope upcoming full-length single-cell RNA-seq protocols will alleviate this limitation. Alternatively, a potential priming bias could be reduced by a bias aware quantifier, which adjusts the likelihood in the read-to-transcript attribution process with the relative transcript mapping position.
Future work could extend DTUrtle to incorporate additional DTU calling methods, for example a method to account for the inferential variance of the quantification step. An additional DTU calling method might also be able to handle more complex study designs than the currently supported case-control design. For a substantiated decision, which of the recently developed DTU analysis methods would be the best addition, further research is necessary.
Finally, we advocate to perform a DTU analysis alongside a DGE analysis, to fully utilize the gene-level and transcript-level information of an RNA-seq dataset. If transcript-level data are available, no additional pre-processing steps are necessary to perform a DTU and DGE analysis in parallel, as shown by DTUrtle.
5 Supporting data
The datasets supporting the results of this article are available in the Gene Expression Omnibus (GEO) repository:
Hoffman et al. (2020) human bulk RNA-seq: GSE141834—samples GSM4213967, GSM4213968, GSM4213969, GSM4213973, GSM4213974 and GSM4213975.
Tabula Muris (Schaum et al., 2018) mouse single-cell RNA-seq (10× Chromium): GSE109774—samples GSM3040910 and GSM3040911.
Wuidart et al. (2018) mouse single-cell RNA-seq (Smart-seq2): GSE110351—all samples .
Financial Support: This work was supported by the EU grant Horizon2020 MDS-RIGHT (grant no. 634789).
Conflict of Interest: none declared.
References
Babraham Bioinformatics Trim Galore. https://github.com/FelixKrueger/TrimGalore.
Pennisi,E. (

