


Abstract
A major goal of personalized medicine in oncology is the optimization of treatment strategies given measurements of the genetic and molecular profiles of cancer cells. To further our knowledge on drug sensitivity, machine learning techniques are commonly applied to cancer cell line panels.
We present a novel integer linear programming formulation, called MEthod for Rule Identification with multi-omics DAta (MERIDA), for predicting the drug sensitivity of cancer cells. The method represents a modified version of the LOBICO method and yields easily interpretable models amenable to a Boolean logic-based interpretation. Since the proposed altered logical rules lead to an enormous acceleration of the running times of MERIDA compared to LOBICO, we cannot only consider larger input feature sets integrated from genetic and molecular omics data but also build more comprehensive models that mirror the complexity of cancer initiation and progression. Moreover, we enable the inclusion of a priori knowledge that can either stem from biomarker databases or can also be newly acquired knowledge gathered iteratively by previous runs of MERIDA. Our results show that this approach does not only lead to an improved predictive performance but also identifies a variety of putative sensitivity and resistance biomarkers. We also compare our approach to state-of-the-art machine learning methods and demonstrate the superior performance of our method. Hence, MERIDA has great potential to deepen our understanding of the molecular mechanisms causing drug sensitivity or resistance.
The corresponding code is available on github (https://github.com/unisb-bioinf/MERIDA.git).
Supplementary data are available at Bioinformatics online.
1 Introduction
Cancer is a heterogeneous class of diseases that is characterized by the so-called ‘Hallmarks of Cancer’ (Hanahan and Weinberg, 2011). This heterogeneity can be observed on different levels: in between different patients (inter-patient heterogeneity), in between different tumors (inter-tumor heterogeneity) and even within the same tumor (intra-tumor heterogeneity). This heterogeneity of tumors poses a challenge to cancer therapy optimization. In large scale projects such as ‘The Cancer Genome Atlas’ program, cancer cells from human tumors were genetically and molecularly profiled to further our understanding of cancer development and treatment (Campbell et al., 2020). While this has proven extremely useful for various purposes, the elucidation of predictive biomarkers for drug sensitivity has mainly focused on analyses of large cancer cell line panels (Costello et al., 2014; Iorio et al., 2016; Sharma et al., 2010). These panels have been exposed to a variety of drugs. Two of the largest publicly available cancer cell line panels to date are the ‘Genomics of Drug Sensitivity in Cancer Database’ (GDSC) and the ‘Cancer Cell Line Encyclopedia’(CCLE)/‘Cancer Therapeutics Response Portal’(CTRP) (Ghandi et al., 2019; Iorio et al., 2016; Rees et al., 2016). These databases provide molecular profiles as well as pharmacological data of cell lines.
Machine learning methods have been applied to these panels in order to (i) predict the drug response for cell lines and (ii) extract features that link molecular characteristics to the drug response. These two tasks are referred to as prediction and inference, respectively. Ideally, a model offers both: good predictive performance and well interpretable prediction models. A common drawback of many machine learning methods is that their results are difficult to interpret. Neural networks for example often deliver well performing models in terms of statistical performance measures. However, the interpretation of complex prediction models with a high number of features is often difficult.
In contrast, methods such as k-TSP (Tan et al., 2005), MOCA (Masica and Karchin, 2013) and LOBICO (Knijnenburg et al., 2016) aim at delivering models that give interpretable rules as output. The k-TSP approach relies on observed rank differences of gene expression values to formulate rules for drug sensitivity prediction. In contrast, MOCA uses copy number variations, mutations and discretized gene expression values to iteratively combine them into one many-gene-marker of drug response using a forward feature selection based on a statistical test. LOBICO (Knijnenburg et al., 2016) pursues a similar strategy. In this approach, an integer linear programming (ILP) formulation for the synthesis of a Boolean function has been proposed to tackle the drug sensitivity prediction problem. The output of this ILP is a logic formula in disjunctive normal form that represents a rule for the prediction of sensitivity to a particular drug. Due to its runtime, LOBICO is only suitable to construct models with a relatively small number of features.
While easily interpretable models, which reflect the molecular mechanisms of drug sensitivity, are desirable, overly small models may not suffice to mirror the complex molecular mechanisms that induce cancer progression. Hence, larger, but yet easily interpretable models are required for the analysis of cancer cell sensitivity.
To this end, we have developed MEthod for Rule Identification with multi-omics DAta (MERIDA), a new ILP approach that is based on the LOBICO method. Similar to LOBICO, our ILP relies on binarized input and output features and generates a logic formula, which can be interpreted as a rule that specifies under which conditions a cell line is sensitive or resistant to a drug. Due to our new ILP formulation, which represents a restricted Boolean function synthesis problem, the runtime of our method is considerably reduced in comparison to LOBICO (up to a factor of 1000). Therefore, MERIDA is able to consider more input features and build more comprehensive models in general. Moreover, we investigated how the integration of a priori knowledge into the Boolean formulas affects the prediction quality of our approach. To this end, we leveraged information from various well-established cancer-related databases: IntOGen (Gonzalez-Perez et al., 2013), COSMIC (Tate et al., 2019), CIViC (Griffith et al., 2017), OncoKB (Chakravarty et al., 2017) and the Cancer Genome Interpreter (CGI) (Tamborero et al., 2018). Due to the improved runtime, MERIDA can be iteratively applied, i.e. biomarkers (features) detected in previous runs can be integrated as prior knowledge into the next run. Our results show that the iterative approach does not only improve the statistical performance but also identifies more comprehensive sets of putative sensitivity biomarkers.
Amongst others, we applied MERIDA to all mTOR pathway inhibitors of the GDSC database and report their performance in terms of standard statistical performance measures in a 5-fold cross validation as well as on a test set. We demonstrate that the performance of our method is similar or superior to LOBICO. Moreover, we show that MERIDA clearly outperforms standard machine learning approaches such as random forests (Breiman, 2001) and k-nearest neighbors (Fix and Hodges, 1952). In addition, our models can give novel insights into the molecular mechanisms causing sensitivity or resistance to anti-cancer compounds.
2 Materials and methods
2.1 Data
For our analyses, we use data from the GDSC database, a large cancer cell line panel that has been thoroughly molecularly profiled and screened with hundreds of different anti-cancer compounds. Based on the used drug sensitivity assay, two sub datasets can be distinguished: GDSC1 (resazurin assay and Syto60 assay) and GDSC2 (CellTitreGlo). We downloaded the pre-processed mutation, copy number variation (CNV), gene expression and drug sensitivity data from the GDSC website. Further information on the data can be found in Supplementary Material S1.
Information on predictive biomarkers of drug sensitivity as well as information on the oncogenicity of mutations was downloaded from the CIViC (Griffith et al., 2017), OncoKB (Chakravarty et al., 2017), COSMIC (Tate et al., 2019) and CGI (Tamborero et al., 2018) websites. A list of general cancer driver genes was retrieved from the IntOGen (Gonzalez-Perez et al., 2013) website and a specific list of genes affected by copy number alterations was obtained from the Supplementary Material of Sanchez-Vega et al. (2018).
2.2 Data processing
In the following, the processing of the data will be briefly summarized. A more detailed description is given in Supplementary Material S1. In particular, we will outline how we obtain binarized input and output features for our method. An overview of the required steps is provided in Figure 1.
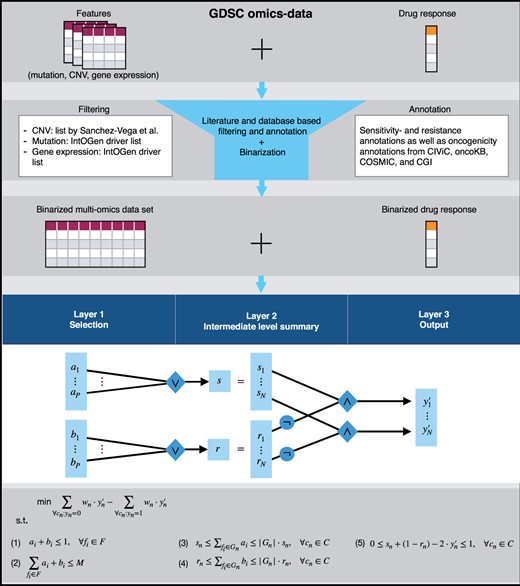
This figure depicts the processing pipeline and a summary of the ILP formulation. We focus on cancer-associated genes using literature annotations. In addition, we annotate the mutation and CNV data with oncogenicity information as well as sensitivity/resistance information and binarize all features appropriately. Our ILP formulation then determines a set of sensitivity-associated and a set of resistance-associated alterations for prediction by deriving a logic rule from the binarized features
Response vector: For each anti-cancer compound, we generate one binarized drug response vector that specifies for each cell line whether it is sensitive (1) or resistant (0). We obtain this vector by binarizing the logarithmized IC50 values provided by the GDSC database through usage of a threshold that divides the cell lines into sensitive and resistant ones. To guarantee comparability of the results to LOBICO, we calculate this threshold with the same procedure as described by Knijnenburg et al. using a custom R-script.
Input feature matrix: The binarized input feature matrix of dimension N × P contains gene expression, CNV and mutation features. The N rows of this matrix correspond to the cell lines and the P columns to the features, i.e. each feature is represented by a binary vector of all considered cell lines.
Gene expression features: The gene expression features of the matrix are obtained by performing the following steps:
We consider only expression data of genes that belong to the IntOGen cancer driver gene list (459 genes).
For each of the selected genes, two binary vectors are added to the feature matrix: one binary vector that specifies whether the gene is up-regulated in the considered cell lines (1) or not (0) and one binary vector that specifies whether the gene is down-regulated (1) or not (0). The binarization was accomplished by the calculation of gene-wise z-scores and selection of the top 5% up- and down-regulated cell lines per gene. Note that we used only the training cell lines to determine the sample mean and standard deviation and also use these values to obtain the z-score for the test set.
In summary, we obtain up to 918 gene expression features.
Copy number features: For the GDSC CNV data, we consider only genes that are listed in the copy number driver list by Sanchez-Vega et al. (2018) (140 genes). For each of these genes, two binary feature vectors are added to the feature matrix: one vector that represents for each cell line whether a copy number gain is present and one vector for copy number loss. Hence, this leads to a CNV feature list with up to 280 elements.
Mutation features: There exists a tremendous amount of putative cancer-associated mutations. Using all these mutations as single features in the matrix would lead to a very sparse, high dimensional matrix on which statistical learning might be difficult. In order to counteract this issue, we reduce the size of the matrix. First, we consider only genes contained in the IntOGen driver list (459 genes) and gather all mutations assigned to these genes in a filtered mutation list. For each such gene, we combine mutations with similar functional annotations into four composite feature vectors that represent the four oncogenicity states: oncogenic gain-of-function, oncogenic loss-of-function, neutral and status unknown. We use the annotations from CGI, CIViC, COSMIC and OncoKB to obtain the composite features by performing the steps described below:
We annotate the alterations from the filtered mutation list with an oncogenicity status from the four mentioned states.
Afterwards, all mutations with the same annotation in one particular gene are merged into one binary feature vector. Consequently, the resulting feature vector contains a 1 iff at least one of the alterations is present in a cell line and 0 otherwise.
Hence, we consider up to 1836 mutation features.
Integration of a priori knowledge: The previous explanations outlined how a matrix for a drug without a priori knowledge is built. If prior knowledge on predictive biomarkers for sensitivity or resistance is available, we perform additional processing steps. We first define a sensitivity status for the features in the filtered CNV and mutation lists. This sensitivity status can have one of the following states: sensitive (alteration is predictive of positive drug response), resistant (alteration is predictive of negative drug response) and status unknown. For all alterations with unknown status, we perform the construction of the feature matrix as described above. However, all sensitive alterations can be merged into one binary feature vector that contains a 1 iff at least one of the alterations is present in the considered cell line and 0 otherwise. Analogously, a composite vector for the resistant alterations is built.
Model training and testing: For each drug, we divide the whole dataset into a test set (20% of the samples) and a training set (80% of the samples) on which the 5-fold cross validation is performed. The test set was chosen randomly while preserving the underlying tissue distribution (stratified selection with respect to cancer tissue). In general, our training matrices consist of approximately 650 cell lines and 1500 features on average (see Supplementary Material S1 for the exact dimensions).
Note that we investigate only cell lines with full information for all considered datasets.
2.3 MEthod for Rule Identification with multi-omics DAta
Similar to LOBICO (Knijnenburg et al., 2016), the goal of our novel approach is to generate an interpretable logic rule for each drug that explains drug sensitivity and resistance. However, by reducing the runtime, we enable the inclusion of far more input features and derive larger rules. In addition, we provide the possibility to include prior knowledge, which increases the comprehensiveness of the output rules even more. To achieve these goals, we formulate an ILP that aims at identifying two sets of features, a first set that causes or increases sensitivity and a second set that causes or increases resistance to a drug. In the following, we will briefly explain the objective function and the constraints of the ILP summarized in Figure 1.
The weight wn corresponds to the absolute difference of the logarithmized IC50 value Yn from the threshold t normalized on a per class basis (classes: sensitive, resistant) such that the sum of all weights within the same class equals 0.5.
MERIDA determines the sensitivity vector by deriving a logical rule that consists of two main parts: a selection of sensitivity-inducing features and a selection of resistance-inducing features that together determine the drug response. We will first explain how selection variables for the features can be defined. Afterwards, we will describe how these can be combined into sensitivity- and resistance-associated variables.
Note that M is the only parameter of our model that has to be determined via hyperparameter tuning, e.g. through a cross validation.
Moreover, we offer the possibility to integrate a priori knowledge (predictive biomarkers) into the ILP formulation. This a priori knowledge imposes constraints on the corresponding selection variables, e.g. if it is known that a certain mutation feature fi is responsible for the sensitivity to the investigated drug, ai will be set to 1.
Here, Gn is the set of features that is altered in cell line n. The logical OR ensures that sn is equal to 1 if at least one sensitivity-associated alteration is contained in Gn, i.e. .
Here, will be equal to 1 iff the cell line n is predicted to be sensitive and 0 otherwise.
3 Results
The number of known cancer-associated genetic and molecular variants is enormous (Chakravarty et al., 2017; Gonzalez-Perez et al., 2013; Griffith et al., 2017; Tamborero et al., 2018; Tate et al., 2019). Apparently, they do not only determine cancer development and progression but also influence therapy responsiveness. Hence, our major goal was the development of an efficient approach that is able to handle this variety of features and also to generate comprehensive rules explaining drug sensitivity and resistance. For this purpose, we developed MERIDA, a novel ILP formulation for drug sensitivity prediction in cancer. While our approach is similar to LOBICO (see Supplementary Material S3 for a detailed comparison), our method has a significantly reduced runtime, which allows MERIDA to handle large feature sets and construct comprehensive rules. In addition to that, MERIDA offers the possibility to include a priori knowledge.
In the following sections, we will first discuss the runtime advantages of our method in comparison to LOBICO. Then, we will examine the statistical performance of both methods on 10 different drugs. We also show that our method performs significantly better than state-of-the-art machine learning methods such as random forests and k-nearest neighbors using 41 drugs. Lastly, we show that MERIDA is able to identify biomarkers for drug sensitivity.
3.1 Runtime analysis
The runtime experiment was conducted on a small dataset with 350 cell lines and a varying input matrix size in the range from 25 to 400 features (mutation features only) with a stepsize of 25. Each experiment was repeated 10 times if not prohibited by a high runtime. The calculations were performed on a compute server with four Intel(R) Xeon(R) CPU E5-4657L v2 processors with 2.40 GHz clock rate. For the ILP formulation and solution, IBM ILOG CPLEX Optimization Studio V12.6.2 for C++ was employed. CPLEX was run using 32 cores and a deterministic parallel mode. Further information on the preparation of the experiment is given in Supplementary Material (see Supplementary Material S2).
We compared LOBICO and MERIDA with respect to the number of selectable features and the different weight functions. In particular, we varied the number of selectable features, i.e. the model parameter M of MERIDA (cf. Section 2.3) and the model parameters K and M of LOBICO. Here, K is the number of disjunctive terms and M the number of elements per disjunctive term as defined by Knijnenburg et al. In Figure 2, we show the results of the 4-feature sized model () for LOBICO, which is the largest model with both M > 1 and K > 1 that we could solve in a reasonable amount of time. In Supplementary Material, further parameter combinations and the influence of the two model parameters of LOBICO are shown (cf. Supplementary Material S2).
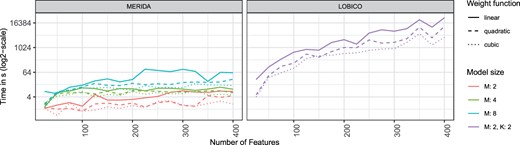
The runtime analysis was conducted on a small dataset (350 samples) with varying feature set sizes in the range from 25 to 400 features and each experiment was repeated 10 times if not prohibited by high runtime. The figure depicts the mean runtime of LOBICO and MERIDA for different numbers of input features, weight functions and hyperparameters
In general, MERIDA (linear weight function) is considerably faster than LOBICO (linear weight function). On average across the different input matrix sizes (25–400 features with stepsize of 25), MERIDA can obtain a 4-feature sized model (M = 4) 3.61 times faster than LOBICO’s model, 71.79 times faster than LOBICO’s model and 641.97 times faster than LOBICO’s model. By using the quadratic or cubic function for MERIDA, further speed-ups up to a factor of 1147.6 can be achieved (cf. Supplementary Material S2). The most extreme values for speed-up can be observed when comparing LOBICO’s model (linear weight function) with MERIDA’s M = 4 model (cubic weight function) for the input matrix size of 400 features. Here, a speed-up factor of 5775 could be achieved. Hence, we can consider more features in the input matrix and construct larger models using our ILP formulation. Moreover, since MERIDA has only one hyperparameter (cf. Section 2.3), fewer models need to be fit during tuning in comparison to LOBICO with two hyperparameters.
As expected, the runtime is dependent on the used weight function. The original linear weight function of LOBICO consistently has the highest runtime for all tested parameter combinations. For a 4-feature sized model, the runtime of LOBICO can on average be accelerated by a factor of 2.17 and 3.47 by using a quadratic or cubic weight function, respectively. For MERIDA, the use of a quadratic or cubic weight function is also advantageous. MERIDA with a quadratic or cubic weight function is on average 1.35 and 1.65 times faster, respectively. Furthermore, the runtime of MERIDA is rising more slowly with the number of features for all used weight functions.
For MERIDA, we additionally analyzed if the runtime can be improved by iteratively increasing the model sizes, i.e. we add features identified in previous runs of MERIDA as fixed a priori knowledge to the next model to be fitted. By the iterative application, we can generate more comprehensive models with larger values of M significantly faster than in one shot (by a factor of 25 on average). In addition, the resulting models deliver similar features compared to the models generated in one shot. The results and a detailed explanation of this analysis are presented in Supplementary Material S2.
3.2 Statistical performance analysis
In order to show that MERIDA gains information on mechanisms that determine drug sensitivity and resistance of cell lines, we concentrate our analyses on a specific drug class: mTOR pathway inhibitors. We focused on the mTOR pathway because it plays a pivotal role in cancer development and progression (Sanchez-Vega et al., 2018; Vogelstein et al, 2013). Moreover, there is already comprehensive knowledge on predictive biomarkers for some of the mTOR inhibitors. Due to our ILP formulation, we can directly integrate this information into our models. We predicted the drug response of all mTOR pathway inhibitors in the GDSC dataset using our MERIDA method (see Supplementary Material S2 for detailed results). In the following, we present the results for 6 mTOR inhibitors: Rapamycin (GDSC2), Temsirolimus (GDSC1), Omipalisib (GDSC1), AZD8055 (GDSC1), Dactolisib (GDSC2) and Voxtalisib (GDSC1).
For most of the drugs in the GDSC dataset and also for all of the drugs mentioned above except for Omipalisib, there is an unfavorable ratio between sensitive and resistant cell lines (see Supplementary Figs S1 and S2 in Supplementary Material S1). More precisely, with an average sensitive-to-resistant ratio of 1:10 per drug, there are far more resistant than sensitive cell lines. This poses a challenge to statistical learning methods for balancing the statistical sensitivity and specificity measures and hence also for the identification of drug sensitivity-associated factors. To investigate the performance on a more balanced dataset, we decided to additionally analyze the four drugs with the highest number of sensitive cell lines: the p53 (R175) mutant reactivator NSC319726 (GDSC1), the rRNA synthesis inhibitor CX-5461 (GDSC1), the selective PARP1/2 inhibitor Niraparib (GDSC2) and the PARP inhibitor Talazoparib (GDSC2) (cf. Supplementary Figs S1 and S2 in Supplementary Material S1).
In general, we prepared our multi-omics datasets as described in Section 2.2, which means that we distinguish between drugs with and without a priori knowledge. For drugs without prior biomarker knowledge, we constructed one input feature matrix and consequently train LOBICO and MERIDA on this matrix (Setting 1). For drugs with prior knowledge (Rapamycin, Temsirolimus, Dactolisib, CX-5461 and Talazoparib), we construct two feature matrices, one without a priori knowledge and one with a priori knowledge, which includes the sensitivity/resistance biomarkers as composite features (cf. Section 2.2). A list of the included biomarkers for each drug can be found in Supplementary Material (cf. Supplementary Material S1). For the five drugs with a priori knowledge, we then trained and tested MERIDA in several settings:
Setting 1: the a priori knowledge is not included, i.e. the matrix without a priori knowledge is used
Setting 2: the information about the sensitivity biomarkers is integrated in the input feature matrix as one specific composite feature (cf. Section 2.2) and the value of the corresponding ILP feature variable is fixed to 1
Setting 3: the sensitivity information is integrated in the input feature matrix but the value of the corresponding feature variable is determined by the ILP
For the five drugs with a priori knowledge, we trained LOBICO only in one setting (Setting 3) since calculating models for LOBICO was very time-consuming and including fixed a priori knowledge in the ILP formulation is theoretically possible, however, not implemented. For all of the above mentioned settings, we investigated all considered weight functions. Note that the original LOBICO function uses linear weights only.
In Figure 3, we present the averaged statistical performance across (A) all drugs without a priori knowledge and (B) with a priori knowledge for LOBICO and MERIDA. In Supplementary Material S2, we also present the results for each drug separately. A direct comparison between MERIDA and LOBICO in Settings 1 and 3 shows that MERIDA has a higher average sensitivity across all drugs and lower average specificity. Hence, MERIDA results in a more balanced overall model fit, which is of particular importance for highly unbalanced datasets with a low amount of true positives.
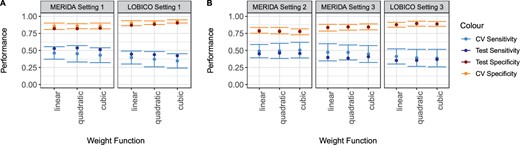
In this figure, we present the averaged statistical performance across all drugs (A) without a priori knowledge and (B) with a priori knowledge. Shown is the mean performance and standard deviation during cross validation as well as the test error
The inclusion of the sensitivity biomarkers (Setting 2) should in general improve the sensitivity of MERIDA even more. Actually, the a priori knowledge improves the average CV sensitivity while decreasing CV specificity. The average test sensitivity also slightly increases. When considering the test sensitivity for the specific drugs, we observed that it improved for Rapamycin, CX-5461 and Talazoparib while it did not for Temsirolimus and Dactolisib.
We also tested whether the performance can be improved when integrating the most informative features from previously calculated models as a priori knowledge into new models. Here, we added the features from the current best model as a priori knowledge to the next model to be fitted. To this end, we fixed the corresponding ILP variables to 1 and then solved the ILP again. The best model was selected based on Youden’s J (sensitivity + specificity - 1). We observe that by iterative repetition of this process, the performance can be improved for the tested drugs compared to the first application of our method (cf. Supplementary Fig. S35 in Supplementary Material S2). For example, the model after the fourth iteration has the best performance for Niraparib across all tested settings.
In terms of the different weight functions, we could not identify one weight function with the overall best performance. Considering the fact that the cubic and quadratic weight function usually have a significantly lower runtime, it is in general advantageous to use one of these.
We also compared MERIDA to random forests and k-nearest neighbors using 41 drugs including all mTOR inhibitors (see Supplementary Material S2). Our results for random forests and k-nearest neighbors confirm that standard machine learning approaches do not really account for the class imbalance and generate models with a high specificity and a very low sensitivity (see Supplementary Material S2).
In order to investigate the performance of MERIDA for specific sub-groups of cell lines, we carried out analyses for two sub-groups with a relatively high number of cell lines: haematological cancer cell lines and non-haematological cancer cell lines (cf. Supplementary Material S2). As expected, the statistical performance decreased for both groups in comparison to the pan-cancer analysis, most likely because of the reduced number of cell lines.
3.3 Selected biomarkers
When analyzing the similarity of the selected feature sets between LOBICO and MERIDA for each drug separately, it becomes apparent that these sets resemble each other (see Supplementary Fig. S30 and Supplementary Table S18 in Supplementary Material S2) with a significant overlap (Fisher’s P-value < 0.05) for each drug. However, since MERIDA allows larger models, it detects additional biomarkers that may have an influence on drug sensitivity. We also analyzed the similarity of the models between the different weight functions and observed that the selected feature sets are very similar (cf. Supplementary Figs S31 and S32 and Supplementary Tables S16 and S17 in Supplementary Material S2).
Interestingly, neither LOBICO nor MERIDA selected the feature with the a priori knowledge information from the sensitivity biomarkers directly in Setting 3, which indicates that the known sensitivity biomarkers are less important than the selected features during model training (cf. Supplementary Tables S14 and S15 in Supplementary Material S2 for all rules). To verify the relevance of the features, we sorted the cell lines from most sensitive to most resistant for each drug and indeed find that the selected features are more strongly concentrated at the top of the sorted cell line lists than the literature biomarkers (see Supplementary Figs S36–S42 in Supplementary Material S2). Furthermore, we find that some predictive biomarkers from literature seem to be more informative than others. For example, the well-studied PTEN loss and certain PTEN loss-of-function mutations seem to be rather predictive for the sensitivity of Rapamycin, while other features such as STK11 loss or FBXW loss are predominantly present in the resistant group although there exists literature evidence that these alterations support sensitivity as well (Mao et al., 2008; Shaw et al., 2004). There are various explanations for this phenomenon: There can be differences in the strength of the predictive biomarkers as a result of differing roles of distinct biomarkers in biological pathways. Furthermore, the cell lines are usually affected by various mutations that typically influence several biological pathways, which can in turn downgrade the importance of a single predictive biomarker. However, it can still be important to include these biomarkers into a model to compare the newly detected ones with the literature biomarkers.
One sensitivity feature that was consistently selected across almost all mTOR inhibitors is low expression of the tight junction protein 1 (TJP1), a member of the membrane-associated guanylate kinase (MAGUK) family of proteins. It plays an important role in cell-cell communication and it has recently also been shown to be implicated in anti-cancer drug sensitivity (Lee et al., 2020).
To test whether this observation is specific to the drugs we investigated or a general feature of sensitive cell lines, we performed an enrichment analysis with the GeneTrail 3 C++ library (Gerstner et al., 2020) as follows: for each drug, we sorted the cell lines by decreasing sensitivity, i.e. by increasing logarithmized IC50 values. As a category, we define all cell lines for which TJP1 expression is low (same z-score-based definition as described in Section 2.2) and carry out an enrichment analysis, i.e. for each drug, we test for an enrichment of this category at the top or bottom of the cell line list using a Kolmogorov-Smirnov test. Astonishingly, we thereby identified low expression of TJP1 as a key sensitivity determinant for the vast majority of drugs (258/320 drugs in GDSC1, 156/175 drugs in GDSC2).
We repeated this type of analysis for all of the selected gene expression features and could identify several of the selected features as being also of broad importance to a variety of drugs (for further details and the results of this analysis, please refer to Supplementary Tables S9 and S10 in Supplementary Material S2). For example, NCKAP1 low expression (239/320 drugs in GDSC1, 156/175 drugs in GDSC2) and PTPRF low expression (205/320 drugs in GDSC1, 150/175 drugs in GDSC2) also seem to influence the sensitivity to various drugs.
NCKAP1, whose low expression was detected as sensitivity-associated for AZD8055 by our analysis, is part of the WAVE complex that regulates actin filament organization. Moreover, NCKAP1 has been shown to promote tumor progression in specific mice melanoma cells (Swaminathan et al., 2021). With this potential oncogenic role, NCKAP1 expression might be a useful marker for the malignancy grade of cell lines that influences the susceptibility to drug treatments.
Similarly, PTPRF, which MERIDA identified as a sensitivity factor of Rapamycin, was recently found to promote tumor progression by activation of WNT signaling in colorectal cancer (Gan et al., 2020). Thus, low expression of PTPRF could classify cell lines as less malignant and as a consequence might improve treatment outcome prediction.
For AZD8055, MERIDA found that expression of FKBP5 might determine the sensitivity toward this particular drug. For Rapamycin, it is well-known that FK506-binding proteins, to which FKBP5 belongs, are required for the formation of the complex between Rapamycin and the FRB-domain of mTOR (Hausch et al., 2013). Although AZD8055 does not bind to the FRB-domain but is an ATP-competitive inhibitor, it might be possible that the presence of FKBP5 enhances the inhibitory effect or that AZD8055 also interacts with FK506-binding proteins to exert its inhibitory effect. However, this requires further experimental validation.
4 Discussion
A major goal of personalized medicine in cancer is the optimization of treatment strategies given measurements of different genetic and molecular characteristics of cancer cells. Here, the cancer heterogeneity poses a major challenge to statistical learning methods. Therefore, methods for the prediction of drug response should address this heterogeneity while still providing easily interpretable results.
To this end, we have developed MERIDA, a novel statistical learning approach for drug sensitivity prediction in cancer. MERIDA is derived from the ILP formulation of LOBICO (Knijnenburg et al., 2016). Our modified ILP formulation, which represents a simplified Boolean function synthesis problem, reduces the space of allowed logic combinations and, hence, accelerates the runtime of the corresponding branch-and-cut algorithm tremendously (up to a factor of 1000). In addition, we proposed two different weighting schemes as importance measures for the cell lines in the objective function, which both improved the runtime of MERIDA (and LOBICO) even further. Despite the reduced space of logic combinations, the statistical performance of MERIDA is similar or superior to LOBICO. In particular, MERIDA achieves superior results with respect to the statistical sensitivity measure, which is of particular importance for unbalanced datasets with a low amount of true positives. Amongst others, for the small models LOBICO is able to fit, MERIDA selects almost identical feature sets as LOBICO. Due to the reduced runtime, MERIDA, however, is able to handle considerably larger input feature sets and to construct larger models.
We also investigated another option for improving the prediction models: the integration of prior knowledge. While this could be implemented for any logical model, the systemic integration of predictive biomarkers has not been conducted for previously published logical models. This knowledge can stem from biomarker databases or can even be newly acquired by our own method. By using knowledge from biomarker databases, we could improve the statistical performance for some of the drugs. With growing knowledge on predictive biomarkers, these may play a more important role. In addition, we could enhance the statistical performance by iteratively running our new method and adding biomarkers (features) identified by previous runs to the next model. Here, our results indicate that the iterative application provides similar models compared to the one-shot approach with a significant speed-up.
Nevertheless, the statistical performance should still be improved. An important factor that influences the performance is the choice of the used features. Feature selection or dimension reduction is usually indispensable to counteract the curse of dimensionality present for such large multi-omics datasets as provided by the GDSC. We decided to do a literature-driven feature selection with curated cancer driver lists to focus on alterations that are most likely involved in therapeutic responsiveness. However, other alterations may also play a role in drug response. Here, MERIDA’s favorable runtime can also facilitate the investigation of additional feature types such as epigenetics data (e.g. DNA methylation or histone modifications) or cancer-specific splicing variants in future work.
We verified the relevance of the newly detected biomarkers with enrichment analyses. Interestingly, many of the selected features seem to have a strong influence on the drug response of various drugs. These compelling results also motivate us to select feature sets using enrichment techniques in ongoing research.
The logical models discussed in this manuscript can be used to identify effective drugs for a given cell line or tumor. However, a central task in personalized medicine is to find the best drug or a suitable combination of drugs for a specific cell line. To this end, the effective drugs have to be prioritized. In ongoing research, we investigate the ability of statistical learning methods to prioritize different drugs using regression approaches based on continuous drug sensitivity values, such as IC50 values.
To conclude, we present MERIDA, a novel and fast method for the prediction of drug response. We show that its performance is similar or superior to the related LOBICO method. In addition, we demonstrate that our models can give novel insights into the molecular mechanisms causing sensitivity or resistance to anti-cancer compounds.
Funding
Funding for open access charge: Internal funds of Saarland University.
Conflict of Interest: none declared.

