


Abstract
Phosphorylation is one of the most studied post-translational modifications, which plays a pivotal role in various cellular processes. Recently, deep learning methods have achieved great success in prediction of phosphorylation sites, but most of them are based on convolutional neural network that may not capture enough information about long-range dependencies between residues in a protein sequence. In addition, existing deep learning methods only make use of sequence information for predicting phosphorylation sites, and it is highly desirable to develop a deep learning architecture that can combine heterogeneous sequence and protein–protein interaction (PPI) information for more accurate phosphorylation site prediction.
We present a novel integrated deep neural network named PhosIDN, for phosphorylation site prediction by extracting and combining sequence and PPI information. In PhosIDN, a sequence feature encoding sub-network is proposed to capture not only local patterns but also long-range dependencies from protein sequences. Meanwhile, useful PPI features are also extracted in PhosIDN by a PPI feature encoding sub-network adopting a multi-layer deep neural network. Moreover, to effectively combine sequence and PPI information, a heterogeneous feature combination sub-network is introduced to fully exploit the complex associations between sequence and PPI features, and their combined features are used for final prediction. Comprehensive experiment results demonstrate that the proposed PhosIDN significantly improves the prediction performance of phosphorylation sites and compares favorably with existing general and kinase-specific phosphorylation site prediction methods.
PhosIDN is freely available at https://github.com/ustchangyuanyang/PhosIDN.
Supplementary data are available at Bioinformatics online.
1 Introduction
Post-translational modifications (PTMs) are vital mechanisms to enable proper and specific protein functions by proteolytic cleavage or addition of a modifying group covalently to amino acids (Mann and Jensen, 2003). Among the over 200 different types of PTMs that have been identified (Duan and Walther, 2015), one of the most studied is phosphorylation on serine (S), threonine (T) and tyrosine (Y), which plays a pivotal role in various cellular processes such as signal transduction, DNA repair, cell cycle control and metabolism (Ma et al., 2005; Wood et al., 2009). There are evidences showing that over one-third of proteins can be phosphorylated and abnormal phosphorylation is related to many human diseases (Cohen, 2002).
Due to the importance of phosphorylation in understanding disease mechanisms and guiding drug design, many experimental methods are introduced for identification of phosphorylation sites, such as low throughput 32P-labeling (Aponte et al., 2009) and high throughput mass spectrometry (Beausoleil et al., 2006). However, these experimental identification methods are labor-intensive and time-consuming (Wen et al., 2016). Therefore, it is very important to develop computational approaches with advantages of low cost and fast speed. For that reason, a large number of computational prediction methods have been proposed for identification of phosphorylation sites, and most of them are based on machine learning technique. For example, Xue et al. (2008) use a Markov cluster algorithm to develop a kinase-specific phosphorylation site prediction approach, Group-based Prediction System (GPS), in which the amino acid substitution matrix is used as the input features. Gao et al. (2010) propose an approach called Musite, which uses Support Vector Machine with amino acid frequencies as well as protein disorder scores and local protein sequences similarities. Li et al. (2018) design a logistic regression-based approach, Quokka, which adopts a variety of sequence scoring functions to predict kinase-specific phosphorylation sites.
Recently, as an emerging machine learning technique, deep learning has brought a significant breakthrough in protein phosphorylation site prediction (Wang et al., 2017; Xu et al., 2020). For example, Wang et al. present Musitedeep (Wang et al., 2017), the first deep learning phosphorylation site prediction method, which takes protein sequences as inputs and uses a multi-layer convolutional neural network (CNN) architecture with attention mechanism. Subsequently, Wang et al. design CapsNet (Wang et al., 2019) that has a two-layer CNN followed by one convolutional capsule layer and one fully connected layer for further sequence feature extraction. In addition, we explore CNN architectures for phosphorylation site prediction and propose DeepPhos (Luo et al., 2019), which uses densely connected CNN (DCCNN) blocks with different filter sizes and windows to learn multiple representations of sequences. The test results show that these carefully designed CNN architectures are superior to traditional phosphorylation site prediction methods.
Although aforementioned deep learning methods have achieved promising prediction performance, there are still some issues to address. First, despite of its powerful capability of learning local sequence patterns, it has been reported that CNN may not capture enough information about long-range dependencies between residues in a protein sequence (Hanson et al., 2017; Uddin et al., 2020), which however is beneficial for phosphorylation site prediction since protein phosphorylation can be affected by long-range regions far away from phosphorylation sites (Jung et al., 2010; Li et al., 2010). As a result, it is crucial to design more sophisticated deep learning architectures that can capture not only local patterns but also long-range dependencies from protein sequences. Second, existing deep learning architectures for phosphorylation site prediction only make use of sequence information. Indeed, it has been shown that sequence information is often insufficient to reproduce the substrate specificities of protein kinases (Linding et al., 2007; Song et al., 2012). On the other hand, protein–protein interactions (PPIs) can provide contextual information about additional effects in protein phosphorylation (e.g. colocalization via anchoring proteins and scaffolds) (Linding et al., 2007; Song et al., 2012), and have been proved to be complementary to sequence information with successful applications in existing phosphorylation prediction studies (Fan et al., 2014; Li et al., 2010; Linding et al., 2007; Song et al., 2012; 2017). Therefore, it is highly desirable to develop a deep learning architecture that can combine heterogeneous sequence and PPI information for phosphorylation site prediction.
In this work, we present a novel deep neural network, PhosIDN, to accurately predict protein phosphorylation sites by efficiently extracting and combining sequence and PPI information. As an integrated deep learning architecture, PhosIDN consists of three closely connected sub-networks including a sequence feature encoding sub-network (SFENet), a PPI feature encoding sub-network (IFENet) and a heterogeneous feature combination sub-network (HFCNet). SFENet incorporates DCCNN block with a self-attention module to capture not only local patterns but also long-range dependencies from protein sequences. Meanwhile, IFENet adopts a multi-layer deep neural network (DNN) to extract PPI features that are useful for predicting protein phosphorylation sites. Moreover, to effectively combine heterogeneous sequence and PPI information, HFCNet leverages a bilinear feature module to fully exploit the complex associations between sequence and PPI features, and then extracts their combined features by a multi-layer DNN. Comprehensive experiments are conducted to investigate the performance of our approach, and the evaluation results demonstrate that the proposed PhosIDN significantly improves the prediction performance of phosphorylation sites and outperforms existing general and kinase-specific phosphorylation site prediction methods.
2 Methods and materials
2.1 Benchmark dataset
In this study, we adopt a large-scale dataset (Luo et al., 2019) designed for training and evaluating deep learning models, which includes more than 160 000 experimentally verified general and kinase-specific phosphorylation sites on human proteins filtered by similarity threshold of 40% to decrease the sequence redundancy of phosphorylation proteins. Furthermore, we use the same performance evaluation strategy as in previous study (Luo et al., 2019), which randomly selects a proportion of the dataset (∼10% for general sites and ∼20% for kinase-specific sites) as independent test data and takes the rest as training and validation data. Specifically, when predicting general phosphorylation sites, we follow previous study (Wang et al., 2017) to train two deep learning models using S/T and Y sites, respectively, and then evaluate the performance of PhosIDN and compare with other prediction methods on the independent test data that contains more than 17 000 phosphorylation sites (14 360 S/T sites and 2673 Y sites) (Luo et al., 2019). When predicting kinase-specific phosphorylation sites, we train one specific prediction model for each kinase group, family, subfamily and individual kinase. The details of the number and residue type of sites in the independent test data for kinase-specific phosphorylation site prediction are shown in Supplementary Table S1.
2.2 Data representation
2.2.1 Sequence data
Given a protein sequence, we intercept a protein fragment containing a central potential phosphorylation site, and code it by one-hot encoding scheme that is widely adopted in phosphorylation site prediction (Luo et al., 2019; Wang et al., 2017). In this way, each protein fragment is encoded to a two-dimension matrix, here indicates the window size of the protein fragment and 21 is the size of the amino acid symbol dictionary (Khurana et al., 2018).
2.2.2 PPI data
In addition to protein sequences, we use PPIs from the STRING database (Damian et al., 2011). To ensure the reliability of data, we filter PPIs by confidence score of 900 and then obtain 162 927 pairs of PPIs between 13 770 human proteins. After that, by using a graph embedding strategy (Wang et al., 2016), we generate PPI embedding of size 128 for each protein. Finally, we map these proteins to UniProt identifiers using the identifier mapping provided by STRING and assign the corresponding PPI embedding to each phosphorylation protein by name matching. For phosphorylation proteins with missing PPI embeddings, we assign vectors of zeros by following previous study (Kulmanov et al., 2018).
2.3 Architecture of PhosIDN
The proposed deep learning architecture of PhosIDN is shown in Figure 1, which consists of two feature encoding sub-networks (i.e. SFENet and IFENet) and one heterogeneous feature combination sub-network, i.e. HFCNet. Specifically, SFENet and IFENet are designed to separately extract useful sequence and PPI features for predicting protein phosphorylation sites, and HFCNet is introduced to combine the outputs of SFENet and IFENet and finally generate the prediction results of phosphorylation sites. We describe each sub-network one-by-one as follows.
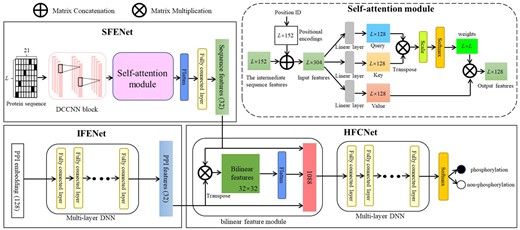
The integrated deep learning architecture of PhosIDN
2.3.1 SFENet
In SFENet, a DCCNN block is used to capture local sequence patterns, in which multiple convolutional layers are connected to each other simultaneously to enhance the flow of phosphorylation information (Luo et al., 2019). However, the convolutional layers in DCCNN block may not obtain enough information about long-range dependencies between residues in a protein sequence (Uddin et al., 2020). To address this issue, we further incorporate DCCNN block with an efficient self-attention module so that SFENet can capture not only local patterns but also long-range dependencies from protein sequences. More details of this sub-network are described as follows.
In this way, the output features are generated and then reshaped to a one-dimensional tensor via flatten layer. After that, a fully connected layer is adopted to obtain the final sequence features , here refers to the number of neurons in the fully connected layer and is set to 32 in this study.
2.3.2 IFENet
2.3.3 HFCNet
After sequence and PPI features are extracted from aforementioned two sub-networks, respectively, they are further combined by the proposed HFCNet for final phosphorylation site prediction. Instead of concatenating features directly, HFCNet utilizes a bilinear feature module to capture the complex associations between heterogeneous sequence and PPI features, and the output is then fed into a multi-layer DNN to obtain the combined features. The detailed process is described as follows.
2.4 Training
PhosIDN can be applied to predict both general and kinase-specific phosphorylation sites. When predicting general phosphorylation sites, we use all available S/T and Y phosphorylation sites to complete the training of our deep learning models. When predicting kinase-specific phosphorylation sites, we follow previous studies (Luo et al., 2019; Wang et al., 2017) to adopt a transfer learning strategy to address the small-sample problem. Specifically, we first train a base model on phosphorylation data without kinase annotation and then transfer all the neural layers, the learned parameter matrices and the bias items of the base model to kinase-specific models. Then we fine-tune the final model using kinase-specific phosphorylation site training data to relieve the overfitting problem.
2.5 Performance assessment
3 Results
3.1 Evaluating the performance of PhosIDN
3.1.1 Performance evaluation with sequence information
To evaluate the ability of the proposed method in capturing long-range dependencies between residues, we first compare PhosIDN using only protein sequence as input (here referred to as PhosIDNSeq) with DCCNN on independent test data of general phosphorylation sites. We follow previous study (Jung et al., 2010) to select several different window sizes for our experiments and the ROC curves on S/T and Y sites are plotted in Figure 2. It is observed that the performance of DCCNN cannot benefit from the increase of the window size, indicating that CNN is good at learning local sequence patterns but may not take full advantage of larger window sizes. For example, on S/T sites DCCNN is able to obtain AUC value of 79.8% with window size of 33, while when the window size is increased to 71 the AUC value of DCCNN slightly drops to 79.2%, and the decrease in AUC value is associated with a P value of 0.0002935 calculated by using the roc_test function in pROC package (Robin et al., 2011). On the contrary, PhosIDNSeq obtains consistent performance improvements with the increase of the window size. Take S/T site as an example, compared with window size of 15, the AUC value of PhosIDNSeq is improved by 3.8% (P value = 2.9735E-96) and 5.0% (P value = 8.1592E-154) when the window size is increased to 33 and 71, respectively. Meanwhile, we find that PhosIDNSeq obtains comparable or higher AUC values than DCCNN for each window size and shows significant advantage with the largest window size of 71. For example, on S/T sites the AUC value is enhanced from 79.2% (DCCNN) to 81.1% (PhosIDNSeq) with a P value of 1.7987E-40. Similarly, on Y sites the AUC value is enhanced from 70.4% (DCCNN) to 72.6% (PhosIDNSeq) with a P value of 7.8998E-8. Taken together, these results suggest that PhosIDNSeq can capture not only local patterns but also long-range dependencies from protein sequences. Accordingly, we select the window size as 71 for PhosIDNSeq in the subsequent experiments.
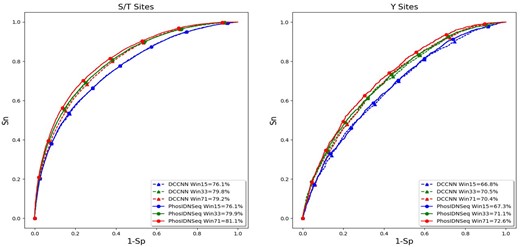
ROC curves of PhosIDNSeq for different window sizes on S/T and Y sites
Besides, we compare PhosIDNSeq with DCCNN for predicting kinase-specific phosphorylation sites, and the AUC values based on independent test data are displayed in Table 1 and Supplementary Table S2. For prediction of some kinases on S/T sites such as family CDK and subfamily ERK1, DCCNN shows good prediction performance with high AUC values (94.1% on family CDK and 94.2% on subfamily ERK1), which validate the importance of local sequence patterns in predicting kinase-specific phosphorylation sites. In comparison, as a more sophisticated deep learning architecture, PhosIDNSeq further improve the prediction performance for these kinases and the corresponding AUC values on family CDK and subfamily ERK1 reach 97.0% and 97.6%, respectively. At the same time, PhosIDNSeq also consistently outperforms DCCNN for kinase-specific prediction on Y sites. For example, compared with DCCNN on group TK and kinase SRC, PhosIDNSeq manages to obtain AUC values of 83.6% and 85.4% with an improvement of 3.2% (P value = 0.01383) and 2.8% (P value = 0.04638), respectively. These results show that in addition to general phosphorylation site prediction, PhosIDNSeq can also successfully boost the performance of kinase-specific phosphorylation site prediction with powerful capability of capturing long-range dependencies between residues.
AUC values (%) of PhosIDN with sequence information for kinase-specific phosphorylation site prediction
| Kinase | DCCNN | PhosIDNSeq |
|---|---|---|
| Group | ||
| AGC | 87.0 | 89.1 |
| Atypical | 82.3 | 84.2 |
| CAMK | 89.4 | 91.6 |
| CMGC | 89.8 | 92.6 |
| TK | 80.4 | 83.6 |
| Family | ||
| CDK | 94.1 | 97.0 |
| CK2 | 92.4 | 95.4 |
| MAPK | 94.5 | 95.4 |
| PKC | 83.7 | 86.4 |
| Src | 81.2 | 83.6 |
| Kinase | DCCNN | PhosIDNSeq |
|---|---|---|
| Group | ||
| AGC | 87.0 | 89.1 |
| Atypical | 82.3 | 84.2 |
| CAMK | 89.4 | 91.6 |
| CMGC | 89.8 | 92.6 |
| TK | 80.4 | 83.6 |
| Family | ||
| CDK | 94.1 | 97.0 |
| CK2 | 92.4 | 95.4 |
| MAPK | 94.5 | 95.4 |
| PKC | 83.7 | 86.4 |
| Src | 81.2 | 83.6 |
Note: Best performance values are highlighted in bold.
3.1.2 Performance evaluation with both sequence and PPI information
To assess the performance of our proposed method in extracting and combining sequence and PPI information, by using independent test data of kinase-specific phosphorylation sites we compare PhosIDN with three other versions of the proposed method: (i) baseline: in this case, we directly concatenate PPI embedding and the output of SFENet and combine them via one fully connected layer, (ii) IFENet*: in this case, we directly concatenate the outputs of SFENet and IFENet and use one fully connected layer to combine them and (iii) HFCNet*: in this case, we utilize HFCNet to combine PPI embedding and the output of SFENet. To rigorously evaluate the contribution of PPI information, the phosphorylated proteins in the independent test data are excluded from PPIs during the training of PhosIDN. As shown in Table 2 and Supplementary Table S3, all the methods using both protein sequence and PPI embedding as inputs produce higher performance than PhosIDNSeq, which corroborate previous studies that find PPI information contributes to the performance of kinase-specific phosphorylation site prediction. Furthermore, it can be clearly seen that IFENet* consistently performs better than baseline method, which suggests the ability of IFENet in extracting useful PPI features. For example, the AUC values of IFENet* are 87.8% and 91.7% on group Atypical and kinase SRC, respectively, which have 3.1% and 3.9% improvement over baseline method, respectively. Meanwhile, it is observed that HFCNet* also obtains higher AUC values than baseline method. For example, the AUC values achieved by HFCNet* reach 94.3% and 97.5% on group CMGC and subfamily CDK2, respectively, which are 1.3% and 1.1% better than those obtained by baseline method, respectively. These results demonstrate the strength of HFCNet in heterogeneous feature combination for kinase-specific phosphorylation site prediction. Finally, by integrating IFENet and HFCNet, PhosIDN achieves the best performance across all kinase-specific test data with remarkable improvements on AUC value. For example, on subfamily PKCa PhosIDN obtains the best AUC value of 92.1%, with an improvement of 2.7% (P value = 0.0007384), 2.0% (P value = 0.002713) and 2.2% (P value = 0.001736) over baseline method, IFENet* and HFCNet*, respectively.
AUC values (%) of PhosIDN with both sequence and PPI information for kinase-specific phosphorylation site prediction
| Kinase | Baseline | IFENet* | HFCNet* | PhosIDN |
|---|---|---|---|---|
| Group | ||||
| AGC | 89.7 | 91.5 | 90.9 | 93.2 |
| Atypical | 84.7 | 87.8 | 87.1 | 88.7 |
| CAMK | 92.0 | 94.2 | 93.9 | 94.9 |
| CMGC | 93.0 | 93.7 | 94.3 | 95.0 |
| TK | 88.5 | 91.0 | 89.5 | 92.2 |
| Family | ||||
| CDK | 97.0 | 97.6 | 97.4 | 98.2 |
| CK2 | 95.5 | 96.0 | 95.5 | 97.0 |
| MAPK | 96.1 | 96.6 | 96.7 | 97.4 |
| PKC | 88.7 | 90.6 | 89.1 | 91.6 |
| Src | 86.9 | 88.8 | 89.0 | 90.3 |
Baseline, direct concatenation of PPI embedding and the output of SFENet followed by one fully connected layer; IFENet*, direct concatenation of the outputs of SFENet and IFENet followed by one fully connected layer; HFCNet*, combination of PPI embedding and the output of SFENet via HFCNet; PhosIDN, our proposed integrated deep neural network. Best performance values are highlighted in bold.
In addition to AUC value, Sp, Sn, Pre, Acc, MCC and F1 are also used in this study to verify the effectiveness of the proposed method. By following previous study (Liu et al., 2018), we compute other measurements when the Sp threshold is set at medium stringency level (90%) and high stringency level (95%), and display the values of these measurements in Table 3 and Supplementary Table S4. It can be seen that both IFENet* and HFCNet* consistently achieve higher performance than baseline method. For example, on group Atypical at high stringency level, the Sn, Acc, MCC, Pre and F1 of IFENet* are 45.8%, 70.3%, 46.7%, 90.0% and 60.7%, respectively, while baseline method only obtains 28.0%, 61.4%, 30.8%, 84.6% and 42.0%, respectively. Also, the results clearly demonstrate the superior performance of PhosIDN. Take family PKC as an example, at medium stringency level PhosIDN has 12.6%, 7.2% and 12.4% improvement for F1 compared with baseline method, IFENet* and HFCNet*, respectively. In conclusion, PhosIDN can effectively extract and combine sequence and PPI information and significantly improve the performance of kinase-specific phosphorylation site prediction.
The values (%) of Sn, Acc, MCC, Pre and F1 of PhosIDN for kinase-specific phosphorylation site prediction at medium and high stringency levels
| Kinase | Method | Sp = 90% | Sp = 95% | ||||||||
|---|---|---|---|---|---|---|---|---|---|---|---|
| Sn | Acc | Mcc | Pre | F1 | Sn | Acc | Mcc | Pre | F1 | ||
| Group AGC | Baseline | 68.1 | 78.6 | 59.2 | 88.3 | 76.9 | 58.4 | 75.7 | 56.6 | 92.7 | 71.6 |
| IFENet* | 75.6 | 82.5 | 66.0 | 89.4 | 81.9 | 65.0 | 79.2 | 62.2 | 93.4 | 76.7 | |
| HFCNet* | 72.2 | 80.7 | 62.9 | 88.9 | 79.7 | 59.7 | 77.9 | 57.6 | 92.9 | 72.7 | |
| PhosIDN | 81.0 | 85.3 | 71.1 | 90.0 | 85.3 | 67.6 | 80.6 | 64.4 | 93.6 | 78.5 | |
| Group Atypical | Baseline | 54.2 | 72.0 | 47.2 | 84.2 | 66.0 | 28.0 | 61.4 | 30.8 | 84.6 | 42.0 |
| IFENet* | 57.6 | 73.7 | 50.1 | 85.0 | 68.7 | 45.8 | 70.3 | 46.7 | 90.0 | 60.7 | |
| HFCNet* | 54.2 | 72.0 | 47.2 | 84.2 | 66.0 | 40.7 | 67.8 | 42.4 | 88.9 | 55.8 | |
| PhosIDN | 65.3 | 77.5 | 56.8 | 86.5 | 74.4 | 50.8 | 72.9 | 51.0 | 90.9 | 65.2 | |
| Group CAMK | Baseline | 71.7 | 80.1 | 62.1 | 89.9 | 79.7 | 62.4 | 77.2 | 59.5 | 93.9 | 75.0 |
| IFENet* | 83.8 | 86.7 | 73.7 | 91.2 | 87.3 | 68.8 | 80.7 | 64.9 | 94.4 | 79.6 | |
| HFCNet* | 78.6 | 84.1 | 69.1 | 90.7 | 83.7 | 65.7 | 79.8 | 61.1 | 94.0 | 77.7 | |
| PhosIDN | 86.9 | 86.8 | 76.8 | 91.9 | 89.3 | 70.8 | 82.1 | 66.9 | 94.6 | 81.0 | |
Note: Best performance values are highlighted in bold.
Besides the PPIs from STRING database, we also adopt the physical interactions of proteins recorded in BioGRID database (Oughtred et al., 2021) and obtain totally 55 542 physical interactions between 10 247 human proteins. The corresponding ROC curves of different kinases are plotted in Supplementary Figure S1. The results show that by leveraging physical interactions of proteins, our proposed method also consistently achieves considerable improvements in performance, further indicating the contribution of PPI information to phosphorylation site prediction.
3.2 Comparison with existing methods
We first compare PhosIDN with several well-known methods for general phosphorylation site prediction including PPSP (Xue et al., 2006), NetPhos3.0 (Blom et al., 2004), Musite (Gao et al., 2010), MusiteDeep (Wang et al., 2017) and DeepPhos (Luo et al., 2019) based on independent test data. For existing methods, we adopt the optimal window size used by each specific method that is provided as a default setting. Supplementary Table S5 displays the AUC values on S/T and Y sites obtained by different methods, which shows that PhosIDN achieves better performance than other methods. Take Y site as an example, the AUC value of PhosIDN is 74.0%, which is 9.9%, 17.9%, 20.0%, 7.4% and 2.4% higher than PPSP, NetPhos3.0, Musite, MusiteDeep and DeepPhos, respectively. It is of note that the performance of DeepPhos shows little change when the maximal window size increases from default value of 51–71. In addition, we also calculate the values of Sn, Pre, Acc, MCC and F1 for all investigated methods, and the results are listed in Supplementary Table S6. We find that PhosIDN consistently outperforms other methods on all measurements. Take S/T site as an example, at high stringency level PhosIDN obtains 24.2%, 29.6%, 20.7%, 7.4% and 4.2% improvement for F1, compared with PPSP, NetPhos3.0, Musite, MusiteDeep and DeepPhos, respectively. Taken together, these results suggest that with a novel integrated deep learning architecture, PhosIDN has a very competitive performance for general phosphorylation site prediction. However, it is noteworthy that despite of the respectable performance on general phosphorylation sites, only kinase-specific methods should be able to yield good accuracy (Trost and Kusalik, 2011), given the fact that protein kinases have distinct substrate specificities (Eisenhaber and Eisenhaber, 2010).
Next, we compare our approach with some existing methods for kinase-specific phosphorylation site prediction including GPS, PPSP, MusiteDeep and DeepPhos. Table 4 and Supplementary Table S7 display the AUC values of all compared methods for different kinases. It is observed that both MusiteDeep and DeepPhos outperform other traditional phosphorylation site prediction methods, which indicates that CNN-based methods are advantageous in kinase-specific phosphorylation site prediction. For example, compared with GPS and PPSP, both MusiteDeep and DeepPhos obtain more than 7.0% AUC improvement in prediction of family CK2. At the same time, PhosIDNSeq compares favorably with MusiteDeep and DeepPhos across all kinase-specific test data. Furthermore, we find that by efficiently extracting and combining sequence and PPI information, PhosIDN achieves significant improvements over other methods that use only sequence information. For example, on family PKC the AUC value obtained by PhosIDN reaches 91.6%, while those of GPS, PPSP, MusiteDeep, DeepPhos and PhosIDNSeq are 66.2%, 76.1%, 80.5%, 84.2% and 86.4%, respectively. As for kinase SRC, PhosIDN achieves 17.6%, 29.0%, 10.6% and 7.9% AUC improvement compared with GPS, PPSP, DeepPhos and PhosIDNSeq, respectively. Moreover, we compare PhosIDN with PhosphoPredict (Song et al., 2017) that also leverages both sequence and PPI information, and find that PhosIDN shows comparable or better performance than PhosphoPredict. For example, on family CDK and MAPK, PhosIDN manages to achieve AUC values of 98.2% and 97.4% with an improvement of 1.6% and 1.9%, respectively. Finally, we list the values of Sn, Acc, MCC, Pre and F1 at high stringency level in Table 5 and Supplementary Table S8, and PhosIDN clearly shows the best predictive performance on all measurements. Take group AGC as an example, PhosIDN obtains Sn of 67.6%, Acc of 80.6%, MCC of 64.4%, Pre of 93.6% and F1 of 78.5%, while the performance of the next-best method are Sn of 54.2%, Acc of 73.6%, MCC of 53.1%, Pre of 92.1% and F1 of 68.3%. In conclusion, the aforementioned analysis demonstrates that PhosIDN compares favorably with existing methods for predicting phosphorylation sites.
AUC values (%) of different methods for kinase-specific phosphorylation site prediction
| Kinase | GPS | PPSP | MusiteDeep | DeepPhos | PhosphoPredict | PhosIDNSeq | PhosIDN |
|---|---|---|---|---|---|---|---|
| Group | |||||||
| AGC | 56.5 | 78.0 | – | 88.4 | – | 89.1 | 93.2 |
| Atypical | 76.5 | 64.4 | – | 83.2 | – | 84.2 | 88.7 |
| CAMK | 70.6 | 71.3 | – | 90.9 | – | 91.6 | 94.9 |
| CMGC | 83.2 | 82.1 | – | 91.9 | – | 92.6 | 95.0 |
| TK | 60.4 | 70.6 | – | 82.0 | – | 83.6 | 92.2 |
| Family | |||||||
| CDK | 90.5 | 86.1 | 93.0 | 96.0 | 96.6 | 97.0 | 98.2 |
| CK2 | 84.1 | 84.7 | 92.5 | 93.7 | 96.3 | 95.4 | 97.0 |
| MAPK | 92.1 | 84.4 | 93.4 | 95.4 | 95.5 | 95.4 | 97.4 |
| PKC | 66.2 | 76.1 | 80.5 | 84.2 | 90.2 | 86.4 | 91.6 |
| Src | 70.2 | 68.8 | – | 83.0 | – | 83.6 | 90.3 |
Note: Best performance values are highlighted in bold.
The values (%) of Sn, Acc, MCC, Pre and F1 of different methods for kinase-specific phosphorylation site prediction at high stringency level
| Kinase | Method | Sn | Acc | MCC | Pre | F1 |
|---|---|---|---|---|---|---|
| Group AGC | GPS | 5.9 | 48.3 | 1.8 | 56.1 | 10.7 |
| PPSP | 32.9 | 62.4 | 34.9 | 87.7 | 47.9 | |
| DeepPhos | 50.9 | 71.8 | 50.4 | 91.7 | 65.5 | |
| PhosIDNSeq | 54.2 | 73.6 | 53.1 | 92.1 | 68.3 | |
| PhosIDN | 67.6 | 80.6 | 64.4 | 93.6 | 78.5 | |
| Group Atypical | GPS | 16.1 | 55.5 | 17.9 | 76.0 | 26.6 |
| PPSP | 15.3 | 55.1 | 16.8 | 75.0 | 25.4 | |
| DeepPhos | 36.4 | 65.7 | 38.7 | 87.8 | 51.5 | |
| PhosIDNSeq | 39.8 | 67.4 | 41.6 | 88.7 | 55.0 | |
| PhosIDN | 50.8 | 72.9 | 51.0 | 90.9 | 65.2 |
Note: Best performance values are highlighted in bold.
To evaluate the performance of PhosIDN on kinases with different associated sites, we categorize kinase families with more than 200 sites in Supplementary Table S1 as well-annotated, and categorize kinase families with fewer than 100 sites in the dataset as poorly annotated. The corresponding AUC values of PhosIDN on well- and poorly annotated kinase families are displayed in Supplementary Table S9. The experimental results suggest that in addition to well-annotated kinase families, PhosIDN can also achieve good AUC values on poorly annotated kinase families. For example, the AUC values of family Aur and CAMK2 are 96.5% and 95.1%, respectively. Moreover, we test the performance of PhosIDN on some individual kinases with fewer associated sites in kinase family Src and PKC, and the corresponding AUC values are displayed in Supplementary Table S10. Take family Src as an example, PhosIDN manages to obtain AUC values of 90.8%, 91.2% and 90.7% on kinase HCK, FYN and LCK, respectively. The experimental results suggest that in comparison with well-annotated kinases, PhosIDN can also perform well on the kinases in the same kinase family but with fewer associated sites.
3.3 Visualization of features
In this section, we visualize the ability of our proposed method in feature extraction and combination by using t-SNE (Maaten and Hinton, 2008). For group Atypical and CAMK, original one-hot encoding features, sequence features extracted by PhosIDNSeq and combined features extracted by PhosIDN are plotted in Figure 3. It is obvious that original one-hot encoding features of phosphorylation and non-phosphorylation sites are in mixture, while sequence features extracted by PhosIDNSeq show separate trends, which become even more evident when using combined features extracted by PhosIDN. Similar results for some other kinases can be observed in Supplementary Figure S2. These results suggest that original protein sequence can be transformed into meaningful representation by PhosIDNSeq, and PhosIDN can generate better representation with stronger discriminant power in distinguishing phosphorylation and non-phosphorylation sites.
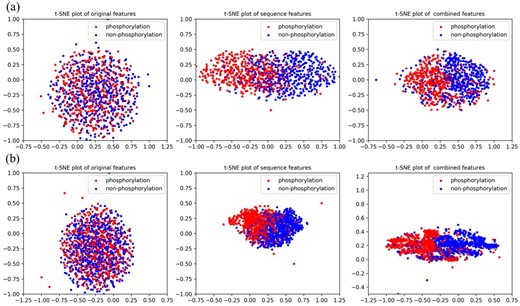
Visualization of original one-hot encoding features, sequence features extracted by PhosIDNSeq and combined features extracted by PhosIDN. The red dot represents the phosphorylation sites with kinase annotation belonging to (a) group Atypical or (b) group CAMK, the blue dot represents the non-phosphorylation sites
4 Discussion
In this article, we propose PhosIDN, a novel integrated deep neural network, for accurately predicting phosphorylation sites. When using sequence information, PhosIDN obtains significant performance for both general and kinase-specific phosphorylation site prediction, and the performance can be further improved by effectively combining sequence and PPI information. Meanwhile, the experimental results show that PhosIDN compares favorably with existing methods. Furthermore, the visualization results also indicate its ability in extracting and combining features with strong discriminant power. The main contributions of this work are as follows: (i) we demonstrate that the self-attention mechanism is very valuable in protein phosphorylation site prediction by obtaining the information about long-range dependencies between residues, (ii) we design an efficient deep neural network SFENet by leveraging DCCNN block and self-attention module, which can take full advantage of sequence information by capturing not only local patterns but also long-range dependencies from protein sequences and (iii) by effectively utilizing SFENet, IFENet and HFCNet, the proposed integrated deep neural network shows great strength in extracting and combining heterogeneous sequence and PPI information, and achieves remarkable performance for predicting both general and kinase-specific phosphorylation sites.
Although PhosIDN has enhanced the prediction performance of protein phosphorylation sites, there is still room for improvement. Firstly, some other biological information (e.g. gene ontology terms and protein secondary structure) is also helpful for predicting phosphorylation sites (Dou et al., 2014; 2017; Song et al., 2017), which could be adopted in our future work. Secondly, despite the fact that deep learning method has become a promising approach for phosphorylation site prediction, the deep neural network is still a black-box that is often criticized for lacking interpretability (Ma et al., 2018). Hence, it is very important to develop deep learning phosphorylation site prediction method with improved interpretability. Thirdly, in addition to self-attention module, other models such as recurrent neural network (Deznabi et al., 2020) and long short-term memory (Chen et al., 2019) have also been successfully used to capture the long-range dependencies in sequential data, which can be further explored in future study. Fourthly, kinase-specific models may tend to perform better on the kinases with more associated sites, and one possible reason is that for these kinases more data are available for training prediction models. For other kinases, it is expected that further improvement in performance can be obtained with more kinase-specific sites identified and collected in the future. Finally, PhosIDN shows powerful capability of extracting and combining sequence and PPI information, which suggests that our approach could be further improved and extended to other PTM site prediction tasks. In conclusion, we present a novel integrated deep neural network for predicting phosphorylation sites, which has the potential to be extended to more predictive tasks and provides clues for further biological research.
Funding
This work was supported by the National Natural Science Foundation of China [61871361, 61471331, 61971393, 61571414, 61932008, 61772368], National Key R&D Program of China [2020YFA0712403, 2018YFC0910500], Shanghai Science and Technology Innovation Fund [19511101404] and Shanghai Municipal Science and Technology Major Project [2018SHZDZX01].
Conflict of Interest: none declared.

