


Abstract
We characterised the phylogeographic patterns displayed by five species of bumblebees with largely overlapping ranges in Eurasia, but different levels of range fragmentation, range size and food specialization. Genetic variation across the range of each species was explored by using sequence variation of a total of 368 specimens at one mitochondrial and two nuclear DNA fragments (total of ∼2380 bp). Comparing patterns of genetic variation across species allowed us to investigate whether diet specialization, relative range size and/or fragmentation, impact phylogeographic patterns in bumblebees. As expected, stronger fragmentations of the species range are associated with a stronger overall geographic differentiation. Furthermore, diet specialization appears to increase population structure at the landscape level, presumably due to the less widespread and more heterogeneously distributed food resources. Conversely, no clear association was highlighted between diet specialization or overall range size and genetic diversity. Surprisingly, the two generalist and co-distributed species investigated, B. pratorum and B. hortorum, displayed widely divergent patterns in terms of genetic diversity and population structure. We suggest these differences are best explained by contrasting responses to past climate changes, possibly involving different glacial refuges. Overall, our results are compatible with a combined impact of two interacting parameters on intraspecific genetic variation: environment disturbances (presumably related to past climate changes) and features specific to the organism, such as diet specialization. They thus further highlight the challenge of dissociating both parameters in phylogeographic studies.
Introduction
Comparative phylogeographic studies have often searched for common patterns in widely different (i.e. phylogenetically distantly related), but co-distributed, organisms, as evidence of the impact of past climatic events on today's distribution of genetic variation (Avise, 2000; Hewitt, 2004). However, ecological or life history traits are also likely to significantly influence current patterns of intraspecific variation, which has been much less investigated to date. In this context, another interesting comparison can be made among co-distributed and closely related species sharing most of their life history traits. If they differ only by a few or even a single trait, it should be possible to highlight the impact of these few differences on the distribution of their genetic variation (e.g. Lourie, Green & Vincent, 2005; Soro et al., 2010; Roe et al., 2011; Saeki et al., 2011).
Here, we compare patterns of intraspecific genetic variation among five species of bumblebees (genus Bombus) whose geographic distributions largely overlap but differing through their range size, range fragmentation and the extent of their dietary specialization (two generalist vs. three specialist species). From an evolutionary perspective, a potential benefit of shifting from a generalist to a specialist diet is the possibility it offers to develop competitive adaptations to a more predictable environment (Schluter, 2000). For example, specialists can develop a more efficient behaviour for the foraging of one or a few specific host resources (e.g. Laverty & Plowright, 1988). Conversely, specialist herbivores are more constrained by the temporal and geographical distribution of their host plants, and their levels of genetic variation are likely to be strongly influenced by the level of range fragmentation of their host(s) (e.g. Zayed et al., 2005; Dellicour et al., 2015). This has already been suggested by a comparison of genetic variation between co-occurring generalist and specialist species in bees (e.g. Packer et al., 2005), butterflies (Habel, Meyer & Schmitt, 2009), moths (Groot et al., 2011) and bark beetles (Kelley, Farrell & Mitton, 2000). Interestingly, these studies generally highlighted a decrease in genetic diversity and an increase in population structure for specialist species (but see Bertheau et al., 2012), possibly related to the fact that specialist species are associated with less abundant food resources (both at the local level and at the level of their entire range), and thus form smaller and less connected populations. In the present study, the comparison of three specialist species with two generalist and congeneric species thus also represent a priori an interesting opportunity to investigate the impact on genetic variation of an evolutionary shift toward a more restricted diet breadth in phytophagous and social insects.
Intraspecific genetic variation has in fact already been investigated in several Bombus species, using microsatellite and/or DNA sequence (mostly mitochondrial) markers. In many cases, population structure was detected only between islands and the continent (Estoup et al., 1996; Widmer et al., 1998; Shao et al., 2004; Ellis et al., 2006; Goulson et al., 2011; Lozier et al., 2011; Lecocq et al., 2013), suggesting bumblebees are relatively good dispersers. Some studies, however, did highlight population structure on the continent: e.g. B. pascuorum (Widmer & Schmid-Hempel, 1999), B. muscorum (Darvill et al., 2006), B. bifarius (Lozier, Strange & Koch, 2013); see also the study of Duennes et al. (2012). Estoup et al. (1996), Darvill et al. (2006) and Ellis et al. (2006) highlighted lower genetic diversities on islands for B. terrestris, B. muscorum and B. sylvarum, respectively, but Shao et al. (2004) found similar diversities between island and mainland populations of B. ignitus. In this context, it seems interesting to investigate whether the continental range fragmentation associated with some of the species studied here has a similar impact to that associated with insular isolation.
By sampling each of the five species across their entire distribution and investigating DNA sequence variation at the same three independent loci, we aimed to characterise and compare the genetic diversity and population structure of five bumblebee species: Bombus (Megabombus) consobrinus, B. (Megabombus) gerstaeckeri, B. (Megabombus) hortorum, B. (Pyrobombus) brodmannicus and B. (Pyrobombus) pratorum. Our purpose is to investigate whether range size, range fragmentation and diet specialization influenced intraspecific diversity and population structure in bumblebees.
Material and Methods
Selected Bombus species
As displayed on Supporting Information (Fig. S1), the five species included in this study vary in range size and range fragmentation: B. consobrinus is a Palearctic species, its distribution ranging from Scandinavia to Japan (Løken, 1973), while the four others display a more restricted West-Palearctic distribution. Moreover, while B. hortorum and pratorum are characterised by a relatively continuous distribution, B. gerstaeckeri and brodmannicus are restricted to a few mountain ranges (including at least Pyrenees, Alps, and Carpathian mountains for B. gerstaeckeri, and Alps and Caucasus for B. brodmannicus; Ponchau et al., 2006; Rasmont, 1988). Differences in range size are also illustrated by the comparison of EOO (extent of occurrence) and AOO (area of occupancy) values, two indices used for the IUCN (International Union for Conservation of Nature) red list assessment (International Union for Conservation of Nature; http://www.iucnredlist.org). These two indices are, respectively, the surface covered by the minimum convex polygon and the subset of this surface where the species occurs. EOO and AOO values for each species are reported in Table 1 and confirmed that B. hortorum and pratorum present clearly a higher species range than B. gerstaeckeri and brodmannicus whose range is included in those of B. hortorum and pratorum. The vast majority of bumblebee females forages on pollen from various plant families, although a few species show some level of temporal and geographical host-plant preference (Prys-Jones & Corbet, 1991; Goulson, 2003). Two of the studied species, Bombus hortorum (subgenus Megabombus) and B. pratorum (subgenus Pyrobombus), are characterised by a generalist diet, as females can forage pollen on a wide variety of plants such as clovers, willows or blueberry (e.g. Goulson & Darvill, 2004; Kleijn & Raemakers, 2008; Mayer et al., 2012). The three other species are unusual for the genus as they display a highly specialized diet, at least on a portion of their range: B. consobrinus and B. gerstaeckeri, two species phylogenetically closely related to B. hortorum, are both specialist on the genus Aconitum (Ranunculaceae) and B. brodmannicus, the sister species of B. pratorum, is specialized on the genus Cerinthe (Boraginaceae) (Løken, 1961, 1973; Delmas, 1962, 1976; Tkalců, 1973; Rasmont, 1988; Ponchau et al., 2006; Konovalova, 2007; Dellicour et al., 2012). See also Müller & Kuhlmann (2008) for definition of specialist diet in bees and Cameron, Hines & Williams (2007) for the phylogenetic relations between these species). According to the overall Bombus phylogeny of Hines (2008), the split between B. brodmannicus and B. pratorum occurred about three million years ago. While B. gerstaeckeri displays a specialist behaviour on its entire distribution (Ponchau et al., 2006), the two other species are specialist only over a portion of their range: Far East populations of B. consobrinus and Caucasian populations of B. brodmannicus are known to collect pollen on alternative plants like clover (e.g. Rasmont, 1988; Suzuki, Dohzono & Hiei, 2007). Because these three species are not phylogenetically closely related (Cameron et al., 2007), it follows that a specialized diet has most likely evolved at least three times independently in the genus, from a generalist ancestor.
Comparison of EOO (extent of occurrence) and AOO (areas of occupancy) indices computed for each species and based on the occurrence data used for the IUCN (International Union for Conservation of Nature) red list assessments (http://www.iucnredlist.org; Rasmont et al., 2015)
| EOO (km2) | AOO (km2) | |
|---|---|---|
| B. consobrinus | 3 089 395 | 1544 |
| B. gerstaeckeri | 1 300 395 | 1436 |
| B. hortorum | 15 764 177 | 56 212 |
| B. brodmannicus | 1 234 326 | 420 |
| B. pratorum | 14 150 911 | 56 824 |
| EOO (km2) | AOO (km2) | |
|---|---|---|
| B. consobrinus | 3 089 395 | 1544 |
| B. gerstaeckeri | 1 300 395 | 1436 |
| B. hortorum | 15 764 177 | 56 212 |
| B. brodmannicus | 1 234 326 | 420 |
| B. pratorum | 14 150 911 | 56 824 |
These values were computed using the online software GeoCAT (Bachman et al., 2011; http://geocat.kew.org) with a cell width of 2 km corresponding to the default value used for the IUCN red list assessments.
Values computed for B. consobrinus were only based on occurrence data available for the European area.
Sampling and sequencing
We sampled B. consobrinus, B. gerstaeckeri, B. hortorum, B. brodmannicus and B. pratorum in 13, 11, 25, 6 and 59 localities across their range, respectively (Fig. 1, Table S1). Genomic DNA was extracted using the Qiagen DNeasy Blood and Tissue kit from 275 haploid males (50 B. consobrinus, 32 B. gerstaeckeri, 57 B. hortorum, 19 B. brodmannicus and 117 B. pratorum) and 93 diploid females (31 B. consobrinus, 40 B. gerstaeckeri, one B. hortorum, 18 B. brodmannicus and three B. pratorum). Half a thorax per specimen was ground in the Qiagen ATL buffer and incubated overnight with proteinase K at 56 °C. The remaining DNA-extraction steps were conducted as described in the manufacturer's protocol. We generated DNA sequences for the mitochondrial gene COI (cytochrome oxidase I) and two protein-coding nuclear genes: EF-1α (elongation factor-1 alpha, F2 copy) and PEPCK (phosphoenolpyruvate carboxykinase). We sequenced 357 samples of a ∼820 bp long fragment of the COI gene, 336 samples of a ∼720 bp long fragment of the EF-1α gene and 306 samples of a ∼840 bp long fragment of the PEPCK gene. All fragments were PCR-amplified with TrueStart Hot Start Taq DNA polymerase, following the guidelines in the manufacturer's protocol (Fermentas International Inc.). The COI fragment was amplified (annealing temperature: 53.3 °C) using primers AP-L-2013 and AP-H-2931 (Pedersen, 1996) or newly designed primers AP-L-2013-mod (5′-AATTGGAGGWTTTGGWAATTATYTTAATTCC-3′) and AP-H-2931-mod (5′-CAACTACATAATATGTRTCATGTARAATAATATCAAT-3′), the EF-1α fragment (annealing temperature: 54.0 °C) with primers F2forh and F2revh2 (Hines, Cameron & Williams, 2006), and the PEPCK fragment (annealing temperature: 49.4 °C) with primers FHv4 and RHv4 (Cameron et al., 2007). All haplotype sequences gathered for this study are available from GenBank under accession numbers KP033265–KP033403. Outgroup sequences were collected for Bombus argillaceus and B. koreanus (COI, EF-1α and PEPCK), as well as for B. ruderatus (COI), using the PCR amplification protocols described above. Other outgroup sequences were downloaded from GenBank for B. supremus, B. ruderatus, B. sushkini, B. jonellus, B. modestus and B. pyrenaeus (accession numbers: AF385809, AY181113, AF279546, AY181150, DQ788284, AF492977, AF492921, DQ788214, EF032362, DQ788262, EF051004, EF051002, EF050996, EF050814, EF050821, EF050822; Pedersen, 2002; Kawakita et al., 2003; Cameron et al., 2007).
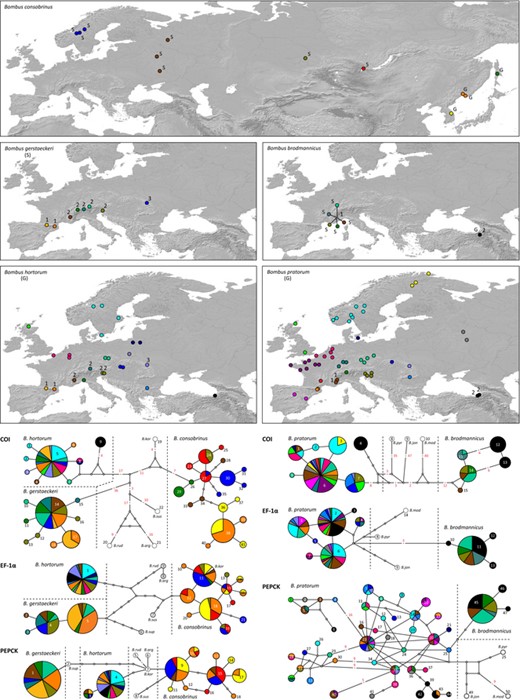
Sampling localities for the five Bombus species and median-joining networks for three gene fragments (COI, EF-1α and PEPCK). Each sequenced haplotype is represented by a circle, the size of which is proportional to its overall frequency, and identified by a unique number (see also Table S1). In some cases, red numbers above branches are used to indicate a number of mutational changes higher than 1. Haplotype colours correspond to the sampling localities displayed on the maps. ‘S’ and ‘G’ refer to ‘specialist’ and ‘generalist’ species or population and numbers on the map to the groups of sampled populations defined within each species (see text and Table 4). Outgroups are coloured in white and an abbreviation of the species name is added beside each of their haplotypes. ‘B. kor’: Bombus koreanus, ‘B. rud’: B. ruderatus, ‘B. arg’: B. argillaceus; ‘B. sus’: B. sushkini, ‘B. sup’: B. supremus, ‘B. pyr’: B. pyrenaeus, ‘B. mod’: B. modestus, ‘B. jon’: B. jonellus.
Data analyses
Sequences were aligned using the MUSCLE algorithm (Edgar, 2004) implemented in CODONCODE ALIGNER (v. 3.7.1.1, CodonCode Corporation). Alignments were checked manually and pruned at both 5′- and 3′-ends to avoid trailing gaps in the final dataset. Several gaps were identified: four gaps of one base in the EF-1α sequence alignment, one gap of three bases in the PEPCK sequence alignment of Megabombus species (i.e. B. consobrinus, B. gerstaeckeri and B. hortorum), and gaps of one, four, eight and sixteen bases in the PEPCK sequence alignment of Pyrobombus species (i.e. B. brodmannicus and B. pratorum). These gaps were considered as missing data for the haplotype networks inference and as separate characters for the other analyses.
We used two different methods to infer the haplotype phase of heterozygote genotypes. The software CHAMPURU 1.0 (Flot et al., 2006; Flot, 2007) was chosen for heterozygous individuals characterised by sequences of different lengths (i.e. sequences differentiated by at least one indel), as it specifically takes advantage of this feature for the inference. All other heterozygote genotypes were analysed with the maximum likelihood method implemented in the software PHASE 2.2.1 (Stephens, Smith & Donnelly, 2001; Stephens & Donnelly, 2003). This algorithm compares sequences identified in haploid (or homozygote) individuals with unphased sequences from heterozygous individuals. In this case, we conducted three independent runs of 10 000 iterations for each locus, while thinning at every 100 steps and discarding the first 1000 samples as burn-in. Convergence among chains was checked by comparing haplotype reconstructions inferred by five independent runs. Median-joining networks (Bandelt, Forster & Röhl, 1999) were finally inferred for each gene fragment using the software NETWORK 4.6.6 (available at http://www.fluxus-engineering.com) with ε = 0.
Genetic diversity and population structure
To characterise genetic variation within each species, we used a hierarchical design in which each sampling site is considered a separate population, and for which we define geographic groups of populations (further referred as ‘groups’) based on the fragmentation of the species ranges. We then estimate genetic variation (1) over the entire range of a species, to analyse the influence of the overall range fragmentation, and (2) within groups, to investigate the influence of the heterogeneous distribution of the food resource within a ± continuous portion of the species range. To compare estimated genetic diversity and population structure among specialist and generalist species, we focused on the following comparisons: within and between Europe + West Asia (specialist behaviour) and Far East (generalist behaviour) for B. consobrinus; within and among the Pyrenees, Alps, and Carpathian mountains for B. gerstaeckeri (specialist behaviour, fragmented species distribution restricted to these three mountain ranges) and B. hortorum (generalist behaviour, widespread European range including these three mountain areas); within and between the western Alps and Caucasus for B. brodmannicus (specialist behaviour in the Alps, but generalist in Caucasus; species range restricted to these two mountain areas) and B. pratorum (generalist behaviour, widespread European distribution including these two mountain ranges). These groups of populations are highlighted in Figure 1.
More specifically, the following statistics were estimated using SPADS 1.0 (Dellicour & Mardulyn, 2014): (1) nucleotide diversity π (Nei & Li, 1979) within groups and over the entire range of each species, (2) phylogeographic signal within-species ranges as measured by NST—GST (Pons & Petit, 1996), separately for each locus, and (3) AMOVA (hierarchical analysis of molecular variance, Excoffier, Smouse & Quattro, 1992) Φ-statistics to evaluate population structure (with two hierarchical levels: populations, i.e. sampling sites, and groups of populations as shown in Fig. 1). All these statistics are corrected for differences in sample size, which differs among species. As the Caucasian region seems notably differentiated from the rest of the distribution for B. hortorum and B. pratorum (see ), we also estimated NST—GST for these two species without populations sampled in this region. The three AMOVA statistics are ΦSC (proportion of genetic variation among populations within groups), ΦST (proportion of genetic variation among populations) and ΦCT (proportion of genetic variation among groups). Statistical significance of all F-statistics (NST, GST and AMOVA Φ-statistics) was assessed by recalculating them with 10 000 random permutations of the original datasets, the specific type of permutation depending on the F-statistic tested (Excoffier et al., 1992). The statistical significance of the phylogeographic signal values (NST—GST) was tested by recalculating them with 10 000 random permutations of haplotypes in the original data sets.
Divergence times between European and Caucasian populations
In view of the concordant strong genetic differentiation highlighted between Caucasus and Europe with mitochondrial haplotypes (see ), we estimated the divergence time between these two regions. For the three species distributed in Europe and Caucasus (B. hortorum, B. brodmannicus and B. pratorum), we used the isolation with migration model of population divergence implemented in the program IMa2 (Hey, 2010). For each species, we assumed two panmictic and completely isolated (no migration) populations (Europe and Caucasus), since their divergence from a unique ancestral population. We conducted three independent runs per species, including all three loci, using 80 MCMCs (Markov chains Monte Carlo) with geometric heating, 2 × 10⁶ steps following a burn-in of 105 steps, and sampling every 100 steps. Divergence times estimates were adjusted assuming two extreme mitochondrial mutation rates estimated for insects (Zakharov, Caterino & Sperling, 2004) of respectively 2.8 × 10⁻⁹ (Su et al., 1998) and 4.9 × 10⁻⁸ (Crozier, Crozier & Mackinlay, 1989) mutations per site per generation (i.e. per year, as the species are univoltine).
Results
DNA sequences
Inferring haplotypes from diploid heterozygous individuals (females) with the PHASE software was greatly facilitated by comparisons with phased haplotypes from haploid individuals (males), but also with phased haplotypes inferred with CHAMPURU from eight heterozygous individuals. Except for four heterozygote genotypes whose corresponding haplotypes (associated with probabilities ranging from 0.521 to 0.746) are highlighted with an asterisk in Table S1, the sequence of all other haplotypes was inferred with an estimated probability > 0.9. All five independent runs launched for each locus confirmed the robustness of our results. All phased haplotypes were included in all analyses. All haplotype sequences gathered for this study are available from GenBank under accession numbers KP033265–KP033403.
Haplotype networks
Haplotype networks inferred for each locus either from B. hortorum, B. consobrinus and B. gerstaeckeri (subgenus Megabombus) or from B. pratorum and B. brodmannicus (subgenus Pyrobombus) are displayed in Figure 1, in which haplotypes are coloured according to their geographic origin (see also Supporting Information, Fig. S2 for haplotypes coloured according to feeding behaviour). Alternative figures focusing on the geographic distribution of each haplotype are available as supplementary information (Supporting Information, Figs S3–S5). For B. consobrinus and B. brodmannicus, whose feeding behaviour varies within their range, a strong genetic differentiation between generalist and specialist populations is only observed within the COI networks (Supporting Information, Fig. S2). For B. consobrinus, while geographically distant Scandinavian and Russian specialist populations are relatively close genetically, even sharing one haplotype (haplotype no. 27 on COI network, Fig. 1), Far East haplotypes (generalist populations) were completely isolated genetically from central Russia specialist populations, albeit being geographically closer (Fig. 1, but see also Supporting Information, Fig. S3 for an alternative representation). In B. brodmannicus, haplotypes from specialist populations in the Alps are separated by several mutations from those of generalist populations in Caucasus Mountains (Fig. 1, Supporting Information, Fig. S5). Finally, the geographic structure displayed by the COI network in B. pratorum (Fig 1, Supporting Information, Fig. S5) highlighted four relatively well separated regions: Northern Europe (Scandinavia), Western Europe (including the West coast, the Pyrenees and a good portion of the Alps), central Europe (Carpathians and eastern Alps), and Caucasus.
Comparison of overall phylogeographic signal and genetic diversity
A significant phylogeographic signal (NST–GST) was only detected for the mitochondrial COI fragment, with the exception of B. pratorum for which a significant signal was also detected for PEPCK (Table 2). For COI, the highest value is obtained for B. hortorum (0.546) and the lowest value for B. gerstaeckeri (0.097), while these species are respectively associated with a continuous and a fragmented range. Yet, when estimated after excluding samples from the Caucasian region, it becomes lower for B. hortorum than for B. gerstaeckeri, and even non significant (Table 3). The three other species present quite similar phylogeographic signal values for COI ranging from 0.214 to 0.294, while they also present very different range size and fragmentation but, similarly, this phylogeographic signal becomes non significant for B. brodmannicus and B. pratorum when estimated after excluding the Caucasian samples.
Phylogeographic signal as measured by NST–GST and overall nucleotide diversity π estimated within each species
Significant NST–GST value (P< 0.05).
Phylogeographic signal as measured by NST–GST and overall nucleotide diversity π estimated within each species
Significant NST–GST value (P< 0.05).
The comparison of overall nucleotide diversity among species (Table 2) fails to highlight any correlation between genetic diversity and size of species range. Indeed, B. hortorum is one of the less genetically diverse species, although displaying quite an extended geographic distribution, and B. brodmannicus, while clearly the species associated with the most restricted range, is still characterised by relatively high genetic diversity when considering the mitochondrial COI, and compared, e.g. to its sister species B. pratorum. Interestingly, both generalist species, while showing comparable geographic distributions, display strongly different levels of diversity. If we discard the Caucasian populations, a region that seems strongly isolated from the rest of the distribution in all species investigated, genetic diversity is systematically much higher in B. pratorum than in B. hortorum: 0.00096 vs. 0.00037 for COI, 0.00150 vs. 0.00000 for EF-1a, and 0.00429 vs. 0.00023 for PEPCK.
Comparison of within-species population structure and diversity
Results of the AMOVA for each species are presented in Table 3. They confirm a significantly high level of genetic differentiation between geographically distinct specialist and generalist populations for B. consobrinus (ΦCT = 0.574). Furthermore, comparing within-species differentiation (i.e. population structure) between co-distributed specialist and generalist populations does reveal an interesting trend. Differentiation among populations within groups, as estimated by ΦSC calculated for the mitochondrial gene COI, is only significant for the two specialist species B. gerstaeckeri and B. brodmannicus, not for their related and co-distributed generalist species (B. hortorum and B. pratorum, respectively) when focusing on the overlapping portion of their range (identified with numbers on the maps in Fig. 1). When comparing B. gerstaeckeri with B. hortorum, overall genetic differentiations among populations, as estimated by ΦST with one value per locus, were significant for B. gerstaeckeri, but not significant for B. hortorum (see also Supporting Information, Fig. S4). The difference in range fragmentation between the compared generalist and specialist species appears therefore present at two geographic levels: at the level of the observed species range (as reflected by comparison of ΦST values), but also at the level of the local landscape (as reflected by comparison of ΦSC values), possibly due to the more heterogeneous distribution of the specialist's food resources (see ). Finally, a strong differentiation between the Caucasian populations and those of the rest of the distribution is observed for the three species present in the Caucasus region (i.e. B. brodmannicus, B. hortorum and B. pratorum).
AMOVA Φ-statistics estimated for one population partition per species. Three distinct partitions were used in AMOVA analyses
Sampled populations were separated into several groups as summarized in Figure 1 and Table 4, sampled populations of B. consobrinus were separated in two groups: specialist and generalist populations; sampled populations of B. gerstaeckeri and some sampled populations of B. hortorum were separated into three geographic groups: Pyrenees, Alps and Carpathians; sampled populations of B. brodmannicus and some sampled populations of B. pratorum were separated in two geographic groups: Western Alps and Caucasus.
Significant value (P< 0.05).
Nucleotide diversities estimated for different groups are summarized in Table 4. Overall, no general pattern related to feeding behaviour could be detected. A lower genetic diversity was observed for the specialist B. brodmannicus relative to that highlighted for the related generalist B. pratorum when focusing on the western Alps, at least for the nuclear loci, but a similar trend was not observed in the Caucasus area.
Nucleotide diversity π estimated within each defined group of sampled populations (Fig. 1)
| Species | Group | COI | EF-1α | PEPCK |
|---|---|---|---|---|
| B. consobrinus | 1 – Specialist | 0.00200 | 0.00223 | 0.00137 |
| B. consobrinus | 2 – Generalist | 0.00256 | 0.00174 | 0.00232 |
| B. gerstaeckeri | 1 – Pyrenees | 0.00135 | 0.00000 | 0.00000 |
| B. gerstaeckeri | 2 – Alps | 0.00043 | 0.00079 | 0.00000 |
| B. gerstaeckeri | 3 – Carpates | 0.00000 | 0.00000 | 0.00000 |
| B. hortorum | 1 – Pyrenees | 0.00024 | 0.00000 | 0.00039 |
| B. hortorum | 2 – Alps | 0.00027 | 0.00000 | 0.00026 |
| B. hortorum | 3 – Carpates | 0.00049 | 0.00000 | 0.00000 |
| B. brodmannicus | 1 – Western Alps | 0.00061 | 0.00000 | 0.00000 |
| B. brodmannicus | 2 – Caucasus | 0.00055 | 0.00102 | 0.00106 |
| B. pratorum | 1 – Western Alps | 0.00051 | 0.00122 | 0.00265 |
| B. pratorum | 2 – Caucasus | 0.00000 | 0.00069 | 0.00122 |
Divergence times between European and Caucasian populations
Because of the broad range of mutation rates assumed for COI in the previous section (4.9 × 10⁻⁸–2.8 × 10⁻⁹ mutations/site/year), and the stochastic nature of the coalescent process, the estimated ranges of divergence times are quite large, especially when considering the 95% highest posterior probability intervals (Table 5). Nonetheless, we can infer that for two species, B. brodmannicus and B. pratorum, Europe and Caucasus have been isolated from each other since at least the end of the last glaciation (12 121 and 15 280 years, respectively), and probably for much longer (mean values of 74 966 and 129 212 years, respectively). If we are willing to make the additional assumption that the splitting between the two regions is contemporaneous in all three species, which is somewhat supported by their observed concordant phylogeographic patterns, their actual (common) splitting time is necessarily included in the overlap between their different estimated ranges. In that case, the splitting between the two regions would have occurred at least 15 280 years ago (minimum divergence time for B. pratorum from estimated HPD95 interval), during the last glaciation, and more probably around at least 129 212 years ago (minimum mean divergence time for the same species), during the previous interglacial period.
Divergence times (in years) estimated with IMa2 between European and Caucasian populations
| Mutation rate: | 4.9 × 10⁻⁸ mutations/site/generation | 2.8 × 10⁻⁹ mutations/site/generation | ||
|---|---|---|---|---|
| Mean | HPD95 | Mean | HPD95 | |
| B. hortorum | 10 989 | [0–25 053] | 234 106 | [0–533 737] |
| B. brodmannicus | 74 966 | [12 121–144 734] | 1 597 108 | [258 228–3 083 470] |
| B. pratorum | 129 212 | [15 280–236 788] | 2 752 769 | [325 532–5 044 606] |
‘HPD95’ refers to the highest posterior probability intervals at 95%.
Discussion
Using DNA sequences from the same three loci, we have characterised patterns of genetic variation for five Bombus species displaying contrasting levels of overall range size/fragmentation and diet specialization. Comparing these patterns among species allows investigating the potential effect these parameters have on genetic variation in bumblebees.
Impact of range fragmentation on population structure
B. gerstaeckeri and B. brodmannicus display a highly fragmented species range. Whether or not this range fragmentation is directly the result of diet specialization, as is the case for B. gerstaeckeri, we may expect it impacted overall population structure, although it could also have been somehow counterbalanced by high dispersal. In fact, strong differentiation levels among continental populations appear rather uncommon in bumblebees (but see Darvill et al., 2006) and were mostly detected in extreme cases of range fragmentation, i.e. when Bombus populations are isolated on islands (Estoup et al., 1996; Widmer et al., 1998; Shao et al., 2004; Ellis et al., 2006; Goulson et al., 2011; Lecocq et al., 2013). The AMOVA ΦST calculated over the entire range of B. gerstaeckeri was significant for two loci, while the same statistic calculated for B. hortorum over the same regions (i.e., over a portion only of its range) was never significant. The isolation among different mountain ranges colonized by B. gerstaeckeri appears thus similar to that between islands and the mainland for other species. While the highly disjoint range of B. brodmannicus also results in a strong geographic differentiation between its two mountain ranges (Caucasus and the Alps), this pattern is not necessarily associated with a stronger range fragmentation. Indeed, the Caucasian populations are also strongly differentiated in the less fragmented B. hortorum and B. pratorum, the latter being the sister species of B. brodmannicus. These observations suggest a long history of isolation of the Caucasian region, at least for bumblebees. It was already suggested that this region served as glacial refuge in the past for some species (Taberlet & Bouvet, 1994; Hewitt, 2004), and a similar pattern of strong differentiation between this region and Europe was previously highlighted for other organisms (e.g. Marmi et al., 2006; Hegna, Galarza & Mappes, 2015). When compared to traditionally inferred glacial refuges in Europe (e.g. Iberia, Italy, Balkans), the Caucasian region appears much more differentiated, which suggests it has been isolated from Europe for several glacial—interglacial cycles of the Pleistocene (ancient divergence). While the lower bound of our divergence time estimates between the two regions goes back only to the last glaciation, the mean value of this estimate, calculated from the highest mutation rate, suggests that the isolation between the two regions dates from at least the previous interglacial, i.e. > 129 000 years ago.
The impact of species range fragmentation is also suggested when comparing the overall phylogeographic signals estimated for each species with the mitochondrial gene fragment, the locus for which the highest genetic structure was detected. Indeed, B. gerstaeckeri, whose range is restricted to mountains, displays a significant phylogeographic signal, which is not the case for B. hortorum in the same regions (i.e. when previously discarding the Caucasian samples). Furthermore, B. hortorum, B. brodmannicus and B. pratorum are all associated with a significant phylogeographic signal only when including Caucasian samples, showing the only source of this signal is the strong differentiation between the Caucasian region and the rest of the distribution. Note that the stronger phylogeographic signal identified for the mitochondrial gene COI, compared to that recorded for the nuclear genes, is not unexpected. This pattern is indeed often observed in insects (e.g. Dellicour et al., 2014; Quinzin & Mardulyn, 2014) and other animals (Zink & Barrowclough, 2008; Peters, Bolender & Pearce, 2012), probably due to the smaller effective population size associated with the mitochondrial genome (stronger genetic drift) and to a history of recurrent adaptive selection (Bazin, Glémin & Galtier, 2006).
Impact of diet specialization on population structure
Diet specialization may impact genetic variation at the landscape level, i.e. caused by the more heterogeneous distribution and lower availability of plant resources. We estimated this impact by comparing population structure within regions where generalist and specialist species are both present. A trend emerges from these comparisons, when focusing on the COI locus, that shows the highest level of population structure (as measured by ΦSC): focusing only on regions where specialists and generalists co-occur, the two specialists (B. gerstaeckeri and B. brodmannicus) display significant population differentiation while the two generalists (B. hortorum and B. pratorum) do not. A higher population structure for specialized populations was already suggested by studies from bees by Packer et al. (2005) and for moths by Groot et al. (2011), which detected higher FST values among populations of specialist species (but see the study on Lepidoptera by Habel et al. (2009) for a different result). In principle, it seems bumblebees are relatively good dispersers, as suggested by several studies. For instance, Kraus, Wolf & Moritz (2009) estimated a male dispersal distance for Bombus terrestris ranging from 2.2 to 9.9 km, and Lepais et al. (2010) showed that queens from B. pascuorum and B. lapidarius can disperse over distances of at least 3 and 5 km, respectively. As a consequence, Bumblebees should be relatively resistant to the heterogeneous distribution of its resources (Connop et al., 2010). Thus, the increase in range fragmentation accompanying host-plant specialization in the genus Bombus must be strong, as it results in a significant impact on genetic structure.
Impact of range size and fragmentation on intraspecific genetic diversity
Beside the fact that we found no clear correlation between range size and overall intraspecific diversity, our comparison of genetic diversity among five bumblebee species highlights an unexpected pattern: B. hortorum and B. pratorum are co-distributed across the entire European continent, yet B. hortorum is much less diverse than B. pratorum, a pattern consistent across loci. Because these two species share most of their life history traits, we hypothesize their different patterns of genetic variation are a testimony to contrasted evolutionary histories. If we add the fact that B. pratorum displays higher levels of population differentiation across its range (at least if we exclude the Caucasian population; Supporting Information, Figs S4, S5), this pattern could then suggest that B. hortorum has recently colonized most of its range (again, with the exception of an isolated area in the vicinity of the Caucasus Mountains) from a single source population (range expansion), while B. pratorum has been present across its current range for a longer period, or has colonized its range from three different source populations, possibly corresponding to glacial refuges, which would explain its current differentiation in roughly three separate regions (Supporting Information, Fig. S5): North Europe (Scandinavia), Western Europe and central Europe (Carpathians).
Impact of diet specialization on intra-species genetic diversity
While a few previous studies that have performed similar comparisons, but with different insects, have detected a significant reduction in genetic diversity associated with diet specialization (Packer et al. (2005) on bees; Habel et al. (2009) on butterflies; and Kelley et al. (2000) on bark beetles), our results are less straightforward. We could not find a systematic decrease in genetic diversity associated with a more specialized feeding behaviour, or even to a smaller local or global species range. Even if we cannot exclude some influence of these factors, it seems that our data argue against a drastic effect of floral specialization on genetic diversity in bumblebees. Because levels of genetic diversity are in theory correlated to population size, our data further seem to contradict field observations reporting the scarcity and small population sizes of specialist species such as B. gerstaeckeri and B. brodmannicus (e.g. Ponchau et al., 2006) compared to other common generalist species. It is however possible that the decline of these species, maybe mediated by human activities, is too recent to have an impact on current patterns of genetic variation. Alternatively, the variability in the social structure between the specialist and the generalist species could impact their respective overall effective population size and, hence, genetic diversity. The worker/queen ratio of Bombus gerstaeckeri is indeed much lower (3:1; Ponchau et al., 2006) than that of B. hortorum (40:1; Goulson, 2003). The observed larger census population size of generalist species could therefore simply reveal larger colonies, without translating into much larger local population effective sizes.
Evolution of diet specialization in Bombus
A specialist diet is clearly unusual in bumblebees, with only three known species (out of ± 250; Williams, 1998) displaying such behaviour. The mitochondrial haplotype network (Fig. 1) showing genetic variation for B. gerstaeckeri and B. consobrinus indicates that these two closely related species have evolved towards diet specialization independently from each other, even though they are both specialized on the same host-plant genus. This result was expected by looking at the Bombus phylogeny estimate of Cameron et al. (2007). Moreover, in the two species displaying both generalist and specialist populations (B. consobrinus and B. brodmannicus), our data show a strong genetic and phylogeographic differentiation between the two, which, associated with the observed geographic separation, suggest the two groups have been isolated from each other for a long time. Diet specialization is therefore likely to have evolved only once in each species, in an allopatric setting. This is despite the efficiency that could potentially be gained by developing adaptations for collecting pollen on a single source (Laverty & Plowright, 1988). Indeed, host-plant specialization is much more widespread in other herbivorous insects, which is likely related to the advantages offered by a more predictable environment (Schluter, 2000; Danforth et al., 2013). Like for other social insects (Apis, Euglossa, Meliponini or in ants), the low proportion of specialist species in bumblebees could be related to the need for a long period of foraging that is associated with the life of a colony, scarcely compatible with the flowering of a single resource (Williams, 1989; Michener, 2007). On the other hand, Williams (1989) also suggests that specialization is more likely to occur at high altitude, where the flowering season, i.e. the time window for colony development, is shorter.
Conclusion
Our results confirm the expected impact of range fragmentation on population structure and further suggest that, on the rare occasions in which specialization did occur in bumblebees, it also led to increased population structure among connected populations at the landscape level (comparison of ΦSC measures between B. gerstaeckeri and B. hortorum). While the majority of phytophagous insects is relatively specialized in their host-plant choices (Bernays & Graham, 1988; Wiklund & Friberg, 2009), our results thus confirm the effect such specialization can have on population structure. Conversely, neither range size, range fragmentation or diet specialization appear to have notable consequences for the levels of genetic diversity encountered in the global range of these species. Our results also further highlight the challenge for phylogeographic studies to dissociate the effect of past climatic history on current patterns of intraspecific variation from the effect of ecological or life history traits. Indeed, if the range fragmentation and/or diet specialization of an herbivore species influence its pattern of genetic variation, as suggested here, it becomes important, for the purpose of estimating the impact of climate history on a species, to somehow differentiate this impact from that of other parameters intrinsic to the species itself.
Acknowledgements
We wish to thank Paul Williams and two anonymous reviewers for helpful comments and advices. We are grateful to A. Coppée, A. Jenic, A. Lachaud, A. Lelej, B. Dellicour, D. Roelants, E. Dufrêne, G. Mahé, H.K. Schwenninger, I. Konovalova, I. Raemakers, L. Castro, M. Smith, M. Cornalba, M. Terzo, N.S. Kolesova, N. Vereecken, O. Berg, O. Hovorka, O. Ponchau, P. Bogusch, P. Rasmont, P. Sima, P. Tripotin, P. Williams, S. Bellens, S. Iserbyt, T. De Meulemeester, T. Lecocq, T. Levchenko, V.G. Radchenko, V. Leféon and X. Ghislain for their invaluable help in collecting specimens. This research project was funded by the Belgian Fonds pour la Recherche Scientifique (FRFC project 2.4.613.10.F). S.D. was supported by a grant from the Fonds pour la Recherche dans l'Industrie et l'Agriculture (FRIA) and by an award from the Fonds David and Alice Van Buuren.
