


Abstract
Muscle weakness, as measured by handgrip strength, is associated with cardiovascular and all-cause mortality; however, there are wide inconsistencies in the magnitude of these effects due to divergent definitions used to define muscle weakness across studies. Therefore, the objective of this study was to examine the relationship between previously defined sex- and race-specific cutpoints of clinical muscle weakness and early mortality.
Data come from the 2006–2014 Health and Retirement Study. Time-varying clinical muscle weakness, as defined by handgrip strength cutpoints, was the primary exposure. Time to death, ascertained from the National Death Index, was the outcome of interest. The association between time-varying clinical muscle weakness and early mortality across a 9-year observation period was determined using Kaplan-Meier methods and extended Cox regression.
Out of the 8,326 individuals in the study, 1,799 deaths (21%) occurred during the observation period. Median follow-up time was 8.3 years (SD ±1.9 years). Weak individuals had a steeper decline in their survival trajectory, compared to non-weak individuals (Log-Rank test, p < .001). After adjusting for sociodemographic factors and time-varying smoking history, weak individuals were over 50% more likely to die earlier than non-weak individuals (hazard ratio [HR] = 1.52, 95% confidence interval [CI] = 1.15, 1.47).
This is the first study to use muscle weakness cutpoints derived in a nationally representative sample to identify those individuals who may be at greatest risk for premature mortality. Results underscore the importance of muscle weakness, as defined by handgrip strength, as a key risk factor for premature mortality in older Americans.
Muscle weakness, as measured by handgrip strength, is associated with a host of negative health outcomes, including physical functioning limitations (1,2), disability (3–5), and multimorbidity (6,7). There is also a growing body of evidence linking muscle weakness with both cardiovascular (8) and all-cause mortality (1,8–12). However, there are inconsistencies in the magnitude of these effects. For example, the Foundations of National Institutes of Health Sarcopenia Project found a 74% and 48% greater mortality risk over 10 years for weak men and women, respectively, in a study comprised of six cohort studies (1). Similarly, the estimated risk of death was 36% among men and women with low grip strength in the Health ABC study over 4-years of follow-up (11). In contrast, no relation between weak handgrip strength and mortality was found in a sample of older adults with chronic kidney disease (13) while low grip strength was associated with a 49% increased risk of death in men, but not in women (14).
Part of the reason for these inconsistent findings may stem from the multiple ways in which muscle weakness has been measured and operationally defined. The Prospective Urban Rural Epidemiology used study-specific grip strength tertiles (8) whereas the Adult Health Study (AHS) compared men and women in the highest and lowest quintiles of handgrip strength among 5,000 individuals in Japan (15), and the Foundations of National Institutes of Health Sarcopenia Project used grip strength thresholds calculated from a specific set of cohort studies and clinical trials (1). In the absence of consistent, population-derived cutpoints of clinical muscle weakness based on handgrip strength, the true consequences of muscle weakness for premature mortality remain unclear.
In earlier work, sex- and race-specific cutpoints for clinical muscle weakness were identified using data from a nationally representative sample of older Americans in the U.S. Health and Retirement Study (Table 1) (16). In subsequent analyses, these weakness cutpoints were shown to be predictive of incident physical disability over a 4-year period (4). What remains to be determined is the extent to which these cutpoints predict early mortality.
Cutpoints for Clinical Muscle Weakness by Race and Sex in the Health and Retirement Study
| White Males (n = 3,279) | Black Males (n = 422) | White Women (n = 4,286) | Black Women (n = 738) | |
|---|---|---|---|---|
| Cutpoint (kg) | Cutpoint (kg) | Cutpoint (kg) | Cutpoint (kg) | |
| Weak | <35 | <40 | <22 | <31 |
| Normal | ≥35 | ≥40 | ≥22 | ≥31 |
| White Males (n = 3,279) | Black Males (n = 422) | White Women (n = 4,286) | Black Women (n = 738) | |
|---|---|---|---|---|
| Cutpoint (kg) | Cutpoint (kg) | Cutpoint (kg) | Cutpoint (kg) | |
| Weak | <35 | <40 | <22 | <31 |
| Normal | ≥35 | ≥40 | ≥22 | ≥31 |
The primary aim of this study was to examine the relationship between clinical muscle weakness, as defined by our previously published sex- and race-specific grip strength cutpoints, and early mortality across a 9-year period from a nationally representative sample of American adults aged 65 years and older. It was hypothesized that weak individuals would have a shorter survival compared to non-weak individuals, even after accounting for time-varying health and sociodemographic covariates.
Methods
Design and Sample Population
Data came from the Health and Retirement Study (HRS), a nationally representative, multistage area probability survey of non-institutionalized, community-dwelling Americans aged 51 years and older. Study details have been previously described (17). Briefly, HRS is the longest running longitudinal study of older Americans in the United States, with consistent response rates of ~85% (17). Sampled persons have been re-interviewed biannually since 1992, and new cohorts have been added to the original sample to maintain the nationally-representative nature of the survey over time (17).
In 2006, half the sample of HRS participants was randomly selected for an enhanced face-to-face interview that included physical measurements, and the other random one-half completed the same interview in 2008 (18). Baseline collection of variables began in 2006 and was repeated every 2 years going forward. Proxy interviews and nursing home residents were ineligible to participate in the enhanced physical measurement protocol.
We used five waves of longitudinal data from the 2006–2014 HRS. Analyses were restricted to black and white community-dwelling adults aged 65 years and older. Individuals who reported to be “other” race were excluded from the analysis (n = 487). Individuals who were missing on grip strength across all waves were excluded from the analysis (n = 169), yielding a final sample of 8,326 individuals.
Measures
Handgrip strength
Handgrip strength, our primary exposure variable, was assessed using a Smedley spring-type hand dynamometer (Scandidact, Denmark). Participants were instructed to squeeze the device as hard as they could and then let go. Grip strength assessments were administered while participants were standing with their arm at their side, and with the elbow flexed at a 90-degree angle (18). After one practice trial, measurements were taken with each hand, first with the dominant hand and then with the non-dominant hand. Two additional measurements were taken for both hands, and the maximum measurement in kilograms (kg) from the four trials was used for the analysis. Among those missing on handgrip strength (n = 169), the majority had a health problem (63%) or the interviewer did not feel it was safe for the respondent to participate (37%).
Race- and sex-specific cutpoints for clinical weakness were used to classify those who were weak versus not weak at each follow-up (16). The HRS handgrip strength cutpoints were previously found to have moderate to moderately high sensitivity in relation to slow walking speed for black and white men (range, SE: 69%–75%, SP: 54.3%–64.9%) and black and white women (range, SE: 60.5%–90.5%, SP: 29.2%–67.6%) (16). Time-varying grip strength was used in the analyses.
Mortality
Mortality was ascertained through HRS linkages with the National Death Index or from contact with household members at each data collection wave through December 2014. Previous HRS tracking studies have indicated a 98.8% validation of deaths (17). Survival time was calculated based on an individual’s age in months from the start of their first interview until the end of observation period (December 31, 2014) or until death, whichever occurred first. Individuals who were alive at the end of the follow-up period or lost to follow-up were censored.
Covariates
The following covariates were included: age (continuous), sex, self-reported race/ethnicity and education (five-level categorical variable, less than a high school degree, GED, high school degree, some college, and college and above). Smoking status, which was measured every 2-years, was included as a time-varying covariate and was categorized as current, former and never smoker based on self-report. Physical activity was assessed based on whether an individual reported taking part in sports or activities that were “moderately energetic” (i.e. gardening, cleaning the car, walking at a moderate pace). Individuals who reported hardly ever or never were classified as “inactive” while those who engaged in moderate activity more than once a week, once a week, one to three times a month were considered “active.” Body mass index (BMI) defined as weight in kilograms/(height in meters)2. Number of chronic health conditions was assessed based on the sum of eight self-reported medically diagnosed chronic health conditions (high blood pressure, diabetes, cancer, lung disease, heart disease, stroke, psychiatric problems and arthritis).
Analytic Approach
All statistical analyses were conducted using SAS software 9.4 (Cary, NC) (19). Bivariate differences between individuals who were weak versus non-weak were assessed using t-tests for continuous variables and chi-square tests for categorical variables. Descriptive analyses were weighted using HRS sampling weights, and statistical significance was assessed with a two-tailed alpha of 0.05. The Kaplan-Meier method was used to generate time-to-event unadjusted baseline survival curves in which the median survival time was calculated. Log-rank tests were used to test whether the survival curves differed between weak versus non-weak individuals across the study period.
Weighted, fully-adjusted, extended Cox models for time-dependent variables were used to estimate hazard ratios (HRs) for mortality among weak versus non-weak individuals (20). Survival was defined as time from baseline interview to date of death, proxy-reported death, or last interview. HRs and 95% confidence intervals (CIs) were obtained.
Results
Baseline demographic characteristics of the study sample are reported in Table 2. In this nationally representative sample of 8,326 older adults (mean age = 79.9 years), 46% were considered weak at baseline based on the sex- and race-specific grip strength cutpoints. Weak individuals were more likely to be older compared to non-weak individuals (82 years of age vs 78 years, respectively; p < .001), and women were more likely to be weak than men (65% vs 35%, respectively; p < .001). Whites were more likely to be weak compared to blacks (87% vs 13%, respectively; p < .001).
Baseline Demographic Characteristics of Adults Age 65+ in the Health and Retirement Study (n = 8,326), 2006–2014
| Weak (n = 3,821) | Non-Weak (n = 4,505) | ||
|---|---|---|---|
| Mean (SE) | Mean (SE) | p-value | |
| Age (y) | 82.6 (0.10) | 78.4 (0.13) | <.0001 |
| BMI | 25.9 (0.10) | 27.3 (0.09) | <.0001 |
| Chronic conditions | 3.1 (0.03) | 2.7 (0.02) | .2 |
| Na (%)b | Na (%)b | ||
| Sex | <.0001 | ||
| Males | 1,339 (35.4) | 2,235 (49.9) | |
| Females | 2,482 (64.7) | 2,270 (50.1) | |
| Race/ethnicity | <.0001 | ||
| Whites | 3,011 (86.9) | 4,254 (96.9) | |
| Blacks | 810 (13.1) | 251 (3.1) | |
| Education | |||
| Less than a HS degree | 1,102 (27.1) | 834 (17.7) | <.0001 |
| GED | 146 (3.6) | 221 (4.6) | |
| High School | 1,270 (34.3) | 1,543 (34) | |
| Some College | 692 (18.3) | 955 (21.5) | |
| College and above | 611 (16.7) | 951 (22.3) | |
| Smoking status | <.0001 | ||
| Never | 1,757 (45.7) | 1,873 (41) | |
| Former | 1,816 (48) | 2,284 (51.3) | |
| Current | 248 (6.3) | 348 (7.8) | |
| Physical activity | <.0001 | ||
| Active | 1,951 (50.9) | 3,176 (70.6) | |
| Inactive | 1,870 (49.1) | 1,329 (29.4) | |
Notes: BMI = Body mass index.
aNumber of participants, unweighted.
bPercentage, weighted.
Across the 9-year study period, the median follow-up time was 8.3 (±1.9 SD) years. 1,743 (21%) individuals died and 6,593 (79%) individuals were censored. Among those who censored, 6,570 were alive at the end of the study period and 23 were lost to follow up. Out of the 1,743 individuals who died, 1,267 (72%) were weak at baseline and 532 (28%) were non-weak. When comparing the baseline survival curves of weak versus non-weak individuals across the 9-year observation period, the results of the Log-Rank test indicated they were significantly different from one another (p < .001) (Figure 1).
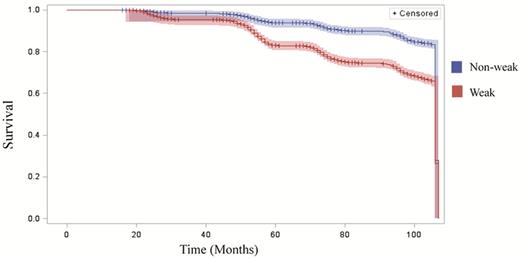
Kaplan-Meier survival curves comparing weak and non-weak individuals (N = 8,326), 2006–2014.
Table 3 presents the results from the extended Cox models. In the unadjusted model (Model 1, Table 3), muscle weakness was associated with a nearly 60% greater risk of death over the follow-up period (HR = 1.59, 95% CI = 1.42, 1.77). After adjusting for sociodemographic factors and smoking history (Model 2, Table 3) weak individuals were over 50% more likely to die earlier compared to non-weak individuals (HR = 1.52, 95% CI = 1.15, 1.47) (Model 2, Table 3). Further adjusting for time-varying body mass, number of chronic health conditions, and physical activity resulted in an attenuation of HR; however, the association remained significant (Model 3, Table 3). Adjusting for individual chronic health conditions also not change the overall hazard ration (Model 4, Supplementary Data).
Extended Cox Proportional Hazard Models: Association Between Muscle Weakness and Mortality in the Health and Retirement Study (N = 8,326), 2006–2014
| Model 1 | Model 2 | Model 3f | ||||
|---|---|---|---|---|---|---|
| Hazard Ratio | 95% CI | Hazard Ratio | 95% CI | Hazard Ratio | 95% CI | |
| Weaka | 1.59*** | 1.42, 1.77 | 1.52*** | 1.15, 1.47 | 1.32*** | 1.17, 1.48 |
| Demographic factors | ||||||
| Age (years) | 1.02** | 1.01, 1.03 | 1.00 | 0.99, 1.01 | ||
| Femaleb | 0.73*** | 0.66, 0.81 | 0.67*** | 0.60, 0.74 | ||
| Blackc | 0.86 | 0.74, 1.01 | 0.87 | 0.74, 1.01 | ||
| Educationd | ||||||
| GED | 0.78* | 0.60, 1.00 | 0.78 | 0.61, 1.02 | ||
| High School | 0.71*** | 0.63, 0.82 | 0.75*** | 0.65, 0.85 | ||
| Some college | 0.71*** | 0.63, 0.83 | 0.78** | 0.67, 0.90 | ||
| College and above | 0.54*** | 0.46, 0.64 | 0.59*** | 0.50, 0.70 | ||
| Smoking statuse | ||||||
| Former | 1.42*** | 1.27, 1.59 | 1.32*** | 1.18, 1.49 | ||
| Current | 2.06*** | 1.70, 2.49 | 1.60*** | 1.31, 1.96 | ||
Notes: CI = confidence interval.
aReference group is Non-weak.
bReference group is Male.
cReference group is White.
dReference group is Less than High School education.
eReference group is never smoker.
fFurther adjusted for body mass index, chronic conditions and physical activity.
*p < .05, **p < .01, ***p < .0001.
Discussion
Using data from a nationally representative sample of older Americans, this study demonstrated that muscle weakness, as indexed by validated thresholds of handgrip strength, was strongly associated with early mortality. Across a 9-year follow-up period with time-varying measures of weakness, older adults classified as weak were 50% more likely to die earlier compared to those who were not weak, even after adjusting for other time-varying risk factors. These findings provide support that grip strength is an important clinical marker for identifying those who may be most at risk for negative health outcomes, including early mortality.
The majority of studies focusing on the relationship between muscle weakness and mortality have relied on sample-specific definitions (3,7,10,21) and/or utilized data that are not representative of the diverse and rapidly growing population of older adults in the United States (2,22). For example, the Foundations of National Institutes of Health Sarcopenia Project recently proposed cutpoints for clinical muscle weakness and mass but were unable to explore differences in defining muscle weakness by various subgroups due to small sample size (23). Similarly, the European Working Group on Sarcopenia in Older People (EWGSOP) proposed muscle weakness cutpoints that relied on a sample-specific definition derived in cross-sectional setting (24). As a result, there is a paucity of research that has adequately quantified the true burden of muscle weakness on survival in older Americans within a longitudinal, racially/ethnically diverse context.
The results of this study are consistent with a growing body of research that has demonstrated that muscle weakness, as measured by handgrip strength, is associated with mortality (8,12,25). Indeed, several epidemiological studies have found grip strength to be inversely related to all-cause and cause-specific mortality in mid-life (9,26), older (1,6,10) and the oldest old (27) populations, although in a few studies, this relationship held for men but not women (6,28). In a meta-analysis comprised of 14 studies and close to 54,000 participants, those in the lowest quartile of grip strength measurement were 67% more likely to die earlier compared to those in the highest quartile, even after adjusting for sex, body mass, and age (29). In the Prospective Urban Rural Epidemiology study among nearly 140,000 adults 35–70 years of age with 4 years of follow-up, poor grip strength was the strongest predictor of early cardiovascular and all-cause mortality, even compared to other traditional clinical indicators such as systolic blood pressure (8). Thus, muscle strength remains an important and robust predictor of mortality risk as individuals age over time.
Despite previous cross-sectional work that has almost exclusively focused on muscle mass, a growing body of longitudinal research has demonstrated that declines in muscle strength outpaces that of muscle mass (11,30,31), implying that muscle strength may not only be an important predictor of muscle health but a more sensitive measurement with respect to clinical intervention. Moreover, handgrip strength, which is the most common assessment of muscle strength in research and clinical practice (32), has been found to be independently associated with mobility limitations, physical functioning, and disability (4,33). Therefore, there is a growing call among researchers and clinicians to consider muscle strength as a composite biomarker of muscle mass and function (34).
While the mechanisms underlying the muscle weakness-mortality association have not been fully elucidated, there are likely several underlying pathways driving the association between muscle weakness and premature mortality. Several studies have shown muscle weakness is associated with higher fasting insulin levels (35) and a precursor to insulin resistance (36). Muscle weakness has also been found to be independently associated with an increased odds of experiencing diabetes (37) and metabolic syndrome (38) in adults. Maintaining muscle strength may play a critical role in preventing metabolic and cardiovascular disease risk with aging, and thus protecting against premature mortality.
Weak individuals are also more likely to report greater difficulty in completing basic self-care activities (25) and experience greater odds of disability onset, progression and persistence over time (4). Therefore, the association between muscle weakness and mortality may be mediated by changes in physical functioning. Individuals with low levels of physical activity are more likely to experience declines in muscle strength, thereby entering a negative feedback loop where weak individuals are unable to participate in physical activity and are more vulnerable to declines in their physical health status, leading to subsequent declines and risk for early mortality. Taken together, handgrip strength may function as a crude but effective measurement of one’s physical health status even if the underlying mechanisms of the strength-mortality association may not be fully understood.
Of note, the estimated survival functions for weak and non-weak individuals at baseline did not begin to diverge until month 50, a little more than 4-years into the follow-up period. This implies muscle weakness may be associated with a slow decline in health and functioning and indirectly associated with the onset of premature mortality. In other words, muscle weakness does not lead to an immediate, precipitous decline in health, but rather may initiate a cascade of negative health events associated with compromised survival in later life. Indeed, understanding the complex, underlying pathways driving the results observed in this study warrants further investigation.
The results of this study support the use of nationally representative grip strength cutpoints for clinical muscle weakness derived in a diverse sample of older adults (16) as a brief screening tool to easily identify those who may be most vulnerable to negative health outcomes. Given the ease and cost-effectiveness of measuring handgrip strength, combined with the robust literature demonstrating that grip strength may serve as a biomarker of healthy aging, the cutpoints utilized in this study can be applied in other data that seek to define muscle weakness. These cutpoints can also be used in the clinical setting as a quick and inexpensive way of identifying those older adults who may be most vulnerable to future declines in health status.
This study had several notable strengths. First, to the best of our knowledge, this is the first study using sex- and race-specific muscle weakness cutpoints derived in a nationally-representative, diverse sample of older Americans to examine the relationship between time-varying muscle weakness and mortality. Therefore, the results presented in this manuscript can be generalized to community-dwelling, older black and white American adults aged 65 years and older in the United States. Second, the statistical analysis used both time-varying weakness variables and time-varying covariates, an important analytic consideration when examining a longitudinal association when exposure status is known to change over time. Previous research examining the muscle weakness-mortality association included fixed, baseline covariates only. This approach makes the assumption that muscle weakness remains stable over time, which is unlikely to be the case (12). Third, the cutpoints utilized in this study to define muscle weakness were derived using handgrip strength measurements. Grip strength dynamometers have been shown to be a cost-effective, quick, and a simple instrument that can be readily utilized within the clinical setting (40). The grip strength cutpoints presented in this paper offer clinicians the opportunity to incorporate handgrip assessments into medical practice for screening and identifying at-risk older individuals.
Despite these strengths, this study has several limitations. First, participants were interviewed every 2 years and there may be other competing events (i.e. acute hospitalization following a medical event) in the intervening period that could not be accounted for. Future studies should examine the muscle weakness-mortality association in surveys that have more frequent follow-up over time. Second, the results of this study can only be generalized to individuals aged 65 years and older. Since the cutpoints utilized in this study were derived in an older population, we are unable to assess the muscle weakness-mortality association in middle age, which may serve as an important age for intervention.
This is the first study to use muscle weakness cutpoints derived in a nationally representative sample of black and white older Americans to identify those who may be at greatest risk for premature mortality. Results underscore the importance of muscle weakness as a key risk factor for premature mortality in older Americans.
Funding
This work was supported by the National Institute on Aging of the National Institutes of Health (grant number T32AG027708). The content is solely the responsibility of the authors and does not necessarily represent the official views of the National Institutes of Health.
Acknowledgments
The study author gratefully acknowledges Philippa Clarke and Mark Peterson for their careful review of the manuscript and Chris Andrews for his statistical assistance. K.D. is responsible for the conception of the research question, conducted all analyses, interpreted the data and prepared the manuscript. The funders had no role in the design and conduct of the study; the collection, analysis, and interpretation of the data; or the preparation, review, or approval of the manuscript.
Conflict of interest
None declared.

